
Articles
- Page Path
- HOME > J Prev Med Public Health > Volume 53(3); 2020 > Article
-
Original Article
Contextual and Individual Determinants of Mental Health: A Cross-sectional Multilevel Study in Tehran, Iran -
Homeira Sajjadi1
 , Gholamreza Ghaedamini Harouni2, Hassan Rafiey3, Mohammadreza Vaez-Mahdavi4, Meroe Vameghi2, Seyed Hossein Mohaqeqi Kamal3
 -
Journal of Preventive Medicine and Public Health 2020;53(3):189-197.
DOI: https://doi.org/10.3961/jpmph.19.150
Published online: April 14, 2020
1Social Determinants of Health Research Center, University of Social Welfare and Rehabilitation Sciences, Tehran, Iran
2Social Welfare Management Research Center, University of Social Welfare and Rehabilitation Sciences, Tehran, Iran
3Department of Social Welfare Management, University of Social Welfare and Rehabilitation Sciences, Tehran, Iran
4Department of Physiology, Shahed University, Tehran, Iran
- Corresponding author: Gholamreza Ghaedamini Harouni, PhD Social Welfare Management Research Center, University of Social Welfare and Rehabilitation Sciences, Tehran 009821, Iran E-mail: qaedamini@gmail.com
Copyright © 2020 The Korean Society for Preventive Medicine
This is an Open Access article distributed under the terms of the Creative Commons Attribution Non-Commercial License (http://creativecommons.org/licenses/by-nc/4.0/) which permits unrestricted non-commercial use, distribution, and reproduction in any medium, provided the original work is properly cited.
ABSTRACT
-
Objectives
- Our aim was to answer the following questions: (1) Can mental health variance be partitioned to individual and higher levels (e.g., neighborhood and district); (2) How much (as a percentage) do individual-level determinants explain the variability of mental health at the individual-level; and (3) How much do determinants at the neighborhood- or district-level explain the variability of mental health at the neighborhood- or district-level?
-
Methods
- We used raw data from the second round of the Urban Health Equity Assessment and Response Tool in Tehran (in 2012-2013, n=34 700 samples nested in 368 neighborhoods nested in 22 districts) and the results of the official report of Tehran’s Center of Studies and Planning (in 2012-2013, n=22 districts). Multilevel linear regression models were used to answer the study questions.
-
Results
- Approximately 40% of Tehran residents provided responses suggestive of having mental health disorders (30-52%). According to estimates of residual variance, 7% of mental health variance was determined to be at the neighborhood-level and 93% at the individual-level. Approximately 21% of mental health variance at the individual-level and 49% of the remaining mental health variance at the neighborhood-level were determined by determinants at the individual-level and neighborhood-level, respectively.
-
Conclusions
- If we want to make the most effective decisions about the determinants of mental health, in addition to considering the therapeutic perspective, we should have a systemic or contextual view of the determinants of mental health.
- According to previous studies, the prevalence of mental health disorders is growing. In 2010, mental health disorders and substance use accounted for 7.4% of all disability-adjusted life years, 0.5% of all years of life lost (YLLs), and 22.9% of all years lived with disability worldwide [1]. Moreover, according to the Mental Health Atlas 2014, 20% of the world’s children and adolescents have mental disorders or problems, accounting for about 23% of all YLLs [2]; it is estimated that this figure will increase to 15% by 2020 [3]. In Iran, the prevalence of mental health disorders among people age 15 and older in 1999 [4] and 2015 [5] has been reported to be about 20.0% and 23.4%, respectively.
- Because of the fundamental links among physical health, quality of life, and mental health [3], and due to the increasing rate of mental health disorders in many countries throughout the world, nations must have effective and unified plans to promote the health of the entire population. Thus, public health strategies need to carefully consider the social and physical environments in which the urban population lives and should investigate ecological solutions combined with interventions at a personal-level [6]. Although ecological interventions may not be a sufficient solution to produce health improvements, they may be necessary requirements for personal-level interventions to be effective [7]. Thus, in order to take into account these 2 required conditions, multilevel analysis has been developed in the literature [8].
- This paper focuses on the relationship between neighborhood characteristics and personal mental health status. Neighborhood context is measured by objective (assessed independently of residents’ personal attributes) and subjective (drawing from information collected from individual residents) indicators [9]. According to Aneshensel et al. [9] several significant publications have considered the ways in which neighborhood context might be associated with mental health status, upon which basis they developed a model to explain the effects of objective and subjective factors on mental health at the individual-level.
- Considering the increasing trend of mental health disorders [4,10,11], and the necessity of designing effective interventions at different-levels to reduce and prevent these disorders, the present study was designed to generate the required knowledge and documentation in this field by answering 3 basic questions: (1) Can mental health variance be partitioned to individual-level and neighborhood-level; (2) How much do individual-level determinants explain the variability of mental health at the individual-level; and (3) How much do determinants at the neighborhood-level explain the variability of mental health at the neighborhood-level?
INTRODUCTION
- Data Source
- Two sources of data were used in this study: raw data from the second round of the Urban Health Equity Assessment and Response Tool (Urban HEART), which was conducted in 22 districts of Tehran in 2012-2013 [12], and the results of the official report of Tehran’s Center of Studies and Planning based on those 22 districts [13]. The first data source was used to examine the outcome (mental health) and its determinants (at the individual-level, and neighborhood-level), and the second source was used for assessing determinants at the neighborhood-level.
- Study Population and Samples
- The statistical population consisted of all residents of the 22 districts of Tehran in 2011. The sample of this study, which was selected for the Urban HEART study by a multiple (stratified, clustered, systematic) sampling method, included all individuals whose mental health status had been measured (n=34 700). The sample size included all 22 municipality districts and 368 neighborhoods in Tehran [12].
- The Measurement Tools and Variables
- Mental health status was measured using the 28-item General Health Questionnaire. The validity and reliability of this questionnaire have been confirmed in Iran [14]. In this questionnaire, higher scores indicate worse mental health [14].
- The individual-level factors included socioeconomic status (SES), which was generated through exploratory principal component analysis (PCA) using variables such as having a car, freezer, dishwasher, and microwave, as well as the education-level of the participant and participant’s father. These variables formed a component with a total explained variance of 37.9%. Finally, the z-scores that were obtained (the higher the z-score, the better the SES) of the component were divided into 3 categories: low (quartile 1), moderate (quartiles 2 and 3), and high (quartile 4).
- The variable of food security was also generated using the PCA technique and based on a combination of insufficient money to buy food in the past 30 days, eating less food due to a lack of money in the past 30 days, reduced or eliminated meals due to a lack of money, eating less food than the body’s requirements because of a lack of money, and not having food when being hungry due to a lack of money. These variables formed a component with a total explained variance of 64.7%. Finally, the variable of food security was entered into the model as the z-score. The higher the z-score, the higher the food security.
- The variable of physical activity was computed by the PCA technique using a combination of having a bicycle for commuting, engaging in intense physical activity or recreation, and engaging in intense or moderate recreational activity. These variables formed a component with a total explained variance of 53.2%. Finally, the variable of physical activity was entered into the model as the z-score. The higher the z-score, the higher the level of physical activity. Body mass index (BMI) was divided into four categories: low weight (18.5 kg/m2 or less), normal (18.6-24.9 kg/m2), high (25.0-29.9 kg/m2), and obese (30.0 kg/m2 or higher).
- The variable of physical pain was generated by the PCA technique and measured by various types of pain in the back, neck, shoulder, knee, head, upper limbs, lower limbs, and teeth. These 8 variables formed a component with a total explained variance of 35.4%. It was entered into the model as the z-score. Higher z-scores indicated higher-levels of physical pain.
- The 3 variables of social relations, social participation, and view of society were measured through the use of a standardized social capital tool. The higher the score, the better the status of each variable. Finally, the variables of occurrence of an accident for a family member (yes, no), the occurrence of domestic violence (yes, no), the presence of a disabled person in the family (yes, no), smoking by family members (yes, no), the presence of an addicted person in the family (yes, no), waiting time at the bus stop (in minutes), nationality (Iranian, non-Iranian), and gender (men, women) were entered into the models as dummy variables.
- These variables included unemployment rate (as a percentage), developmental-level, duration of residence in the neighborhood (in years), perceived societal security (higher scores equal more societal security), green space per capita (in square meters) and percentage of clean days. The variable of duration of residence in the neighborhood was aggregated from individual-level data of the Urban HEART at the neighborhood-level and the remaining variables were gathered based on the results of the Tehran Center of Study and Planning’s project [13] and disaggregated to the neighborhood-level.
- Statistical Analysis
- Multilevel linear regression was used to analyze the data. We used the 2 indexes of the intra-class correlation coefficient (ICC) (formula 1) and design effect (DE) (formula 2) to select an ordinary regression model or multilevel regression model. According to the literature, an ICC between 0.05 and 0.20 and a DE greater than 2.00 justifies the implementation of a cross-sectional multilevel model [15]. To select the null-based model, various models were implemented, and the most optimal model was finally selected. For this purpose, in addition to the ICC and design size indexes, we considered 3 indexes—the Akaike information criterion (AIC), the Bayesian information criterion (BIC), and log likelihood (LL)—and available data for the predictor variables at the second-level (neighborhood).
- The value of the variance that was determined by the predictors was calculated at the individual-level by formula 3 and at the neighborhood-level by formula 4. Data were analyzed using Stata version 13(StataCorp., College Station, TX, USA).
- In formula 1,
- In formula 2, nc, N, and k represent the average size of the clusters, sample size, and number of clusters, respectively.
- In formulas 3 and 4, b and m stand for variance in the null and full models, respectively.
- Ethics Statement
- The study was reviewed and approved by the Human Research Ethics Board at the University of Social Welfare and Rehabilitation Sciences (No. 96/801/T/2318/1).
METHODS
Outcome variable
Mental health determinants at the individual-level
Mental health determinants at the neighborhood-level
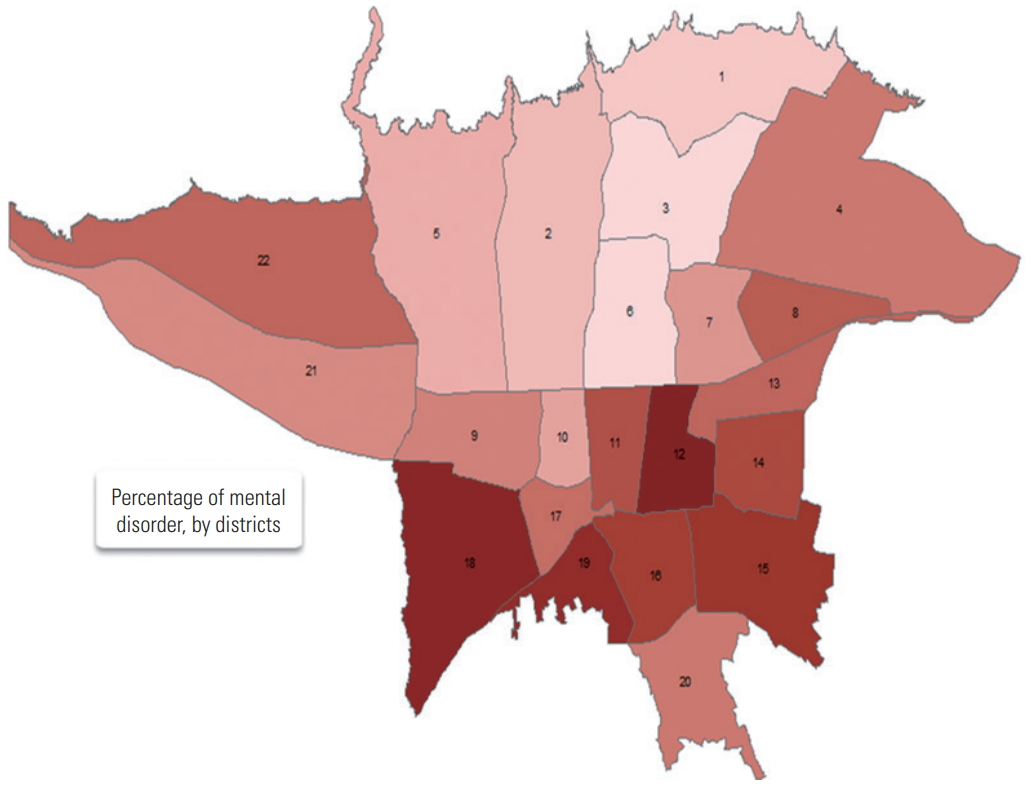
- Descriptive statistics of each variable at the individual-level and neighborhood-level and the mental health status for each of the 22 districts of Tehran is presented in Tables 1 and 2, respectively. The prevalence of mental health disorders was computed with a cut-off point of 23. According to the distribution of prevalence (Figure 1, Table 2), we found that district 12 of Tehran had the worst mental health status and districts 3 and 6 had the best mental health status.
- To define a full regression model, multiple steps were taken. First, for the null single-level model, the model was run by entering the variable of the outcome into the model without any determinants at the individual-level or variables related to higher-levels (Table 3). This was also the basis for reducing the value of individual-level variance in multilevel analysis models.
- The null 2-level (individual-neighborhood) model was run by entering the outcome variable (mental health) and second-level variables (neighborhood) into the model. This model had suitable conditions for a multilevel analysis (ICC=6.83%; DE=6.5) (Table 3). The null 3-level (individual-neighborhood-district) model was run by entering the outcome variable (mental health), second-level variables (district, ICC=1.60%), and third-level variables (neighborhood, ICC=6.83%; DE=6.5%). According to the calculated indexes, this model did not have suitable conditions for a multilevel analysis (Table 3).
- According to the summary of the obtained indexes (Table 3) among the 3 models, the multilevel model had higher fitness than the ordinary regression model (significant reduction in the AIC and BIC and increase in the LL). Among the alternative null models, the 2-level individual-neighborhood model was selected as the null-base model.
- After selecting the multilevel null-base model, the determinants of mental health at the individual-level and neighborhood-level were entered into the model. According to the obtained fitness indexes (Table 3), we found that this model had higher fitness than previous models. According to the remaining variance in the 2-level null-base and full models, we calculated the coefficients of model determinants. Accordingly, the predictor variables added to the model at the individual-level explained 20.70% ([(30.14-23.90)/30.14]×100) of variation in mental health scores, and the predictor variables at the neighborhood-level explained 48.64% ([(2.20-1.13)/2.20]×100) of the variation in mental health scores.
- The obtained regression coefficients showed that non-Iranian nationality, men gender, the lack of a disabled person or accident victim in the family, the lack of domestic violence, the lack of a cigarette smoker or drug-addicted person in the family, higher physical activity, higher food security, less physical pain, higher social interaction and participation, and a positive attitude toward society were correlated with higher mental health scores. In contrast, being underweight and having low or moderate SES were correlated with poorer mental health.
- Additionally, at the neighborhood-level, the unemployment rate was correlated with lower mental health scores, and the level of neighborhood development, duration of residence in the neighborhood, and perceived societal security were correlated with higher mental health scores. These results were obtained by controlling for the variables at the individual-level (Table 4).
RESULTS
- The growth of mental health disorders in Tehran shows that interventions at the individual-level alone are not enough to reduce or prevent this trend. In other words, although interventions at the individual-level are required, determinants at the super-individual-level also need to be considered to make interventions more effective [6,7,16]. Therefore, the present study was designed to determine whether factors causing mental health disorders are present not only at the individual-level, but also at the super-individual-level.
- Based on the ICC, roughly 7% of mental health variance was determined by variables at the neighborhood-level, while the rest was accounted for by variables at the individual-level. This result is in line with the findings of Fone and Dunstan [17]. According to final full multilevel model, approximately 21% of the mental health variance at the individual-level and about 49% of the remaining mental health variance at the neighborhood-level were determined by determinants at the individual-level and neighborhood-level, respectively.
- At the individual-level, non-Iranian nationality, men gender, the lack of a disabled person or accident victim in the family, the absence of domestic violence in the family, the lack of a cigarette smoker or drug-addicted person in the family, higher physical activity, higher food security, lower physical pain, higher social interaction and participation, and a positive attitude toward society were correlated with higher mental health scores. Being underweight and having low or moderate SES were correlated with lower mental health scores. The remaining 79% of unexplained variance may be attributed to other personality traits such as self-esteem [18,19], coping skills [20], and so on at this-level.
- At the neighborhood-level, a higher unemployment rate was associated with lower mental health scores, and the level of neighborhood development, duration of residence in the neighborhood, and perceived societal security were correlated with higher mental health scores. The remaining 51% of unexplained variance can be attributed to variables such as the number of parks and gardens [21]; the distance between places of residence and green spaces, parks, and gardens [22]; socioeconomic conditions of the neighborhood [23-26]; the neighborhood’s built environment, such as the physical characteristics of buildings, streets, and other structural features of neighborhoods; the public transport system; socioeconomic inequalities [27], and so forth. In this study, no data were available about these factors.
- The results of this study, in line with the findings of other studies, showed that at the individual-level, having high social capital [25,28-31], having high SES, engaging in higher-levels of physical activity [16,23,32-35], having higher food security [36-38], having higher physical health [39,40], exposure to fewer risk factors such as drug use and tobacco smoke in the family, lack of a disabled person in the family, and lower occurrence of accidents among family members [30] were correlated with higher mental health scores. Furthermore, in line with other studies at the individual-level, it was found that men had more favorable mental health status (good health) than women, as did people of other nationalities compared to Iranians. Furthermore, those who were considered underweight according to BMI had lower mental health status compared to the other 3 BMI categories (normal, overweight, and obese). In line with other studies at the neighborhood-level, higher unemployment was associated with poorer mental health status [25], and a higher-level of neighborhood development, longer residence in the neighborhood, and a high-level of perceived societal security were associated with more favorable mental health status.
- The shortcomings and limitations of the present study indicate that in Iran and in particular its capital (Tehran), there is a major information gap about the characteristics of Tehran’s neighborhoods and its 22 districts, underscoring the need for a systematic view of mental health determinants. A review of studies, especially those conducted in Iran, indicated that all of these studies have been done at the individual-level. One of the reasons for this could be that mental health is considered a personal phenomenon and that a more therapeutic perspective toward it therefore predominates.
- Furthermore, mental health disorders account for 69% of the total costs of hospitals (in Iran), while in high-income countries this figure is about 35% [2]. However, although considerable financial resources are spent to cure such disorders, the results of this study and previous studies [4,10] show that the prevalence of mental health disorders in the general population is increasing, which demonstrates the insufficiency of the therapeutic perspective to treat and improve mental health and shows that variables at the super-individual-level are being ignored.
- Therefore, according to the results of this study, to improve the mental health status in the entire population, we must consider all conditions. Steps that could help improve the mental health of all citizens include recording individual-level data through surveys, having health centers systematically record data at super-individual-levels from the family to the national-level, and having a systematic vision by high-level managers at the Ministry of Health and other related organizations. Undoubtedly, the availability of these measures to be taken will provide conditions for field research to be directed toward this phenomenon in order to produce sufficient evidence to test these theoretical models.
- When interpreting the results of this study, the following limitations should be considered. First, the population of this study sample was people 15–99 years old. Therefore, for specific age groups, the results should be interpreted with caution and, if needed, specific models should be developed for each age group. Second, the estimated models are specific to the city of Tehran, and their generalizability to other cities and contexts requires further examination. Finally, the results of this study are based on cross-sectional data, so any causal interpretation of the results should be made with caution.
- The present study showed that to design interventions for preventing and improving mental health status in the whole population, variables at both the individual-level and super-individual-level should be considered. In fact, failure to consider either of these levels could result in fallacious and incorrect decisions about determinants, leading to ineffective actions to prevent and improve mental health.
DISCUSSION
-
CONFLICT OF INTEREST
The authors have no conflicts of interest associated with the material presented in this paper.
-
FUNDING
None.
Notes
ACKNOWLEDGEMENTS
-
AUTHOR CONTRIBUTIONS
Conceptualization: GGH, HS. Data curation: HS, GGH, HR. Formal analysis: GGH, HR. Funding acquisition: HS. Methodology: GGH, HS, HR. Project administration: MVM, SHMK. Visualization: GGH, HS. Writing - original draft: GGH, HS, HR, MV, MVM, SHMK. Writing - review & editing: GGH, HS.
Notes
| Factors | n (%) or mean±SD |
|---|---|
| Individual-level | |
| Gender | |
| Women | 12 961 (50.4) |
| Men | 11 960 (49.6) |
| Nationality | |
| Iranian | 24 353 (98.6) |
| Other | 342 (1.4) |
| Accident in the family | |
| Yes | 1899 (7.7) |
| No | 22 875 (92.3) |
| Domestic violence | |
| Yes | 1871 (7.8) |
| No | 22 267 (92.2) |
| Disability in the family | |
| Yes | 3573 (14.6) |
| No | 21 008 (85.4) |
| Smoking in the family | |
| Yes | 6012 (24.5) |
| No | 18 544 (75.5) |
| Addiction in the family | |
| Yes | 415 (1.7) |
| No | 24 191 (98.3) |
| Age (y) | 43.70±16.80 |
| Duration of residence (y) | 15.50±13.90 |
| Physical activity score | 1.07±0.97 |
| Food security score | 7.32±2.09 |
| Socioeconomic status | 5.50±2.84 |
| Social relationships score | 23.74±7.52 |
| Social participation score | 14.62±4.33 |
| Look at the community score | 20.28±7.30 |
| Physical pain score | 39.58±18.03 |
| Neighborhood-level (n = 368) | |
| Duration of residence (y)1 | 23.70±8.30 |
| Level of development (%) | 39.14±15.42 |
| Green spaces per capita (m2) | 12.86±12.35 |
| Unemployment rate (%) | 8.82±1.80 |
| Perceived societal security (%) | 63.33±17.24 |
| Clean days (%) | 54.50±33.22 |
| Waiting time at the bus stop (min)1 | 12.48±7.40 |
| Level | OLS1 | Two-level2 | Three-level3 | Full |
|---|---|---|---|---|
|
|
32.31 (0.31) | 30.14 (0.29) | 30.14 (0.29) | 24.07 (0.31) |
|
|
- | - | 0.35 (0.15) | - |
|
|
- | 2.20 (0.21) | 1.83 (0.19) | 1.15 (0.15) |
| Intraclass correlation (%) | - | 6.83 | 5.7, 1.1 | - |
| Design effect | - | 6.50 | - | - |
| AIC | 135 978 | 135 046 | 135 026 | 72 889 |
| BIC | 135 994 | 135 070 | 135 058 | 73 082 |
| LL | -67 987 | -67 520 | -67 509 | -36 418 |
OLS, ordinary least squares; SE, standard error; AIC, Akaike information criterion; BIC, Bayesian information criterion; LL, log likelihood.
1 Null (OLS) single-level model.
2 Individual-neighborhood (2-level) model.
3 Individual-neighborhood-district (3-level) model.
4 Variance at the individual-level.
5 Variance at the district-level.
6 Variance at the neighborhood-level.
| Personal/neighborhood properties |
Null model |
Full model |
|
|---|---|---|---|
| Single-level, β (SE) | Multilevel, coefficient (SE) | Multilevel, coefficient (SE) | |
| Individual-level | |||
| Nationality, Iranian (Ref: other nationalities) | 1.029 (0.330)** | ||
| Gender (Ref: women) | |||
| Men | -0.251 (0.080)** | ||
| BMI (Ref: normal) | |||
| Underweight | 0.948 (0.241)** | ||
| Overweight | -0.068 (0.088) | ||
| Obesity | 0.156 (0.117) | ||
| Socioeconomic status (Ref: high) | |||
| Bottom | 0.561 (0.129)** | ||
| Middle | 0.263 (0.103)** | ||
| Food security | -0.434 (0.020)** | ||
| Physical activity | -0.005 (0.001)** | ||
| Accident in the family (Ref: no accident) | 0.535 (0.145)** | ||
| Domestic violence (Ref: no violence) | 1.740 (0.149)** | ||
| Disabilities in the family (Ref: no disability) | 0.428 (0.115)** | ||
| Smoking in the family (Ref: no smoking) | 0.506 (0.091)** | ||
| Addiction in the family (Ref: no addiction) | 1.520 (0.303)** | ||
| Physical pain | 1.570 (0.041)** | ||
| Social relationships | -0.053 (0.006)** | ||
| Social participation | -0.083 (0.010)** | ||
| Look at the community | -0.102 (0.006)** | ||
| Neighborhood-level | |||
| Unemployment rate | 0.094 (0.032)** | ||
| Level of development | -0.013 (0.005)* | ||
| Duration of residence in neighborhood | -0.060 (0.019)* | ||
| Perceived societal security | -0.013 (0.004)** | ||
| Constant (SE) | 5.680 (0.038)** | 5.730 (0.089)** | 15.120 (0.650)** |
| Random effects | |||
| σ2e (SE) [Individual] | 32.31 (0.31) | 30.14 (0.29) | 23.90 (0.26) |
| σ2v0 (SE) [Neighborhood] | - | 2.20 (0.21) | 1.13 (0.15) |
- 1. Whiteford HA, Degenhardt L, Rehm J, Baxter AJ, Ferrari AJ, Erskine HE, et al. Global burden of disease attributable to mental and substance use disorders: findings from the Global Burden of Disease Study 2010. Lancet 2013;382(9904):1575-1586ArticlePubMed
- 2. World Health Organization. Mental health atlas 2014. 2015 [cited 2020 May 13]. Available from: https://www.who.int/mental_health/evidence/atlas/mental_health_atlas_2014/en/
- 3. Murray CJ, Lopez AD. The global burden of disease: a comprehensive assessment of mortality and disability from diseases, injuries, and risk factors in 1990 and projected to 2020. 1996 [cited 2020 May 13]. Available from: https://apps.who.int/iris/handle/10665/41864
- 4. Noorbala AA, Yazdi SB, Yasamy MT, Mohammad K. Mental health survey of the adult population in Iran. Br J Psychiatry 2004;184(1):70-73ArticlePubMed
- 5. Noorbala AA, Faghihzadeh S, Kamali K, Bagheri Yazdi SA, Hajebi A, Mousavi MT, et al. Mental health survey of the Iranian adult population in 2015. Arch Iran Med 2017;20(3):128-134PubMed
- 6. Maller C, Townsend M, Pryor A, Brown P, St Leger L. Healthy nature healthy people: ‘contact with nature’ as an upstream health promotion intervention for populations. Health Promot Int 2006;21(1):45-54ArticlePubMedPDF
- 7. Kelly MP, McDaid D, Ludbrook A, Powell J. Economic appraisal of public health interventions. 2005 [cited 2020 May 14]. Available from: http://citeseerx.ist.psu.edu/viewdoc/download?doi=10.1.1.476.3820&rep=rep1&type=pdf
- 8. Maas CJ, Hox JJ. Robustness issues in multilevel regression analysis. Stat Neerl 2004;58(2):127-137Article
- 9. Aneshensel CS, Phelan JC, Bierman A. The sociology of mental health: surveying the field. In: Aneshensel CS, Phelan JC, Bierman A, editors. THandbook of the sociology of mental health. Dordrecht: Springer; 2013. p. 1-19
- 10. Noorbala AA, Mohammad K, Bagheri Yazdi SA. Prevalence of psychiatric disorders in Tehran city. Hakim 1998;2: 212-223. (Persian)
- 11. Noorbala A, Bagheri YS, Vaez Mahdavi MR, Asadi-Lari M, Faghihzadeh S, Mohammad K, et al. Mental health changes in Tehran during a 12-year period: comparing national health and disease survey in 1999 and equality project in 2011. Daneshvar Med 2014;22(113):37-45. (Persian)
- 12. Asadi-Lari M, Vaez-Mahdavi MR. An overview on Urban-HEART Tehran experience. 2008 [cited 2020 May 14]. Available from: https://www.alnap.org/help-library/an-overview-on-urbanheart-tehran-experience
- 13. Urban Research and Planning Center. Examining citizens’ health status and urban servicies among 22 municipality regions of Tehran. Tehran: Municipality of Tehran; 2012. p. 10-60 (Persian)
- 14. Noorbala AA, Mohammad K. The validation of general health questionnaire-28 as a psychiatric screening tool. Hakim Res J 2009;11(4):47-53. (Persian)
- 15. Peugh JL. A practical guide to multilevel modeling. J Sch Psychol 2010;48(1):85-112ArticlePubMed
- 16. McMichael AJ. Human culture, ecological change, and infectious disease: are we experiencing history’s fourth great transition? Ecosyst Health 2001;7(2):107-115Article
- 17. Fone DL, Dunstan F. Mental health, places and people: a multilevel analysis of economic inactivity and social deprivation. Health Place 2006;12(3):332-344ArticlePubMed
- 18. Mann MM, Hosman CM, Schaalma HP, De Vries NK. Self-esteem in a broad-spectrum approach for mental health promotion. Health Educ Res 2004;19(4):357-372ArticlePubMedPDF
- 19. Trzesniewski KH, Donnellan MB, Moffitt TE, Robins RW, Poulton R, Caspi A. Low self-esteem during adolescence predicts poor health, criminal behavior, and limited economic prospects during adulthood. Dev Psychol 2006;42(2):381-390ArticlePubMedPDF
- 20. Ito M, Matsushima E. Presentation of coping strategies associated with physical and mental health during health check-ups. Community Ment Health J 2017;53(3):297-305ArticlePubMedPDF
- 21. Cubbin C, Egerter S, Braveman P, Pedregon V. Where we live matters for our health: neighborhoods and health. 2008 [cited 2020 May 14]. Available from: https://folio.iupui.edu/bitstream/handle/10244/638/commissionneighborhood102008.pdf
- 22. Xu Y, Wen M, Wang F. Multilevel built environment features and individual odds of overweight and obesity in Utah. Appl Geogr 2015;60: 197-203ArticlePubMedPMC
- 23. Pickett KE, Pearl M. Multilevel analyses of neighbourhood socioeconomic context and health outcomes: a critical review. J Epidemiol Community Health 2001;55(2):111-122ArticlePubMedPMC
- 24. Malmström M, Sundquist J, Johansson SE. Neighborhood environment and self-reported health status: a multilevel analysis. Am J Public Health 1999;89(8):1181-1186ArticlePubMedPMC
- 25. Wight RG, Botticello AL, Aneshensel CS. Socioeconomic context, social support, and adolescent mental health: a multilevel investigation. J Youth Adolesc 2006;35(1):109ArticlePDF
- 26. Chuang YC, Cubbin C, Ahn D, Winkleby MA. Effects of neighbourhood socioeconomic status and convenience store concentration on individual level smoking. J Epidemiol Community Health 2005;59(7):568-573ArticlePubMedPMC
- 27. Park HY, Heo J, Subramanian SV, Kawachi I, Oh J. Socioeconomic inequalities in adolescent depression in South Korea: a multilevel analysis. PLoS One 2012;7(10):e47025ArticlePubMedPMC
- 28. Johansson de Silva S, Paci P, Posadas J. A checklist to avoid pilot failures: lessons from a set of women’s economic empowerment initiatives. J Dev Effect 2014;7(1):90-110Article
- 29. Hamano T, Fujisawa Y, Ishida Y, Subramanian SV, Kawachi I, Shiwaku K. Social capital and mental health in Japan: a multilevel analysis. PLoS One 2010;5(10):e13214ArticlePubMedPMC
- 30. Kazemi N, Sajjadi H, VaezMahdavi MR, Kamali M, Ghaedamini Harooni G, Jorjoran Shushtari Z. Relationship between social capital and mental health among families with disabled members. J Mazandaran Univ Med Sci 2017;27(147):197-206. (Persian)
- 31. Thoits PA. Mechanisms linking social ties and support to physical and mental health. J Health Soc Behav 2011;52(2):145-161ArticlePubMed
- 32. Buchman BP, Sallis JF, Criqui MH, Dimsdale JE, Kaplan RM. Physical activity, physical fitness, and psychological characteristics of medical students. J Psychosom Res 1991;35(2-3):197-208ArticlePubMed
- 33. Hassmén P, Koivula N, Uutela A. Physical exercise and psychological well-being: a population study in Finland. Prev Med 2000;30(1):17-25ArticlePubMed
- 34. Mortazavi SS, Ardebili HE, Eshaghi SR, Beni RD, Shahsiah M, Botlani S. The effectiveness of regular physical activity on mental health in elderly. J Isfahan Med Sch 2012;29(161):1519-1528. (Persian)
- 35. Macintyre S, Ellaway A. Ecological approaches: rediscovering the role of the physical and social environment. Soc Epidemiol 2000;9(5):332-348Article
- 36. Diez-Roux AV, Nieto FJ, Caulfield L, Tyroler HA, Watson RL, Szklo M. Neighbourhood differences in diet: the Atherosclerosis Risk in Communities (ARIC) Study. J Epidemiol Community Health 1999;53(1):55-63ArticlePubMedPMC
- 37. Tarasuk V, Mitchell A, McLaren L, McIntyre L. Chronic physical and mental health conditions among adults may increase vulnerability to household food insecurity. J Nutr 2013;143(11):1785-1793ArticlePubMedPDF
- 38. Davison KM, Gondara L, Kaplan BJ. Food insecurity, poor diet quality, and suboptimal intakes of folate and iron are independently associated with perceived mental health in Canadian adults. Nutrients 2017;9(3):E274Article
- 39. Gatchel RJ. Comorbidity of chronic pain and mental health disorders: the biopsychosocial perspective. Am Psychol 2004;59(8):795-805ArticlePubMedPDF
- 40. Helmer DA, Chandler HK, Quigley KS, Blatt M, Teichman R, Lange G. Chronic widespread pain, mental health, and physical role function in OEF/OIF veterans. Pain Med 2009;10(7):1174-1182ArticlePubMedPDF
REFERENCES
Figure & Data
References
Citations
- Multidimensional poverty index: a multilevel analysis of deprivation among Iranian older adults
Seyed Hossein Mohaqeqi Kamal, Mehdi Basakha, Sabina Alkire
Ageing and Society.2024; 44(2): 337. CrossRef - Parental Objective, Subjective, and Contextual Socioeconomic Status and Children's Mental Health in Iran: The Mediating Effect of the Subjective Measure
Ardavan Mohammad Aghaei, Lawrence Wissow, Ramin Mojtabai, Hadi Zarafshan, Zahra Shahrivar, Amir Hossein Nikzad, Vandad Sharifi
Iranian Journal of Psychiatry and Behavioral Sciences.2023;[Epub] CrossRef - This is the place: a multi-level analysis of neighbourhood correlates of adolescent wellbeing
Jose Marquez, Neil Humphrey, Louise Black, Sophie Wozmirska
Social Psychiatry and Psychiatric Epidemiology.2023;[Epub] CrossRef - Measuring and exploring mental health determinants: a closer look at co-residents’ effect using a multilevel structural equations model
Hend Gabr, Mohammed Baragilly, Brian H. Willis
BMC Medical Research Methodology.2022;[Epub] CrossRef
 PubReader
 ePub Link
 Cite
Cite

