Articles
- Page Path
- HOME > J Prev Med Public Health > Volume 53(4); 2020 > Article
-
Special Section: COVID-19Original Article
Social Determinants of COVID-19 in Massachusetts, United States: An Ecological Study -
Devan Hawkins

-
Journal of Preventive Medicine and Public Health 2020;53(4):220-227.
DOI: https://doi.org/10.3961/jpmph.20.256
Published online: June 24, 2020
Instructor of Public Health, Public Health Program, School of Arts and Sciences, MCPHS University, Boston, MA, USA
- Corresponding author: Devan Hawkins, ScD Instructor of Public Health, Public Health Program, School of Arts and Sciences, MCPHS University, 179 Longwood Avenue, Boston, MA 02115, USA E-mail: devan.hawkins@mcphs.edu
• Received: June 7, 2020 • Revised: June 23, 2020 • Accepted: June 24, 2020
Copyright © 2020 The Korean Society for Preventive Medicine
This is an Open Access article distributed under the terms of the Creative Commons Attribution Non-Commercial License (http://creativecommons.org/licenses/by-nc/4.0/) which permits unrestricted non-commercial use, distribution, and reproduction in any medium, provided the original work is properly cited.
ABSTRACT
-
Objectives
- The aim of this study was to assess how different social determinants of health (SDoH) may be related to variability in coronavirus disease 2019 (COVID-19) rates in cities and towns in Massachusetts (MA).
-
Methods
- Data about the total number of cases, tests, and rates of COVID-19 as of June 10, 2020 were obtained for cities and towns in MA. The data on COVID-19 were matched with data on various SDoH variables at the city and town level from the American Community Survey. These variables included information about income, poverty, employment, renting, and insurance coverage. We compared COVID-19 rates according to these SDoH variables.
-
Results
- There were clear gradients in the rates of COVID-19 according to SDoH variables. Communities with more poverty, lower income, lower insurance coverage, more unemployment, and a higher percentage of the workforce employed in essential services, including healthcare, had higher rates of COVID-19. Most of these differences were not accounted for by different rates of testing in these cities and towns.
-
Conclusions
- SDoH variables may explain some of the variability in the risk of COVID-19 across cities and towns in MA. Data about SDoH should be part of the standard surveillance for COVID-19. Efforts should be made to address social factors that may be putting communities at an elevated risk.
- It is clear that not everyone is equally impacted by the coronavirus disease 2019 (COVID-19) pandemic. In the United States, there are wide differences in the rates of confirmed cases. The rate of disease in New York (the state with the highest rate as of April 7, 2020) is more than 20 times higher than that of West Virginia (the state with the lowest rate) [1]. Findings have also emerged that racial and ethnic minorities may be at a particularly elevated risk for contracting COVID-19, being hospitalized, and dying from the disease [2,3]. Healthcare workers and other essential workers [4], a group that is disproportionally composed of people of color [5], are also likely to bear a disproportionate share of the burden of COVID-19. There have also been reports of homeless people being particularly vulnerable to contracting COVID-19 [6,7].
- The role that other social factors may play in explaining these differences deserves further attention. Unfortunately, limited data are available about COVID-19 cases and social factors. This lack of data about social determinants of health (SDoH) in United States data is a longstanding issue [8]. One method to deal with this problem is to use area-based measures of socioeconomic status [9]. Such measures can be applied to different geographic areas (cities/towns, zip codes, census tracts, etc.) to examine whether geographic variation in health outcomes may also be associated with geographic variation in SDoH.
- Previous research has demonstrated that some of the geographic variability in COVID-19 may be related to socioeconomic factors. For example, a study conducted in New York City found that the most socioeconomically disadvantaged boroughs with respect to poverty and education had the highest rates of COVID-19 hospitalizations and deaths [10]. Additional research has found that county-level variation in COVID-19 cases across the United States and changes in all-cause mortality rates in Massachusetts (MA) zip codes were associated with poverty and household crowding [11,12].
- In April 2020, MA began publishing data about confirmed cases of COVID-19 and the number of people tested for COVID-19 in cities and towns in MA [13]. This study sought to determine whether variations in the rates and trends in cases of COVID-19 and the percentage of positive tests for COVID-19 were associated with a variety of social factors including poverty, median income, employment in the health care and transportation industries and healthcare support and service occupations, rented accommodations, unemployment, and lack of insurance.
INTRODUCTION
- The cases of COVID-19 used in this study were based on the cumulative number of laboratory-confirmed cases of COVID-19 occurring in MA between January 1, 2020 and June 10, 2020. Cases were excluded from this analysis if they occurred in residents of towns with between 1 case and 4 cases (due to cell size suppression rules), had unknown data about the city and town where they occurred, or if we were unable to match the city/town to data about socioeconomic factors. MA provides estimates of the rates per 100 000 people in its cities and towns based on population estimates from the University of UMass Donahue Institute [13].
- Data about socioeconomic factors were derived from 5-year estimates (2014-2018) from the American Community Survey (ACS) in MA. The ACS is an annual survey that is conducted in order to generate representative demographic information about the United States population. Data were downloaded from https://data.census.gov/. The specific measures used in this analysis included median income; the percentage of residents who were uninsured, below the poverty line, unemployed, and renters; and percentage of workers employed in the transportation and healthcare and social assistance industries and in service and healthcare support occupations. For each of these measures, cities and towns were categorized into one of four categories according to the quartile of their percentage for the distribution of a given variable. For each of these quartiles, we calculated the number and percentage of all cases, the number of cases per 100 000 residents, and the percentage of those who were tested that tested positive. Table 1 shows the quartile cut-offs that were used for each variable. We also performed Poisson regression with a log-link using SAS version 9.3 (SAS Institute Inc., Cary, NC, USA) to calculate rate ratios comparing the rates and the percentages of positive tests in the quartiles. For rates of COVID-19, we constructed 3 models. In the first model, we only controlled for social variables. Because the number of confirmed cases of COVID-19 in a city or town will be associated with the percentage of the population in that city or town that was tested, we controlled for the proportion of residents of each city or town who were tested. In the final model, because of evidence that the rate of COVID-19 varies according to age [14], we controlled for the median age of the city or town. For the models examining differences in the percentage of positive cases, we constructed 2 models: the first examining only social variables, and the second controlling for median age.
- Because many of these variables are likely correlated with each other, which might make it difficult to determine the effect of any particular variable on COVID-19 rates, we also conducted Spearman rank correlation analysis between all of the variables to assess the strength of any correlations.
- Ethics Statement
- This study used de-identified publicly available data, and the study was therefore considered exempt from review by the MCPHS University Institutional Review Board.
METHODS
- As of June 10, 2020, there were a total of 100 158 cumulative cases of COVID-19 in MA, of which 275 cases were excluded from this analysis because they did not have city or town information. An additional 12 627 cases were excluded because they occurred in cities or towns with between 1 case and 4 cases (n=67) or in cities or towns that did not have information about social variables available from the ACS (n=12 560). Eighteen towns were excluded because they had between 1 case and 4 cases of COVID-19. Most of these were small towns in western MA. The communities with missing ACS data varied considerably in size, ranging from Billerica with a population of 42 664 to Gosnold with a population of 62. These exclusions resulted in a final sample of 87 256 cases of COVID-19 diagnosed in MA through June 10, 2020, representing 87.1% of the total cases diagnosed in MA. The number of cases per 100 000 people for the cities and towns included in the analysis (1584.8) was higher than that for the state overall (1437.7).
- As shown in Table 2, for the 9 variables analyzed, there was evidence of an association with cases of COVID-19. In particular, cities and towns with a higher percentage of residents living in poverty and lower median incomes tended to have elevated rates of COVID-19. With respect to employment, cities and towns with more workers employed in the healthcare and social assistance and transportation industries and in service and healthcare support occupations also tended to have higher rates of COVID 19. Furthermore, communities with a higher proportion of their population renting and uninsured had elevated COVID-19 rates. These seemed to be a positive relationship between the unemployment rate and rates of COVID-19; however, the fourth quartile only had a slightly higher rate than the third quartile.
- In general, more tests were performed per 100 000 residents in cities and towns with higher rates of COVID-19. When controlling for the proportion of residents who were tested, the rate ratios were generally attenuated. However, the above-described general patterns in terms of differences in rates were generally consistent, although the differences between quartiles were not as drastic. For example, while the second quartiles through fourth quartiles for employment in the healthcare and social assistance industry and service and healthcare support occupations had significantly higher ratios than the first quartile, they were not substantially different from each other. Controlling for the median age in communities did not have a substantial impact on the rate ratios (Table 2).
- As is shown in Table 3, cities and towns with higher levels of poverty, renting, and lack of insurance, lower median incomes, and higher employment in the transportation industry and service and healthcare support occupations tended to have a higher percentage of positive tests. With the exception of the findings for the percentage of residents who rented, these differences were not substantially impacted when controlling for the median age of cities and towns.
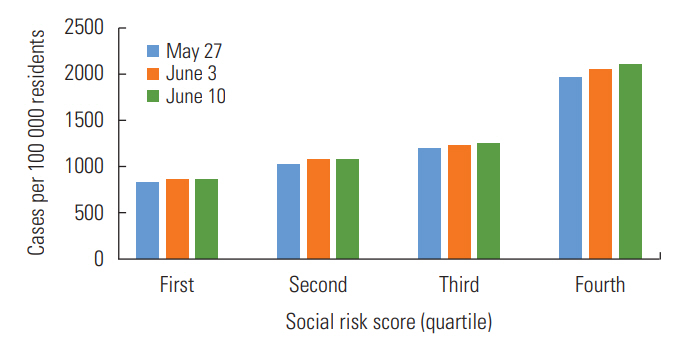
- As is shown in Figure 1, across the 3 time periods, the highest rate of COVID-19 was found among the highest risk score quartile and the lowest rate was found among the lowest risk score quartile. Additionally, the percent change was highest in the highest risk score quartile.
- As is shown in Supplemental Material 1, of the 36 combinations of variables, there was evidence for a moderate to strong correlation in 11 of these relationships In particular, the percentage of residents living in poverty was moderately to strongly associated with median income, employment in service occupations, the percentage of residents who rented, and the percentage of residents who were uninsured. In addition to the percentage of residents living in poverty, employment in service occupations was also moderately to strongly correlated with employment in healthcare support occupations and the percentage of residents who rented or were uninsured.
RESULTS
- The findings from this study highlight that the burden of COVID-19 in MA is falling most heavily on communities with a number of social vulnerabilities. These findings are suggestive of factors that may be contributing to geographic differences in COVID-19. Additionally, these findings suggest why some communities may be more vulnerable both to the health and financial impacts of the disease.
- Previous research has demonstrated that rates of infectious diseases tend to be associated with statewide poverty rates [15-17]. Such an association is concerning because poorer communities are often less equipped to deal with the health and financial consequences of COVID-19.
- The findings with respect to employment in high-risk industries and occupations are not surprising. A number of previous studies have demonstrated that healthcare workers are at an elevated risk for COVID-19 [18-20]. When many workers are practicing social distancing, it would be expected that essential industries that remain open would be a large driver of cases of COVID-19. Some studies have found differential risks for COVID-19 according to occupations outside of healthcare [21,22]. These findings suggest that working in high-risk and essential industries and occupations may be an important community-level determinant of the burden of COVID-19.
- The fact that the burden of COVID-19 is higher in communities with higher rates of unemployment and lack of insurance suggests that COVID-19 may further exacerbate financial challenges in these communities. Millions have already filed for unemployment in the wake of the COVID-19 pandemic [23]. As the recession worsens, the health consequences of higher baseline rates of lack of insurance and unemployment may also make these communities vulnerable to the other health consequences of poverty and inequality [24,25].
- There are limitations to these findings. This analysis was only done at the city and town level. Inferences cannot be made about individual-level factors solely from these ecological associations. Furthermore, the number of cases in a city or town is influenced by the accessibility and availability of testing for the disease. Rates may be lower in some communities not because there is a lower risk of COVID-19 in those communities, but because testing is less accessible. If such accessibility if differential with respect to any of the variables examined, these findings could be biased. Previous research in New York City found that per capita income at the zip-code-level was not associated with the probability of testing. However, the results of these tests did show that the percentage of positive COVID-19 cases was higher in lower-income zip codes [26]. The findings from the models presented here that controlled for testing and the model examining the percentage of positive cases suggest that testing explains some of the city-level and town-level differences in MA, but differences still remained.
- Deaths and hospitalizations may also be better measurements of the true burden of COVID-19 in a particular community. Further studies that examine hospitalizations and deaths from COVID-19 according to the social factors examined here will not be as strongly impacted by differences in testing.
- Additionally, these findings do not consider variability within cities and towns. For example, Boston was a city in this analysis, so the data for all the social variables analyzed here were applied across all Boston communities. However, Boston is a large and diverse city, and the values for many of the variables analyzed here are expected to differ in various parts of the city [27]. Performing a similar analysis with more granular data, for example at the level of zip codes or census tracts, could address this limitation. Unfortunately, city and town data are currently the most granular data available from MA.
- Furthermore, the risk of COVID-19 is associated with age. Although differences by age are most pronounced for deaths and hospitalizations, there still is variability in the rate of cases by age [14]. We tested models that controlled for cities and towns’ median age and found that doing so did not account for much of the difference. However, this method did not consider differences in age distributions within cities and towns. A method that could account for these differences would be to calculate age-standardized rates. Unfortunately, age-specific counts of COVID-19 at the city and town level are not yet available for Massachusetts, which precludes performing such an analysis.
- The fact that we had to exclude 12.6% of all cases due to missing data may have introduced bias to these findings. This potential bias would be a particular concern if the relationship between the social variables examined and COVID-19 differed in these cities and towns compared to the cities and towns included in the analysis. Unfortunately, since most of these cities and towns were excluded because they lacked the ACS social variable data, we cannot assess whether this was the case.
- Despite these limitations, action should be taken to both study and address disparities in COVID-19. Efforts should be made to make sure that vulnerable communities have testing and treatment available. At the same time, adequate protections should be provided for essential workers who face the highest risk of contracting COVID-19. This protection includes personal protective equipment, paid sick leave, and worker’s compensation for those who contract the disease in the course of their work. Finally, efforts should be made to confront the social inequities that are being made evident by this current pandemic. Such efforts can help to prevent these communities from bearing a disproportionate share of future waves of COVID-19 and other disease outbreaks.
DISCUSSION
SUPPLEMENTAL MATERIALS
ACKNOWLEDGEMENTS
-
CONFLICT OF INTEREST
The authors have no conflicts of interest associated with the material presented in this paper.
-
FUNDING
None.
-
AUTHOR CONTRIBUTIONS
All work was done by DH.
Notes
Figure. 1.Cases of coronavirus disease 2019 (COVID-19) per 100 000 residents according to social risk score in Massachusetts, May 27, 2020 through June 10, 2020.

Table 1.Cut-off values used to create quartiles for social variables
Table 2.Cases, rate, and rate ratio of coronavirus disease 2019 (COVID-19) in Massachusetts according to social variables, June 10, 2020
Table 3.Percent positive rates and rate ratios of coronavirus disease 2019 (COVID-19) in Massachusetts according to social variables, June 10, 2020
- 1. CDC COVID-19 Response Team. Geographic differences in COVID-19 cases, deaths, and incidence - United States, February 12-April 7, 2020. MMWR Morb Mortal Wkly Rep 2020;69(15):465-471ArticlePubMedPMC
- 2. Garg S, Kim L, Whitaker M, O’Halloran A, Cummings C, Holstein R, et al. Hospitalization rates and characteristics of patients hospitalized with laboratory-confirmed coronavirus disease 2019 - COVID-NET, 14 States, March 1-30, 2020. MMWR Morb Mortal Wkly Rep 2020;69(15):458-464ArticlePubMedPMC
- 3. NYC Health. Age-adjusted rates of lab confirmed COVID-19 nonhospitalized cases, estimated non-fatal hospitalized cases, and patients known to have died 100 000 by race/ethnicity group as of April 16, 2020. [cited 2020 Jun 1]. Available from: https://www1.nyc.gov/assets/doh/downloads/pdf/imm/covid-19-deaths-race-ethnicity-04162020-1.pdf
- 4. Wu Z, McGoogan JM. Characteristics of and important lessons from the coronavirus disease 2019 (COVID-19) outbreak in China: summary of a report of 72 314 cases from the Chinese Center for Disease Control and Prevention. JAMA 2020;323(13):1239-1242ArticlePubMedPDF
- 5. Hawkins D. Differential occupational risk for COVID-19 and other infection exposure according to race and ethnicity. Am J Ind Med 2020. doi: https://doi.org/10.1002/ajim.23145Article
- 6. Tsai J, Wilson M. COVID-19: a potential public health problem for homeless populations. Lancet Public Health 2020;5(4):e186-e187ArticlePubMedPMC
- 7. Baggett TP, Keyes H, Sporn N, Gaeta JM. COVID-19 outbreak at a large homeless shelter in Boston: implications for universal testing. MedRxiv 2020. doi: https://doi.org/10.1101/2020.04.12.20059618Article
- 8. Krieger N, Fee E. Social class: the missing link in U.S. health data. Int J Health Serv 1994;24(1):25-44ArticlePubMed
- 9. Krieger N, Chen JT, Waterman PD, Rehkopf DH, Subramanian SV. Race/ethnicity, gender, and monitoring socioeconomic gradients in health: a comparison of area-based socioeconomic measures--the public health disparities geocoding project. Am J Public Health 2003;93(10):1655-1671ArticlePubMedPMC
- 10. Wadhera RK, Wadhera P, Gaba P, Figueroa JF, Joynt Maddox KE, Yeh RW, et al. Variation in COVID-19 hospitalizations and deaths across New York City boroughs. JAMA 2020;323(21):2192-2195ArticlePubMedPMCPDF
- 11. Chen JT, Krieger N. Revealing the unequal burden of COVID-19 by income, race/ethnicity, and household crowding: US county vs ZIP code analyses. Harvard Center for Population and Development Studies Working Paper Series, Volume 19, Number 1; 2020 Apr 21 [cited 2020 Jun 1]. Available from: https://tinyurl.com/ya44we2r
- 12. Chen JT, Waterman PD, Krieger N. COVID-19 and the unequal surge in mortality rates in Massachusetts, by city/town and ZIP code measures of poverty, household crowding, race/ethnicity, and racialized economic segregation. Harvard Center for Population and Development Studies Working Paper Series, Volume 19, Number 2; 2020 May 9 [cited 2020 Jun 1]. Available from: https://www.hsph.harvard.edu/populationdevelopment/research/working-papers/harvard-pop-centerworking-paper-series/
- 13. UMass Donahue Institute. Massachusetts population estimates program. [cited 2020 Jul 27]. Available from: http://www.donahue.umassp.edu/business-groups/economic-public-policy-research/massachusetts-population-estimates-program/population-projections
- 14. Massachusetts Department of Public Health COVID-19 Dashboard. Dashboard of public health indicators. [cited 2020 Jun 18]. Available from: https://www.mass.gov/doc/covid-19-dashboard-june-18-2020/download
- 15. Holtgrave DR, Crosby RA. Social capital, poverty, and income inequality as predictors of gonorrhoea, syphilis, chlamydia and AIDS case rates in the United States. Sex Transm Infect 2003;79(1):62-64ArticlePubMedPMC
- 16. Barr RG, Diez-Roux AV, Knirsch CA, Pablos-Méndez A. Neighborhood poverty and the resurgence of tuberculosis in New York City, 1984-1992. Am J Public Health 2001;91(9):1487-1493ArticlePubMedPMC
- 17. Gohil SK, Datta R, Cao C, Phelan MJ, Nguyen V, Rowther AA, et al. Impact of hospital population case-mix, including poverty, on hospital all-cause and infection-related 30-day readmission rates. Clin Infect Dis 2015;61(8):1235-1243ArticlePubMedPMCPDF
- 18. Wang J, Zhou M, Liu F. Reasons for healthcare workers becoming infected with novel coronavirus disease 2019 (COVID-19) in China. J Hosp Infect 2020;105(1):100-101ArticlePubMedPMC
- 19. Burke RM, Midgley CM, Dratch A, Fenstersheib M, Haupt T, Holshue M, et al. Active monitoring of persons exposed to patients with confirmed COVID-19 - United States, January-February 2020. MMWR Morb Mortal Wkly Rep 2020;69(9):245-246ArticlePubMedPMC
- 20. Ran L, Chen X, Wang Y, Wu W, Zhang L, Tan X. Risk factors of healthcare workers with corona virus disease 2019: a retrospective cohort study in a designated hospital of Wuhan in China. Clin Infect Dis 2020;ciaa287ArticlePubMedPDF
- 21. Barbieri T, Basso G, Scicchitano S. Italian workers at risk during the COVID-19 epidemic. SSRN 2020. doi: http://dx.doi.org/10.2139/ssrn.3572065Article
- 22. Koh D. Occupational risks for COVID-19 infection. Occup Med (Lond) 2020;70(1):3-5ArticlePubMedPMCPDF
- 23. United States Department of Labor. Unemployment insurance weekly claims data. [cited 2020 May 2]. Available from https://oui.doleta.gov/press/2020/043020.pdf
- 24. Pickett KE, Wilkinson RG. Income inequality and health: a causal review. Soc Sci Med 2015;128: 316-326ArticlePubMed
- 25. Chokshi DA. Income, poverty, and health inequality. JAMA 2018;319(13):1312-1313ArticlePubMed
- 26. Schmitt-Grohe S, Teoh H, Uribe M. COVID-19: testing inequality in New York City. NBER Working Paper No. w27019. [cited 2020 Jun 18]. Available from: https://ssrn.com/abstract=3580577
- 27. Swasey B. ‘Atlas of inequality’ shows income segregation around Boston; 2019 Mar 12 [cited 2020 May 2]. Available from: https://www.wbur.org/bostonomix/2019/03/12/boston-place-inequality-mit-media-lab
REFERENCES
Figure & Data
References
Citations
Citations to this article as recorded by 
- Exploring the Relation between Contextual Social Determinants of Health and COVID-19 Occurrence and Hospitalization
Aokun Chen, Yunpeng Zhao, Yi Zheng, Hui Hu, Xia Hu, Jennifer N. Fishe, William R. Hogan, Elizabeth A. Shenkman, Yi Guo, Jiang Bian
Informatics.2024; 11(1): 4. CrossRef - Perceptions of COVID-19 Risk: How Did People Adapt to the Novel Risk?
Karen Sepucha, Aaron Rudkin, Ryan Baxter-King, Annette L. Stanton, Neil Wenger, Lynn Vavreck, Arash Naeim
Medical Decision Making.2024; 44(2): 163. CrossRef - COVID‐19 mortality among Massachusetts workers and the association with telework ability, 2020
Kathleen Fitzsimmons, Malena Hood, Kathleen Grattan, James Laing, Emily Sparer‐Fine
American Journal of Industrial Medicine.2024; 67(4): 364. CrossRef - The Social, Demographic, and Clinical Predictors of COVID-19 Severity: a Model-based Analysis of United States Veterans
Alyssa R. Greenhouse, Danielle Richard, Anjali Khakharia, Michael Goodman, Lawrence S. Phillips, Julie A. Gazmararian
Journal of Racial and Ethnic Health Disparities.2023;[Epub] CrossRef - Inequities in COVID-19 vaccine and booster coverage across Massachusetts ZIP codes after the emergence of Omicron: A population-based cross-sectional study
Jacob Bor, Sabrina A. Assoumou, Kevin Lane, Yareliz Diaz, Bisola O. Ojikutu, Julia Raifman, Jonathan I. Levy
PLOS Medicine.2023; 20(1): e1004167. CrossRef - Predisposing, Enabling, and Reinforcing Factors of COVID-19 Prevention Behavior in Indonesia: A Mixed-methods Study
Putri Winda Lestari, Lina Agestika, Gusti Kumala Dewi
Journal of Preventive Medicine and Public Health.2023; 56(1): 21. CrossRef - Geographically skewed recruitment and COVID-19 seroprevalence estimates: a cross-sectional serosurveillance study and mathematical modelling analysis
Tyler Brown, Pablo Martinez de Salazar Munoz, Abhishek Bhatia, Bridget Bunda, Ellen K Williams, David Bor, James S Miller, Amir Mohareb, Julia Thierauf, Wenxin Yang, Julian Villalba, Vivek Naranbai, Wilfredo Garcia Beltran, Tyler E Miller, Doug Kress, Kri
BMJ Open.2023; 13(3): e061840. CrossRef - Trajectories of the socioeconomic gradient of mental health: Results from the CLSA COVID-19 Questionnaire Study
Yukiko Asada, Michel Grignon, Jeremiah Hurley, Samuel A. Stewart, Nathan K. Smith, Susan Kirkland, Jacqueline McMillan, Lauren E. Griffith, Christina Wolfson, Parminder Raina
Health Policy.2023; 131: 104758. CrossRef - Major determinant factors of pediatric COVID-19 severity; a single center study
Heba A. Ali
Egyptian Pediatric Association Gazette.2023;[Epub] CrossRef - The price of COVID-19 risk in a public university
Duha T. Altindag, Samuel Cole, R. Alan Seals
Economics of Education Review.2023; 94: 102410. CrossRef - Disparities in Access to Paid Sick Leave During the First Year of the COVID-19 Pandemic
Devan Hawkins
Journal of Occupational & Environmental Medicine.2023; 65(5): 370. CrossRef - Evaluating primary and booster vaccination prioritization strategies for COVID-19 by age and high-contact employment status using data from contact surveys
Ethan Roubenoff, Dennis Feehan, Ayesha S. Mahmud
Epidemics.2023; 43: 100686. CrossRef - Linking Sepsis with chronic arterial hypertension, diabetes mellitus, and socioeconomic factors in the United States: A scoping review
Caitlyn D. Ahlberg, Sara Wallam, Lemya A. Tirba, Stephanie N. Itumba, Linda Gorman, Panagis Galiatsatos
Journal of Critical Care.2023; 77: 154324. CrossRef - Covıd-19 Pandemisinde Hizmete Devam Eden Kargo Sektörü Çalışanlarında İşçi Sağlığı ve İş Güvenliği (İSİG) Algısı ve Tutumları
Alper MERT, Hakan TÜZÜN, Mustafa Necmi İLHAN, Meral SAYGUN
Çalışma ve Toplum.2023; 2(77): 1353. CrossRef - Disparities in COVID-19 Disease Incidence by Income and Vaccination Coverage — 81 Communities, Los Angeles, California, July 2020–September 2021
John M. Masterson, Michael Luu, Kai B. Dallas, Lauren P. Daskivich, Brennan Spiegel, Timothy J. Daskivich
MMWR. Morbidity and Mortality Weekly Report.2023; 72(26): 728. CrossRef - Income inequality and its association with COVID-19 cases and deaths: a cross-country analysis in the Eastern Mediterranean region
Mohammed Fasihul Alam, John Wildman, Hanan Abdul Rahim
BMJ Global Health.2023; 8(11): e012271. CrossRef - Racial, socioeconomic, and neighborhood characteristics in relation to COVID-19 severity of illness for adolescents and young adults
Ayaat Dahleh, Andrew J Bean, Tricia J Johnson, Rebecca Seguin-Fowler
PNAS Nexus.2023;[Epub] CrossRef - Racial Disparity in Potential Occupational Exposure to COVID-19
Abay Asfaw
Journal of Racial and Ethnic Health Disparities.2022; 9(5): 1726. CrossRef - Disparities in telemedicine during COVID‐19
Alexander S. Qian, Melody K. Schiaffino, Vinit Nalawade, Lara Aziz, Fernanda V. Pacheco, Bao Nguyen, Peter Vu, Sandip P. Patel, Maria Elena Martinez, James D. Murphy
Cancer Medicine.2022; 11(4): 1192. CrossRef - Examining Social Vulnerability and the Association With COVID-19 Incidence in Harris County, Texas
Guillermo A. Tortolero, Marcia de Oliveira Otto, Ryan Ramphul, Jose-Miguel Yamal, Alison Rector, Michael Brown, Melissa F. Peskin, Dania Mofleh, Eric Boerwinkle
Frontiers in Public Health.2022;[Epub] CrossRef - Epidemiological determinants of COVID-19 in the police personnel: A cross-sectional study
Rupali Sabale, Gajanan Velhal, Vandana Tripathi, Saurabh Tripathi
Journal of Family Medicine and Primary Care.2022; 11(1): 102. CrossRef - Occupation and Educational Attainment Characteristics Associated With COVID-19 Mortality by Race and Ethnicity in California
Ellicott C. Matthay, Kate A. Duchowny, Alicia R. Riley, Marilyn D. Thomas, Yea-Hung Chen, Kirsten Bibbins-Domingo, M. Maria Glymour
JAMA Network Open.2022; 5(4): e228406. CrossRef - Urban and sub-urban disparities in health outcomes among patients with COVID-19; a cross-sectional study of 234 418 patients in Iran
Mohammad-Reza Sohrabi, Rozhin Amin, Ali Maher, Khatereh Hannani, Hossein Alimohammadi, Ali-Reza Zali
BMC Public Health.2022;[Epub] CrossRef - Projected Impact of Weight Gain During the COVID-19 Pandemic on the Future Burden of Cancer in Canada
Rachel A. Murphy, Jaclyn Parks, Ryan Woods, Darren R. Brenner, Yibing Ruan, Parveen Bhatti
Frontiers in Oncology.2022;[Epub] CrossRef - Socioeconomic status and COVID‐19‐related cases and fatalities in the world: A cross‐sectional ecological study
Ahmad Faramarzi, Javad Javan‐Noughabi, Sayed Ali Mousavi, Farshad Bahrami Asl, Hamidreza Shabanikiya
Health Science Reports.2022;[Epub] CrossRef - Condiciones de vulnerabilidad, sociodemográficas y clínicas de la población diagnosticada con COVID-19 incluida en la estrategia de atención primaria en salud del municipio de Mosquera 2020
Yudy Carolina López Guzmán, Sabrina María Barros Castillo, Michell Ignacio Leal Betancourt, Héctor Fabio Restrepo Guerrero, Martha Patricia Tellez Romero
Revista Repertorio de Medicina y Cirugía.2022;[Epub] CrossRef - Changes in drug poisoning mortality before and after the COVID‐19 pandemic by occupation in Massachusetts
Devan Hawkins, Anh Tuan Phan
American Journal of Industrial Medicine.2022; 65(7): 556. CrossRef - Income differences in COVID-19 incidence and severity in Finland among people with foreign and native background: A population-based cohort study of individuals nested within households
Sanni Saarinen, Heta Moustgaard, Hanna Remes, Riikka Sallinen, Pekka Martikainen, Aaloke Mody
PLOS Medicine.2022; 19(8): e1004038. CrossRef - COVID‐19 in the workplace: Self‐reported source of exposure and availability of personal protective equipment by industry and occupation in Michigan
Zoey Laskaris, Jana L. Hirschtick, Yanmei Xie, Patricia McKane, Nancy L. Fleischer
American Journal of Industrial Medicine.2022; 65(12): 994. CrossRef - Syndemic aspects between COVID-19 pandemic and social inequalities
Jonathan Santos Apolonio, Ronaldo Teixeira da Silva Júnior, Beatriz Rocha Cuzzuol, Glauber Rocha Lima Araújo, Hanna Santos Marques, Isadora de Souza Barcelos, Luana Kauany de Sá Santos, Luciano Hasimoto Malheiro, Vinícius Lima de Souza Gonçalves, Fabrício
World Journal of Methodology.2022; 12(5): 350. CrossRef - Investigating a key structural determinant of health, racism, and related social determinants of health in Massachusetts during the COVID-19 pandemic
Arvis E. Mortimer, Meagan J. Sabatino, Esther Boama-Nyarko, Maira Castañeda-Avila, Melissa Goulding, Clevanne Julce, Stephane Labossiere, Guadalupe Mabry, Asli McCullers, Eileen McNicholas, Ann Moormann, Elizabeth Schieber, Tubanji Walubita, Sarah Forrest
Frontiers in Epidemiology.2022;[Epub] CrossRef - Socioeconomic correlates of face mask use among pedestrians during the COVID-19 pandemic: An ecological study
Zahra Rahimi, Mohammad Javad Mohammadi, Marzieh Araban, Gholam Abbas Shirali, Bahman Cheraghian
Frontiers in Public Health.2022;[Epub] CrossRef - Neighbourhood-level socio-demographic characteristics and risk of COVID-19 incidence and mortality in Ontario, Canada: A population-based study
Trevor van Ingen, Kevin A. Brown, Sarah A. Buchan, Samantha Akingbola, Nick Daneman, Christine M. Warren, Brendan T. Smith, Csaba Varga
PLOS ONE.2022; 17(10): e0276507. CrossRef - Pediatric COVID-19 Health Disparities and Vaccine Equity
Carlos R Oliveira, Kristen A Feemster, Erlinda R Ulloa
Journal of the Pediatric Infectious Diseases Society.2022; 11(Supplement): S141. CrossRef - Los determinantes sociales de la salud y su influencia en la incidencia de la COVID-19. Una revisión narrativa
Alma Antoñanzas Serrano, Luis Andrés Gimeno Feliu
Revista Clínica de Medicina de Familia.2022;[Epub] CrossRef - Severe Acute Respiratory Syndrome Coronavirus 2 Clinical Syndromes and Predictors of Disease Severity in Hospitalized Children and Youth
Danielle M. Fernandes, Carlos R. Oliveira, Sandra Guerguis, Ruth Eisenberg, Jaeun Choi, Mimi Kim, Ashraf Abdelhemid, Rabia Agha, Saranga Agarwal, Judy L. Aschner, Jeffrey R. Avner, Cathleen Ballance, Joshua Bock, Sejal M. Bhavsar, Melissa Campbell, Kathar
The Journal of Pediatrics.2021; 230: 23. CrossRef - COVID‐19 deaths by occupation, Massachusetts, March 1–July 31, 2020
Devan Hawkins, Letitia Davis, David Kriebel
American Journal of Industrial Medicine.2021; 64(4): 238. CrossRef - Mainstreaming of Health Equity in Infectious Disease Control Policy During the COVID-19 Pandemic Era
Hongjo Choi, Seong-Yi Kim, Jung-Woo Kim, Yukyung Park, Myoung-Hee Kim
Journal of Preventive Medicine and Public Health.2021; 54(1): 1. CrossRef - Therapeutic Intervention of COVID-19 by Natural Products: A Population-Specific Survey Directed Approach
Christian Gomez, Ingrid Espinoza, Fazlay Faruque, Md. Mahbub Hasan, Khondaker Rahman, Larry Walker, Ilias Muhammad
Molecules.2021; 26(4): 1191. CrossRef - Understanding the Differences in COVID-19 Case Fatality Rates Observed Across Alabama Counties
Arash Velayati, Devesh Dahale, Arielle Dahlin, Caleb Hamilton, Lloyd P. Provost, Paul Erwin
Journal of Public Health Management and Practice.2021; 27(3): 305. CrossRef - Targeting sedentary behavior as a feasible health strategy during COVID-19
Gabriel Zieff, Lauren C Bates, Zachary Y Kerr, Justin B Moore, Erik D Hanson, Claudio Battaglini, Lee Stoner
Translational Behavioral Medicine.2021; 11(3): 826. CrossRef - Airports, highways and COVID-19: An analysis of spatial dynamics in Brazil
Carlos Dornels Freire de Souza, Michael Ferreira Machado, Adeilton Gonçalves da Silva Junior, Bruno Eduardo Bastos Rolim Nunes, Rodrigo Feliciano do Carmo
Journal of Transport & Health.2021; 21: 101067. CrossRef - SARS-CoV-2 testing in North Carolina: Racial, ethnic, and geographic disparities
Katerina Brandt, Varun Goel, Corinna Keeler, Griffin J. Bell, Allison E. Aiello, Giselle Corbie-Smith, Erica Wilson, Aaron Fleischauer, Michael Emch, Ross M. Boyce
Health & Place.2021; 69: 102576. CrossRef - COVID-19 incidence and mortality in the Metropolitan Region, Chile: Time, space, and structural factors
Pablo Villalobos Dintrans, Claudio Castillo, Felipe de la Fuente, Matilde Maddaleno, Karyn Morrissey
PLOS ONE.2021; 16(5): e0250707. CrossRef - Association Between Income Inequality and County-Level COVID-19 Cases and Deaths in the US
Annabel X. Tan, Jessica A. Hinman, Hoda S. Abdel Magid, Lorene M. Nelson, Michelle C. Odden
JAMA Network Open.2021; 4(5): e218799. CrossRef - Sociodemographic determinants and clinical risk factors associated with COVID-19 severity: a cross-sectional analysis of over 200,000 patients in Tehran, Iran
Mohammad-Reza Sohrabi, Rozhin Amin, Ali Maher, Ayad Bahadorimonfared, Shahriar Janbazi, Khatereh Hannani, Ali-Asghar Kolahi, Ali-Reza Zali
BMC Infectious Diseases.2021;[Epub] CrossRef - Variation in Employment in Healthcare Occupations and County-Level Differences in COVID-19 Cases in the United States of America
Dong Le, Devan Hawkins
Journal of Occupational & Environmental Medicine.2021; 63(7): 629. CrossRef - Association of Lower Socioeconomic Status and SARS-CoV-2 Positivity in Los Angeles, California
Lao-Tzu Allan-Blitz, Cameron Goldbeck, Fred Hertlein, Isaac Turner, Jeffrey D. Klausner
Journal of Preventive Medicine and Public Health.2021; 54(3): 161. CrossRef - Association of Socioeconomic Characteristics With Disparities in COVID-19 Outcomes in Japan
Yuki Yoshikawa, Ichiro Kawachi
JAMA Network Open.2021; 4(7): e2117060. CrossRef - Time-varying associations between COVID-19 case incidence and community-level sociodemographic, occupational, environmental, and mobility risk factors in Massachusetts
Koen F. Tieskens, Prasad Patil, Jonathan I. Levy, Paige Brochu, Kevin J. Lane, M. Patricia Fabian, Fei Carnes, Beth M. Haley, Keith R. Spangler, Jessica H. Leibler
BMC Infectious Diseases.2021;[Epub] CrossRef - Social Determinants of Health Influencing the New Zealand COVID-19 Response and Recovery: A Scoping Review and Causal Loop Diagram
Sudesh Sharma, Mat Walton, Suzanne Manning
Systems.2021; 9(3): 52. CrossRef - Factors associated with the difference between the incidence and case-fatality ratio of coronavirus disease 2019 by country
Jeehyun Kim, Kwan Hong, Sujin Yum, Raquel Elizabeth Gómez Gómez, Jieun Jang, Sun Hee Park, Young June Choe, Sukhyun Ryu, Dae Won Park, Young Seok Lee, Heeyoung Lee, Dong Hyun Kim, Dong-Hyun Kim, Byung Chul Chun
Scientific Reports.2021;[Epub] CrossRef - Factors Associated With SARS-CoV-2 Infection in Bogotá, Colombia: Results From a Large Epidemiological Surveillance Study
Andrea Ramirez Varela, Luis Jorge Hernandez Florez, Guillermo Tamayo-Cabeza, Sandra Contreras-Arrieta, Silvia Restrepo Restrepo, Rachid Laajaj, Giancarlo Buitrago Gutierrez, Yenny Paola Rueda Guevara, Yuldor Caballero-Díaz, Martha Vives Florez, Elkin Osor
The Lancet Regional Health - Americas.2021; 2: 100048. CrossRef - The Effects of Income Level on Susceptibility to COVID-19 and COVID-19 Morbidity/Mortality: A Nationwide Cohort Study in South Korea
So Young Kim, Dae Myoung Yoo, Chanyang Min, Hyo Geun Choi
Journal of Clinical Medicine.2021; 10(20): 4733. CrossRef - Non-medical Interventions to Reduce the Burden of Psychosocial and Economic Impacts of COVID-19 Pandemic: A Scope Review
Sajjad Azmand, Hassan Joulaei, Maryam Fatemi
Shiraz E-Medical Journal.2021;[Epub] CrossRef - The lost productivity cost of absenteeism due to COVID-19 in health care workers in Iran: a case study in the hospitals of Mashhad University of Medical Sciences
Ahmad Faramarzi, Javad Javan-Noughabi, Seyed Saeed Tabatabaee, Ali Asghar Najafpoor, Aziz Rezapour
BMC Health Services Research.2021;[Epub] CrossRef - A systematic review of racial/ethnic and socioeconomic disparities in COVID-19
Ahmad Khanijahani, Shabnam Iezadi, Kamal Gholipour, Saber Azami-Aghdash, Deniz Naghibi
International Journal for Equity in Health.2021;[Epub] CrossRef - The influence of sex, gender, age, and ethnicity on psychosocial factors and substance use throughout phases of the COVID-19 pandemic
Lori A. Brotto, Kyle Chankasingh, Alexandra Baaske, Arianne Albert, Amy Booth, Angela Kaida, Laurie W. Smith, Sarai Racey, Anna Gottschlich, Melanie C. M. Murray, Manish Sadarangani, Gina S. Ogilvie, Liisa Galea, Kimberly Page
PLOS ONE.2021; 16(11): e0259676. CrossRef - Differences in COVID-19 Risk by Race and County-Level Social Determinants of Health among Veterans
Hoda S. Abdel Magid, Jacqueline M. Ferguson, Raymond Van Cleve, Amanda L. Purnell, Thomas F. Osborne
International Journal of Environmental Research and Public Health.2021; 18(24): 13140. CrossRef - Social determinants of health and COVID-19 infection in Brazil: an analysis of the pandemic
Alexandre Medeiros de Figueiredo, Daniela Cristina Moreira Marculino de Figueiredo, Luciano Bezerra Gomes, Adriano Massuda, Eugenia Gil-García, Rodrigo Pinheiro de Toledo Vianna, Antonio Daponte
Revista Brasileira de Enfermagem.2020;[Epub] CrossRef - Call for Action to Address Equity and Justice Divide During COVID-19
Sonu Bhaskar, Aarushi Rastogi, Koravangattu Valsraj Menon, Beena Kunheri, Sindhu Balakrishnan, Jeremy Howick
Frontiers in Psychiatry.2020;[Epub] CrossRef - Massachusetts general hospital Covid-19 registry reveals two distinct populations of hospitalized patients by race and ethnicity
Ingrid V. Bassett, Virginia A. Triant, Bridget A. Bunda, Caitlin A. Selvaggi, Daniel J. Shinnick, Wei He, Frances Lu, Bianca C. Porneala, Tingyi Cao, Steven A. Lubitz, James B. Meigs, John Hsu, Andrea S. Foulkes, Marlene Camacho-Rivera
PLOS ONE.2020; 15(12): e0244270. CrossRef
 PubReader
 ePub Link
 Cite
Cite