
Articles
- Page Path
- HOME > J Prev Med Public Health > Volume 44(4); 2011 > Article
-
Original Article
Intraocular Pressure and Its Determinants in Subjects With Type 2 Diabetes Mellitus in India - Sayantan Biswas1, Rajiv Raman2, Vaitheeswaran Koluthungan3, Tarun Sharma2
-
Journal of Preventive Medicine and Public Health 2011;44(4):157-166.
DOI: https://doi.org/10.3961/jpmph.2011.44.4.157
Published online: July 29, 2010
1Elite School of Optometry, Sankara Nethralaya, Chennai, Tamil Nadu, India.
2Shri Bhagwan Mahavir Department of Vitreoretinal Services, Sankara Nethralaya, Chennai, Tamil Nadu, India.
3Department of Preventive Ophthalmology (Epidemiology and Biostatistics), Sankara Nethralaya, Chennai, Tamil Nadu, India.
- Corresponding author: Tarun Sharma, MD, FRCSEd, MBA. Shri Bhagwan Mahavir Vitreoretinal Services, Sankara Nethralaya, 18, College Road, Chennai, 600 006, Tamil Nadu, India. Tel: +914428271616, Fax: +914428254180 drtaruns@gmail.com
Copyright © 2011 The Korean Society for Preventive Medicine
This is an Open Access article distributed under the terms of the Creative Commons Attribution Non-Commercial License (http://creativecommons.org/licenses/by-nc/3.0/) which permits unrestricted non-commercial use, distribution, and reproduction in any medium, provided the original work is properly cited.
ABSTRACT
-
Objectives
- This study was conducted to show the intraocular pressure (IOP) distribution and the factors affecting IOP in subjects with type 2 diabetes mellitus (DM) in India.
-
Methods
- We measured the anthropometric and biochemical parameters for confirmed type 2 DM patients. A comprehensive ocular examination was performed for 1377 subjects aged > 40 years and residing in Chennai.
-
Results
- A significant difference in IOP (mean ± standard deviation) was found between men and women (14.6±2.9 and 15.0±2.8 mmHg, p = 0.005). A significantly elevated IOP was observed among smokers, subjects with systemic hypertension and women with clinically significant macular edema (CSME). After a univariate analysis, factors associated significantly with higher IOP were elevated systolic blood pressure, elevated resting pulse rate and thicker central corneal thickness (CCT). In women, elevated glycosylated hemoglobin was associated with a higher IOP. After adjusting for all variables, the elevated resting pulse rate and CCT were found to be associated with a higher IOP.
-
Conclusions
- Systemic hypertension, smoking, pulse rate and CCT were associated with elevated intraocular pressure in type 2 DM. Women with type 2 DM, especially those with CSME, were more prone to have an elevated IOP.
- The range of intraocular pressure (IOP), among the general population, varies from 8-22 mmHg [1]. This variation can be explained by the numerous factors affecting IOP. Previous studies have shown that the factors associated with elevated IOP include smoking [2], older age [3], gender [2,3], blood pressure [2-4] family history of glaucoma [2,3], pulse rate [2,3], diabetes (elevated glycosylated hemoglobin) [2,3], myopia [5], alcohol usage [2], race (African) [4], nuclear sclerosis [3,5], body mass index (BMI) [2-4] and iris color [5].
- Subjects with type 2 diabetes mellitus (DM) have an increased risk of developing open angle glaucoma [6]. It is important to study the distribution and effect of the factors affecting IOP among subjects with DM in India, as there are few population-based studies regarding the same [7]. Based on the procedure used and the population chosen, the distribution of intraocular pressure among type 2 DM varied from 14.86 to 21.5 mmHg [2,3,7-18].
- However, these studies did not have standardized procedures like goldmann applanation tonometer (GAT) and fundus photography based standardized retinopathy grading. The aim of this study is to describe the IOP distribution and the factors affecting IOP in subjects with type 2 DM. It also elucidates the gender-specific influence of these factors on the IOP.
INTRODUCTION
- Sankara Nethralaya - Diabetic Retinopathy Epidemiology and Molecular Genetic Study (SN-DREAMS 1) is a population-based, cross-sectional, study to estimate the prevalence and risk factors of diabetes and diabetic retinopathy in the South-Indian population. The detail methodology and study design of SN-DREAMS 1 is given elsewhere [19].
- The study population was selected by multistage, systematic random sampling based on the socio-economic status, which made the sample a true representation of subjects with type 2 DM in India. Out of the 5999 individuals, aged ≥40 , enumerated from the general population, 1816 subjects had diabetes (known 1349 and provisional 469); 1563 (86.1%) subjects came for further evaluation at the base hospital and of these, 138 subjects with no diabetes and 11 subjects with ungradable retinal photographs were excluded. Apart from this, 30 subjects having IOP ≥ 22 mmHg, three glaucoma suspects and four subjects under anti-glaucoma medication (one of them being ocular hypertensive) were excluded from the study. Finally, we had 1377 subjects for this study. Known diabetics and provisional diabetics were selected in accordance with the ADA criterion [20]. Known diabetes is when diabetes is diagnosed by a medical practitioner, or the patient uses hypoglycemic medication, either oral or insulin or both and provisional diabetes is when the condition is diagnosed in a new asymptomatic individual with a first fasting blood glucose level ≥110 mg/dL (Accutrend alpha). The right eye was chosen for analysis, alternatively the eye without any history of ocular surgery was selected for analysis.
- The study was approved by the Institutional Review Board and a written informed consent was obtained from the subjects as per the Helsinki Declaration. Subjects with provisional diabetes were confirmed to be having diabetes by re-estimating fasting blood glucose by enzymatic assay based glucose oxidation method (Accutrend alpha) [20]. The biochemical analyses done using the Merck Micro Lab 120, semi automated analyzer included total serum cholesterol (CHOD-POD method), high-density lipoproteins (after protein precipitation CHOD-POD method), serum triglycerides (CHOD-POD), hemoglobin (calorimetric hemoglobinometer), packed cell volume (capillary method) and the glycosylated hemoglobin fraction (Bio-Rad DiaSTAT HbA1c Reagent Kit).
- Anthropometric measurements, including weight, height, waist and hip, were obtained using standardized techniques. The blood pressure was recorded, in the sitting position, in the right arm, to the nearest 2 mmHg using the mercury sphygmomanometer (Diamond Deluxe BP apparatus, Pune, India). Two readings were taken, five minutes apart, and their mean, was taken as the blood pressure. Microalbuminuria was estimated using the first morning urine sample, by a semiquantitative procedure (Clintek 50 Bayer Urine Analyzer) in which the subjects were considered to have microalbuminuria, if the albumin creatinine ratio (ACR) was between 30 and 299 mg/g [21]. Diabetic neuropathy was assessed by measuring the vibration perception threshold (VPT) using a sensitometer by a single observer with a biothesiometer probe placed perpendicular to the distal plantar surface of the great toe in both legs. The mean VPT measure of the three readings of both legs was considered for the analysis. The presence of diabetic neuropathy was considered if the VPT value was >20 V [22].
- After the initial phases of sampling, diabetes confirmation, biochemical and anthropometric examination, a comprehensive ophthalmic examination was conducted at a dedicated facility created in the base hospital in a pre-determined specific order - starting from the subject's medical and ophthalmic condition to recording the presenting and the best-corrected distance visual acuity using the modified ETDRS chart (Light House Low Vision Products, New York, NY, USA). For those who could not read the English alphabet, the Landolt's ring was shown. The pinhole visual acuity was assessed for those having visual acuity less than 4/4 (LogMAR 0.0). An objective refraction was performed with a streak retinoscope (Beta 200, Heine, Germany) and was followed by subjective refraction. The corneal endothelial status was assessed with the corneal specular microspcopy, the corneal thickness was measured using the Corneal Pachymeter (Alcon ultrasound pachymeter) after which the slit lamp examination was performed (Zeiss SL 130). The peripheral anterior chamber depth was assessed as per the van Herick grading [23] and the iris was examined for neovascularization. The IOP in both the eyes were measured using Goldmann applanation tonometer (Zeiss AT 030 Applanation Tonometer, Carl Zeiss, Jena, Germany), using 0.05% proparacaine eyedrops as topical anaesthesia and 2% fluorescein to stain the tear film [24]. The IOP in the right eye was measured first and taken for analysis (Intra correlation coefficient 0.84 between the eyes), with only one reliable measurement recorded for each. The instrument was calibrated on the first working day of every week. After dilating the pupils with 5% phenylephrine and 1% tropicamide eyedrops (if phenylephrine is contraindicated, 1% cyclopentolate eyedrops used), lens opacities were graded using the Lens Opacities Classification System (LOCS chart III, Leo T. Chylack, Harvard Medical School, Boston, MA), retro illuminated with a light box. Fundus photographs were taken using the 45° four-field stereoscopic digital photography Carl Zeiss fundus camera (Visucamlite, Jena, Germany). Diabetic retinopathy was diagnosed based on the modified Klein classification (Modified Early Treatment Diabetic Retinopathy Study scales) [25]. The diabetic retinopathy grading was done by two independent observers in a masked fashion and the grading agreement of both were high (k=0.83).
- Glycemic control was categorized as normal (glycosylated hemoglobin [HbA1c] < 5.6), good (HbA1c 5.6-7.0), fair (HbA1c 7.1-8.0) and poor (HbA1c ≥ 8.1) [20]. The fasting plasma glucose was considered to be high if the value was >126 mg/dL [26]. The height and weight of all subjects were noted, after which the body mass index (BMI) was calculated using the formula: weight (kg)/height (m2) [27]. Based on the BMI, individuals were classified as lean (male, <20; female, <19), normal (male, 20-25; female, 19-24), overweight (male, 25-30; female, 24-29) or obese (male, >30; female, >29) [28]. The mean Indian height and weight (Indian Council of Medical Research, 1990), axial length [27], CCT [29], pulse beat [30] was taken for general characteristics, whereas, total cholesterol, high and low density cholesterol, triglycerides levels were taken from a previous study [31].
- Along with the age and gender-specific mean IOP (± standard deviation [SD]), the mean IOP (± SD), based on the stratification of each categorical predictor, was also calculated. Analysis of variance (ANOVA) was used to compare the demographic, anthropometric, biochemical factors with the IOP. Beta values were calculated for the continuous variables. Both unadjusted and adjusted regression analysis was performed for the variables. All analysis was done using SPSS version 15.0 (SPSS Inc., Chicago, IL). A p value of ≤0.05 was considered significant.
METHODS
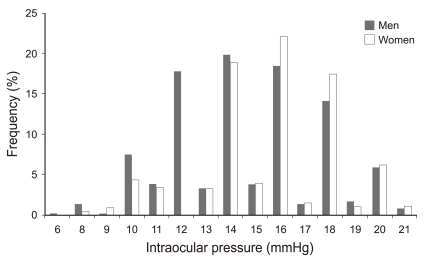
- Figure 1 shows the normal distribution of intraocular pressure among subjects with type 2 diabetes. The mean IOP was 14.8±2.9 mmHg (men 14.6±2.9 and women 15.0±2.8 mmHg, p=0.005). There was no significant difference between the mean IOP in the right and left eye (p=0.185). Table 1 shows the IOP distribution in various sub-groups. Subjects with hypertension and a raised systolic blood pressure (SBP) had a higher IOP than those without (14.9±2.9 vs 14.6±2.9 mmHg, p=0.03 and 14.9±2.9 vs 14.4±2.9 mmHg, p=0.001 respectively). Those with diabetic neuropathy had a lower IOP than those without (14.4±2.9 vs 14.9±2.8 mmHg, p=0.008). Among women subjects, those with clinically significant macular edema (CSME) had a higher IOP than those without CSME (17.4±2.2 vs 15.0±2.8 mmHg, p=0.02). Smokers had a higher IOP than non-smokers (14.9±2.9 vs 14.3±2.9, p=0.001) whereas, alcoholics had a lower IOP than non-alcoholics (14.4±2.9 vs 14.9±2.9, p=0.002). Short stature, high central cormeal thickness (CCT) and raised pulse beat were significantly associated with a higher IOP, whereas, longer axial length was significantly associated with a higher IOP only in men subjects. Table 2 describes the correlation of the continuous variables with the intraocular pressure. height, SBP, pulse, CCT and serum total cholesterol were the variables found to be significantly associated with intraocular pressure. Pulse (men: r=0.076, p=0.021 and women r=0.058, p=0.011) and CCT (men: r=0.12, p=0.001 and women r=0.182, p<0.001) were the variables associated with an elevated IOP in men and women.
- Table 3 shows the gender-specific unadjusted analysis for continuous variables associated with IOP in subjects with type 2 diabetes. Factors associated with an elevated IOP included elevated systolic blood pressure (β=0.008, p=0.024), elevated resting pulse rate (β=0.019, p=0.006) and thicker central corneal thickness (β=0.011, p<0.001). Height was associated with a decrease in the IOP (β=-0.024, p=0.008). In men, the factors associated with an elevated IOP included higher resting pulse rate (β=0.021, p=0.04), thicker CCT (β=0.01, p=0.001) and systolic blood pressure (β=0.011, p=0.04); in women, elevated glycosylated hemoglobin (β=0.1, p=0.04) and CCT (β=0.015, p<0.001) were significant factors.
- After adjusting the continuous variables associated with IOP in subjects with type 2 diabetes, the factors associated with elevated IOP are included in Table 4 as thicker central corneal thickness (β=0.011, p<0.001) and elevated resting pulse rate (β=0.001, p=0.03); height was associated with a decrease in the IOP (β=-0.028, p=0.008). A thicker central corneal thickness was the single variable associated with an elevated IOP in men and women (men: β=0.01, p=0.002 and women β=0.015, p<0.001).
RESULTS
- The supplementary Table shows the comparison of the mean IOP in published population-based reports among type 2 diabetes. The mean IOP among diabetics in our study was lower than other studies [2,8,9]. When compared to other races, the IOP in the Asian ethnicity is lower [7,10]. The Barbados Eye Study and the Los Angeles Latino Eye Study, like our study, has also found a higher IOP among women with diabetes [2,11]. However, Kawase et al. [32] did not find any gender difference in IOP. We assume that the increased IOP among women with elevated glycosylated hemoglobin in our study is related to accumulation of fibronectin in trabecular meshwork [12]. Higher prevalence of obesity, hypertension and probably a higher life expectancy can best explain higher IOP among women [11]. Similar to our study, many other studies have reported a higher prevalence of elevated IOP among subjects with hypertension [2-4,11]. Although, the rationale for this is poorly understood, possible reasons could be increased aqueous humor production by ultrafiltration due to the elevated ciliary artery pressure, a generalized increase in the sympathetic tone or elevated serum corticosteroid levels as seen in hypertension subjects [4].
- We found a higher IOP among women with CSME. The reason for this is unknown. But, this can probably be explained by a complex interplay between the change in retinal hemodynamics, ocular perfusion, scleral rigidity and hormonal influence among women [33].
- We found an inverse relationship between the presence of diabetic neuropathy and IOP. al-Sereiti et al. [13] reported normal IOP among patients with diabetes having autonomic neuropathy. However, one study has shown that autonomic denervation may be a prerequisite of peripheral diabetic neuropathy [34]. It has been postulated that in autonomic neuropathy, the pupil/iris diameter is reduced, which increases the aqueous drainage, reducing the IOP [13].
- Similar to previous studies, alcohol has been shown to lower the IOP, possibly through a reduction of net water movement into the eye [35], whereas, smoking was found to increase the IOP, hypothesized to be due to smoking induced degenerative changes in the arteries and increase in blood viscosity [36].
- Wu et al. [3] found a positive association between pulse rate and IOP, similar to our study. Even on multivariate analysis after adjusting for variables like age, gender, duration of diabetes, BMI and glycemic control, the association between the resting pulse rate and the IOP remained the same.
- Like earlier study [37], the present study also found a negative relationship between height and IOP. However, one study by Bulpitt et al. [4] found no relationship between the two. The height of an individual is related to genetic and acquired factors like status of growth hormone and childhood nutrition [38] which may probably affect the IOP. BMI and IOP being directly proportional, and height being inversely proportional to BMI [19], we can expect a similar inverse relationship between height and IOP.
- Earlier study has reported a similar relationship between CCT and IOP among subjects with diabetes [11]. However, as diabetes affects corneal biomechanics, this results in lower corneal hysteresis values than those in healthy control subjects [39]. This may cause clinically relevant high IOP measurements independent of CCT. Also, the GAT gives an accurate intraocular pressure reading for an eye with average CCT, but tends to underestimate or overestimate the true intraocular pressure for thinner and thicker cornea, respectively [11]. Our study confirmed this correlation between increasing IOP and increasing CCT as measured by GAT.
- The strength of this study was that it used photography and standard grading techniques. Further, the study was representative of a large population, and the results could be extrapolated to the whole of urban India. One of the limitations of this study was the absence of non-diabetic subjects, including them may have elicited a better relationship between IOP and subjects with DM. Also, in subjects with known DM, a second estimation of blood glucose was not performed; the diagnostic accuracy of the treating diabetologists was relied upon totally. The sample size for this study was calculated for the estimation of the prevalence of diabetic retinopathy in the general population; the power to elucidate associated risk factors in the subgroup analysis may be inadequate. This study does not have any data on progression, as no follow-up is envisaged. These data stress on the need for regular ocular examinations in subjects with type 2 DM in countries like India, especially for smokers and when associated with systemic hypertension. Even the IOP distribution in subjects with type 2 diabetes is gender specific. In conclusion, identifying the risk factors for high IOP in this population will prevent blindness in this vulnerable population.
DISCUSSION
-
The authors have no conflicts of interest with the material presented in this paper.
-
This article is available at http://jpmph.org/.
Notes
- 1. Vijaya L, George R, Baskaran M, Arvind H, Raju P, Ramesh SV, et al. Prevalence of primary open-angle glaucoma in an urban south Indian population and comparison with a rural population. The Chennai Glaucoma Study. Ophthalmology 2008;115(4):648-654. 17664010ArticlePubMed
- 2. Wu SY, Leske MC. Associations with intraocular pressure in the Barbados Eye Study. Arch Ophthalmol 1997;115(12):1572-1576. 9400792ArticlePubMed
- 3. Klein BE, Klein R, Linton KL. The Beaver Dam Eye Study. Intraocular pressure in an American community. Invest Ophthalmol Vis Sci 1992;33(7):2224-2228. 1607232PubMed
- 4. Bulpitt CJ, Hodes C, Everitt MG. Intraocular pressure and systemic blood pressure in the elderly. Br J Ophthalmol 1975;59(12):717-720. 1218183ArticlePubMedPMC
- 5. Weih LM, Mukesh BN, McCarty CA, Taylor HR. Association of demographic, familial, medical, and ocular factors with intraocular pressure. Arch Ophthalmol 2001;119(6):875-880. 11405839ArticlePubMed
- 6. Chopra V, Varma R, Francis BA, Wu J, Torres M, Azen SP, et al. Type 2 diabetes mellitus and the risk of open-angle glaucoma the Los Angeles Latino Eye Study. Ophthalmology 2008;115(2):227-232. 17716734ArticlePubMed
- 7. Arora VK, Prasad VN. The intraocular pressure and diabetes-a correlative study. Indian J Ophthalmol 1989;37(1):10-12. 2807492PubMed
- 8. Nemesure B, Wu SY, Hennis A, Leske MC. Barbados Eye Studies Group. Factors related to the 4-year risk of high intraocular pressure: the Barbados Eye Studies. Arch Ophthalmol 2003;121(6):856-862. 12796259ArticlePubMed
- 9. Tielsch JM, Katz J, Quigley HA, Javitt JC, Sommer A. Diabetes, intraocular pressure, and primary open-angle glaucoma in the Baltimore Eye Survey. Ophthalmology 1995;102(1):48-53. 7831041ArticlePubMed
- 10. Xu L, Xie XW, Wang YX, Jonas JB. The Beijing Eye Study. Ocular and systemic factors associated with diabetes mellitus in the adult population in rural and urban China. Eye (Lond) 2009;23(3):676-682. 18259206ArticlePubMed
- 11. Memarzadeh F, Ying-Lai M, Azen SP, Varma R. Los Angeles Latino Eye Study Group. Associations with intraocular pressure in Latinos: the Los Angeles Latino Eye Study. Am J Ophthalmol 2008;146(1):69-76. 18486096ArticlePubMedPMC
- 12. Oshitari T, Fujimoto N, Hanawa K, Adachi-Usami E, Roy S. Effect of chronic hyperglycemia on intraocular pressure in patients with diabetes. Am J Ophthalmol 2007;143(2):363-365. 17258539ArticlePubMed
- 13. al-Sereiti MR, Turner P, Gale EA. Intraocular pressure and pupillary responses in patients with diabetes mellitus. Postgrad Med J 1991;67(785):250-251. 2062771ArticlePubMedPMC
- 14. Bankes JL. Ocular tension and diabetes mellitus. Br J Ophthalmol 1967;51(8):557-561. 6035958ArticlePubMedPMC
- 15. Bouzas AG, Gragoudas ES, Balodimos MC, Brinegar CH, Aiello LM. Intraocular pressure in diabetes. Relationship to retinopathy and blood glucose level. Arch Ophthalmol 1971;85(4):423-427. 5554870ArticlePubMed
- 16. Williams BI, Peart WS, Letley E. Abnormal intraocular pressure control in systemic hypertension and diabetic mellitus. Br J Ophthalmol 1980;64(11):845-851. 7426555ArticlePubMedPMC
- 17. Klein BE, Klein R, Moss SE. Intraocular pressure in diabetic persons. Ophthalmology 1984;91(11):1356-1360. 6514302ArticlePubMed
- 18. Dielemans I, de Jong PT, Stolk R, Vingerling JR, Grobbee DE, Hofman A. The Rotterdam Study. Primary open-angle glaucoma, intraocular pressure, and diabetes mellitus in the general elderly population. Ophthalmology 1996;103(8):1271-1275. 8764798ArticlePubMed
- 19. Agarwal S, Raman R, Paul PG, Rani PK, Uthra S, Gayathree R, et al. Sankara Nethralaya-Diabetic Retinopathy Epidemiology and Molecular Genetic Study (SN-DREAMS 1): study design and research methodology. Ophthalmic Epidemiol 2005;12(2):143-153. 16019696ArticlePubMed
- 20. Expert Committee on the Diagnosis and Classification of Diabetes Melitus. Report of the expert committee on the diagnosis and classification of diabetes mellitus. Diabetes Care 2003;26(Suppl 1):S5-S20. 12502614ArticlePubMedPDF
- 21. Molitch ME, DeFronzo RA, Franz MJ, Keane WF, Mogensen CE, Parving HH, et al. Nephropathy in diabetes. Diabetes Care 2004;27(Suppl 1):S79-S83. 14693934ArticlePubMedPDF
- 22. Pradeepa R, Rema M, Vignesh J, Deepa M, Deepa R, Mohan V. Prevalence and risk factors for diabetic neuropathy in an urban south Indian population: the Chennai Urban Rural Epidemiology Study (CURES-55). Diabet Med 2008;25(4):407-412. 18294224ArticlePubMed
- 23. Palmberg P. In: Ritch R, Shields MB, Krupin T, editors. Gonioscopy. The glaucomas, vol. I. 1996. 4th ed. St. Louis: Mosby; p. 455-470
- 24. Kass MA. Standardizing the measurement of intraocular pressure for clinical research. Guidelines from the Eye Care Technology Forum. Ophthalmology 1996;103(1):183-185. 8628552ArticlePubMed
- 25. Klein R, Klein BE, Magli YL, Brothers RJ, Meuer SM, Moss SE, et al. An alternative method of grading diabetic retinopathy. Ophthalmology 1986;93(9):1183-1187. 3101021ArticlePubMed
- 26. American Diabetes Association. Tests of glycemia in diabetes. Diabetes Care 2000;23(suppl 1):S80-S82. 12017687ArticlePubMedPDF
- 27. Nangia V, Jonas JB, Sinha A, Matin A, Kulkarni M, Panda-Jonas S. Ocular axial length and its associations in an adult population of central rural India: the Central India Eye and Medical Study. Ophthalmology 2010;117(7):1360-1366. 20363029ArticlePubMed
- 28. Mohan V, Vijayaprabha R, Rema M, Premalatha G, Poongothai S, Deepa R, et al. Clinical profile of lean NIDDM in South India. Diabetes Res Clin Pract 1997;38(2):101-108. 9483373ArticlePubMed
- 29. Vijaya L, George R, Arvind H, Ve Ramesh S, Baskaran M, Raju P, et al. Central corneal thickness in adult South Indians: the Chennai Glaucoma Study. Ophthalmology 2010;117(4):700-704. 20079536ArticlePubMed
- 31. Fauci AS. Harrison's principles of internal medicine. 2008. 17th ed. New York: McGRaw-Hill; p. 1335
- 31. Menon VU, Guruprasad U, Sundaram KR, Jayakumar RV, Nair V, Kumar H. Glycaemic status and prevalence of comorbid conditions among people with diabetes in Kerala. Natl Med J India 2008;21(3):112-115. 19004140PubMed
- 32. Kawase K, Tomidokoro A, Araie M, Iwase A, Yamamoto T, et al. Tajimi Study Group. Ocular and systemic factors related to intraocular pressure in Japanese adults: the Tajimi study. Br J Ophthalmol 2008;92(9):1175-1179. 18669541ArticlePubMed
- 33. Ciulla TA, Harris A, Latkany P, Piper HC, Arend O, Garzozi H, et al. Ocular perfusion abnormalities in diabetes. Acta Ophthalmol Scand 2002;80(5):468-477. 12390156ArticlePubMed
- 34. Ryder RE, Kennedy RL, Newrick PG, Wilson RM, Ward JD, Hardisty CA. Autonomic denervation may be a prerequisite of diabetic neuropathic foot ulceration. Diabet Med 1990;7(8):726-730. 2147635ArticlePubMed
- 35. Harris A, Swartz D, Engen D, Beck D, Evans D, Caldemeyer K, et al. Ocular hemodynamic effects of acute ethanol ingestion. Ophthalmic Res 1996;28(3):193-200. 8829177ArticlePubMed
- 36. Lee AJ, Rochtchina E, Wang JJ, Healey PR, Mitchell P. Does smoking affect intraocular pressure? Findings from the Blue Mountains Eye Study. J Glaucoma 2003;12(3):209-212. 12782837ArticlePubMed
- 37. Carel RS, Korczyn AD, Rock M, Goya I. Association between ocular pressure and certain health parameters. Ophthalmology 1984;91(4):311-314. 6717917ArticlePubMed
- 38. Hellgren G, Andersson B, Nierop AF, Dahlgren J, Hochberg Z, Albertsson-Wikland K. A proteomic approach identified growth hormone-dependent nutrition markers in children with idiopathic short stature. Proteome Sci 2008;6: 35. 19077222ArticlePubMedPMC
- 39. Sahin A, Bayer A, Ozge G, Mumcuğlu T. Corneal biomechanical changes in diabetes mellitus and their influence on intraocular pressure measurements. Invest Ophthalmol Vis Sci 2009;50(10):4597-4604. 19443722ArticlePubMed
REFERENCES
- Comparison of mean IOP in published population-based reports among type 2 diabetes
Appendix
Appendix.
| Study name | Country | Publication year | Ethnicity | Gender | Age range (y) | Age (mean SD) (y) | Sample (n) | IOP measurement technique | IOP (mean SD) (mmHg) |
|---|---|---|---|---|---|---|---|---|---|
| Bankes JL [14] | England | 1967 | Mixed | Both | ≥40 | NA | 212 | GAT | 16.69 ± 3.32 |
| Bouzas AG, et al [15] | New England | 1971 | Mixed | Both | 51 - 68 | NA | 56 | GAT | 15.19 ± 3.15 |
| Williams B, et al [16] | England | 1980 | Mixed | Both | 25 - 70 | 53.36±13.3 | 14 | Perkins handheld | 18.9 ± 2.25 |
| Wisconsin epidemiologic study [17] | USA | 1984 | Mixed | Both | 0 to >75 | NA | 2990 | GAT | 16.3 ± 4.12 |
| Arora VK, et al [7] | India | 1989 | Asian | Males | NA | NA | 46 | Schiotz | 19.26 |
| al-Sereiti MR, et al [13] | England | 1991 | Mixed | Both | NA | .0040±15 | 38 | Non-contact Pneumotonometer | 15.5±3.9 |
| Beaver dam eye study [3] | USA | 1992 | Mixed | Both | 43 - 84 | NA | 438 | GAT | 16.05 ± 3.8 |
| Baltimore eye survey [9] | USA | 1995 | Mixed | Both | ≥40 | NA | 714 | GAT | 17.9 ± 0.24 |
| Rotterdam study [18] | Netherland | 1996 | White | Both | ≥ 55 | 55 - 94 | 256 | GAT | 14.86 ± 2.91 |
| Barbados eye study [2] | West Indies | 1997 | Mixed | Both | 40 - 84 | 58 | 17 | GAT | 18.6 ± 3.7 |
| Barbados incidence study of eye diseases [8] | West Indies | 2003 | Mixed | Both | 40 - 84 | 057.5 ± 11.5 | 559 | GAT | 21.5 ± 4.7 |
| Oshitari T [12] | Japan | 2007 | Japanese | Both | NA | 60.86 ± 10.76 | 190 | GAT | 16.0 ± 2.5 |
| Los Angeles Latino eye study [11] | USA | 2008 | Mexicans | Both | ≥ 40 | NA | 1416 | GAT | 15.2 ± 3.3 |
| Beijing eye study [10] | China | 2009 | Chinese | Both | 45 - 89 | 060.4 ± 10 | 381 | Non-contact Pneumotonometer | 16.14 ± 2.96 |
| Present study | India | 2010 | Asian | Both | ≥ 40 | 56.32 ± 10.02 | 1414 | GAT | 14.8 ± 2.9 |
STDR: sight threatening diabetic retinopathy (severe Nonproliferative diabetic retinopathy, proliferative diabetic retinopathy and clinically significant macular edema), CSME: clinically significant macular edema, HbA1c: glycosylated hemoglobin, BP: blood pressure, CCT: central corneal thickness, BMI: body mass index, FBS: fasting blood sugar.
CCT: central corneal thickness, CI: confidence interval, SN-DREAMS 1: Sankara Nethralaya-diabetic Retinopathy Epidemiology and Molecular Genetic Study.
The variables adjusted in multiple regression analysis are age, duration of diabetes, weight, height, systolic and diastolic blood pressure, pulse, central corneal thickness, axial length, total serum cholesterol, serum high density lipoproteins, serum triglycerides, glycosylated hemoglobin and fasting blood sugar.
Figure & Data
References
Citations
- Cyclodiode vs micropulse transscleral laser treatment
Monica Kelada, Eduardo M. Normando, Francesca M. Cordeiro, Laura Crawley, Faisal Ahmed, Sally Ameen, Niten Vig, Philip Bloom
Eye.2024;[Epub] CrossRef - Neuroinflammation and neovascularization in diabetic eye diseases (DEDs): identification of potential pharmacotherapeutic targets
Siva Prasad Panda, P Hemachandra Reddy, Uma Sankar Gorla, DSNBK Prasanth
Molecular Biology Reports.2023; 50(2): 1857. CrossRef - Image-based insilico investigation of hemodynamics and biomechanics in healthy and diabetic human retinas
Kartika Chandra Tripathy, Ashish Siddharth, Ajay Bhandari
Microvascular Research.2023; 150: 104594. CrossRef - Retinal Nerve Fiber Layer Loss Is Associated with Urinary Albumin Excretion in Patients with Type 2 Diabetes
Jin A. Choi, Sun-Hee Ko, Yi Ryeung Park, Dong-Hyun Jee, Seung-Hyun Ko, Chan Kee Park
Ophthalmology.2015; 122(5): 976. CrossRef - The distribution of intraocular pressure and associated systemic factors in a Korean population: The Korea National Health and Nutrition Examination Survey
Mi Jeung Kim, Ki Ho Park, Chan Yun Kim, Jin Wook Jeoung, Seok Hwan Kim
Acta Ophthalmologica.2014;[Epub] CrossRef - Association between Urinary Albumin Excretion and Intraocular Pressure in Type 2 Diabetic Patients without Renal Impairment
Jin A. Choi, Kyungdo Han, Hyuk-Sang Kwon, Ariela Benigni, PhD.
PLoS ONE.2014; 9(5): e96335. CrossRef
 PubReader
 ePub Link
 Cite
Cite

