
Articles
- Page Path
- HOME > J Prev Med Public Health > Volume 45(1); 2012 > Article
-
Original Article
Trend of Mortality Rate and Injury Burden of Transport Accidents, Suicides, and Falls - Ki Sook Kim1, Soon Duck Kim2, Sang Hee Lee1
-
Journal of Preventive Medicine and Public Health 2012;45(1):8-13.
DOI: https://doi.org/10.3961/jpmph.2012.45.1.8
Published online: January 31, 2012
1Department of Epidemiology and Health Informatics, Graduate School of Korea University, Seoul, Korea.
2Department of Preventive Medicine, Korea University College of Medicine, Seoul, Korea.
- Corresponding author: Soon Duck Kim, MD, MPH, PhD. 126-1 Anam-dong 5-ga, Seongbuk-gu, Seoul 136-705, Korea. Tel: +82-2-920-6344, Fax: +82-2-927-7220, kimsd@korea.ac.kr
• Received: August 14, 2011 • Accepted: October 17, 2011
Copyright © 2012 The Korean Society for Preventive Medicine
This is an Open Access article distributed under the terms of the Creative Commons Attribution Non-Commercial License (http://creativecommons.org/licenses/by-nc/3.0/) which permits unrestricted non-commercial use, distribution, and reproduction in any medium, provided the original work is properly cited.
ABSTRACT
-
Objectives
- Recently injury has become a major world-wide health problem. But studies in Korea about injuries were very few. Thus, this study was conducted to analyze the trend of major injuries from 1991 to 2006 and to provide basic data for preventing injuries.
-
Methods
- This study was based on the National Statistical Office data from 1991 to 2006 and calculated to estimate the burden of major injuries by using the standard expected years of life lost (SEYLL) and total lost earnings equation.
-
Results
- For transport accidents, mortality, SEYLL and total lost earnings were increased from 1991 to 1996 and decreased from 2000 to 2006. On the other hand, for suicides, these were increased gradually. Since 2003, falls were included in ten leading causes of death. This study showed that injury causes major social and economical losses.
-
Conclusions
- We could reduce injury related premature death through active interest in injury prevention program.
- For the present, advanced countries and some developing countries show such a trend that the importance of traditional health problems, namely contagious diseases (the first group) decreases, but the significance of death and injury by noninfectious diseases, chronic degenerative diseases, traffic accidents and industrial accidents increase [1]. Injuries by traffic accidents, suicides and falls were regarded insignificantly in health circles in the past, but now these are assessed as an important cause of death and disorder throughout the world [2,3].
- Injury-oriented death occurs in younger age group of 15 to 44, thus presenting a very severe loss of workforce and social and economical damage [4]. The changes of disease structure seem to be a severe burden to medical systems for all the countries in the world and make the efficient use of limited resources difficult all the more. However recently, from the aspect of measuring lost years via adjusting with a discount rate according to age and time, the measurement of premature death-based disease burden has been attempted [5]. Research teams working in the project of world disease burden presented a new health index, namely Disability-Adjusted Life Years (DALY), in order to examine the motality of total disease burden in a society. Used in this study, standard expected years of life lost (SEYLL) is a preceding step of estimating a complete form of DALY and one of four indices of YLL [6-8]. The index of SEYLL establishes an ideal standard for every age as standard expected years of life lost, multiplies the number of death by standard expected years of life lost, and then sums up all the ages. Since the index of SEYLL adopts a standardized life table as a standard of estimation, it is of advantage to conveniently compare with other studies [5,9].
- Also, this study was to examine injury-oriented social and economical loss using the estimation method of total lost earnings. Total lost earnings in this study are one of social overhead capitals and seem to refer to the present values of expected income, namely the opportunity cost of death, which can be earned by a person if he lives a healthy life to the expected years of life without accidental death.
INTRODUCTION
- This study used original statistical data on the causes of death in 1991, 1994, 1996, 2000, 2003, and 2006 worked out by the National Statistical Office and examined the expected years of life lost, together with the changing trend of total lost earnings in relation to 10 causes of death by sexes and ages. In order to calculate premature death-oriented standard expected years of life lost, first, standard expected years were established by ages. As for the criterion of standard expected years, the life table which was worked out by the National Statistical Office was used. As for the life table, the life tables in 1991, 1994 (of which base year was 1991), 1996 (of which base year was 1995), 2000 (of which base year was 1999), 2003, and 2006 were used. Second, using the index of standard expected years of life lost, the years of life lost for traffic accidents, suicides and fall of 10 major causes of death in every year were calculated by sexes and ages. Its functional formula is as follow:

- Here, e*x refers to standard expected years of life in the age of x. L is last dying person's age in subject population and dx refers to the death toll at the age of x.
- The estimating method of premature death-oriented lost earnings is as follows: the economical costs of disease are classified into such direct costs as an outpatient medical cost and a hospitalized medical cost and such indirect costs as lost earnings and lost working costs. Lost earnings of indirect costs estimated in this study are a method of calculating expected earnings in the future if a person maintains his existence and it is estimated with a calculation method of total production lost which substituting death-oriented lost earnings with present values. As a first step of calculation of lost earnings, it was calculated with lifetime earnings which can be earned by a person in his every age, by means of using monthly total wages by years, sexes and ages presented in the survey of basic statistics for wage structure by the Ministry of Labor. In other words, by summing up expected lost earnings over the period from the age of premature death to the expected years of life, premature death-oriented lost earnings were estimated. This study supposed there were no earnings in the ages of 0 to 19 and after 60 years of age in life cycle, by establishing 59 years as an average age of retirement. In addition, in order to convert future earnings into present values, a discount rate of 3% (r) was established on the assumption that the increase of wages exceeded time preference, thus estimating future earnings as present values [10,11].
- According to this process, the present values of future earnings can be defined with following formula (1):

- Here, EIt means expected earnings when a person died in the time of t. It+T refers to the earnings generated in t+T. And r is a discount rate and it is established in 0.97 in this study, in order to compare with the findings of domestic preceding studies. But at the time of analyzing sensitivity, discount rates of 5% and 10% were applied [11,12]. And t+T (=59) refers to an average age of retirement. Because not all the main agents of economic activity take part in economical activity at the time of t, it is necessary to calculate expected earnings by taking economic activity rate and employment rate into account. Considering the above fact, the formula (1) can be presented as follow:
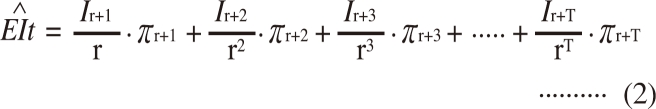
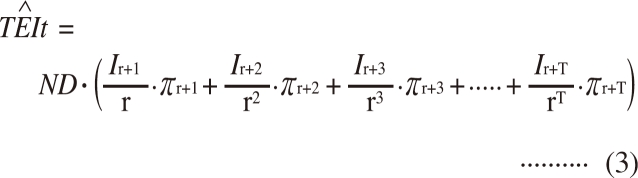
- Here, π represents the multiplication of t's economic activity rate and employment rate. In addition, if the number of death (ND) is combined with formula (2), death cause-oriented total lost earnings (TEI) can be calculated with following formula (3):
METHODS
- I. Rank Trend of Standard Expected Years of Life Lost and Lost Earnings
- Traffic accidents, suicides and falls are included 10 causes of death except falls in 2006 from 1991 to 2006. Rank of SEYLL and total lost earnings is a higher standard than death rank (Table1).
- II. Mortality Rate and Outcome of That Injuries
- Mortality rate and the burden of traffic accidents, suicides and falls by gender were calculated and results are presented in Table 2. The mortality rate, SEYLL and total lost earnings of traffic accidents increased until 2000 and then have decreased after 2000 in men and women alike. Suicides have increased year after year in men and women alike. Male falls results are higher than female falls. The burden of that injuries by ages shows that is higher in younger age group of 20s to 40s (Figures 1 and 2)
- III. Sensitivity Analysis
- In this study, the discount rate which was applied to the conversion of future earnings into present values at the time of estimating premature death-oriented lost earnings was established in 3% and future earnings were converted into present values. In addition, by applying the discount rates of 5% and 10%, sensitivity was examined. Results are presented in Table 3.
RESULTS
- This study was examined 10 major causes of death over the period of 1991 to 2006 and assessed the change of 10 death causes and the extent of socioeconomic burden, in order to understand major injury-oriented mortality and its extent of socioeconomic loss. Among 10 causes of death for the period of 1991 to 2006, traffic accidents and suicide-oriented accidental death occupy great proportion. In 2003, falls were included in 10 causes of death. The literature by Krug et al. [2] also presents the fact that traffic accidents and suicides are injury-related major causes of death throughout the world. Also, the mortality rate and SEYLL of suicides has increased radically.
- Studies by Kim [4], Chong [10], and Chong [11] present the same findings that traffic accidents decreased whereas suicides and falls increased in 2000 than in 1990. The reason why traffic accidents has decreased since 2000 is that with the revision of the Road Traffic Act in 1999, bike lane has separated from the road, and every city has intensified their effort for the education of traffic safety by carrying out such measures as traffic safety campaign, traffic safety facility establishment, traffic accident reduction campaign and turn-on-the-headlight campaign in the daytime since 2000. In addition, since 2001, bus lane has been introduced for the first time and the use of mobile phone at the wheel has been prohibited, thus seemingly resulting in the reduction of the number of traffic accidents and its death toll. Like foreign countries, the consistent increase of suicide-oriented premature death is closely related to national economy. The study by Park et al. [13] argues that the stagnation of national economy has significant influence upon workers' socio-psychological stress.
- In this study, SEYLL which presenting the sum of hours lost by premature death, were used as measuring index of premature death-oriented burden of disease and loss. SEYLL has various advantages. In the calculation of disease burden, all the deaths in every age group are included and the death in the same sex and age has the same weight in the burden of disease. Another advantage is that comparing to other methods, the change of expected years of life is closer in SEYLL [14,15].
- As for the SEYLL by traffic accidents, suicides and falls, domestic preceding studies were insufficient and it was impossible to compare with other literature. According to WHO reports, injury-oriented death in 2000 was 83.7 per 100000 people, resulting in the death toll of about 5 million people worldwide [16,17]. And injuries occur in younger age groups, injury-oriented workforce loss and socioeconomic loss are severe. In the age group of 15 to 44, there are a lot of traffic accidents, explosion, self-injury, war, addiction and exposure to fire. In the age group of 45 and above, many died with self-injury [4]. This study was confirmed high premature death at a young age of 20 to 40.
- In order to examine the extent of major injury-oriented socioeconomic burden, this study estimated total lost earnings which were indirect costs that presenting socioeconomic costs as monetary values. The discount rate, which was used to convert future earnings into present values, was established at 3% in this study. The study by Park et al. [18] was also used 3% discount rate. And at the same time, the results of 5% and 10% discount rate presented. By means of examining 147 theses, Smith and Gravelle [19] looked into discount rates which were used to assess economic feasibility. Thirty-five percent of the theses used 0% discount rate, whereas 47% used 5% discount rate and 10% used 3% discount rate.
- Study findings present that total lost earnings by traffic accidents and suicides ranked in higher places. This finding is consistent with the study by Chong [10] and Chong [11] which presenting the fact that among accidental deaths, traffic accidents, and suicides ranked in the first and second place respectively. Also, among 10 causes of death in 2003 and 2006, total lost earnings by falls ranked in the 7th and 8th place respectively, thus presenting the fact that the economical loss of premature death by falls was severe. However, there were no preceding studies on total lost earnings. So it was impossible to compare with other studies. In the study by Kim [4], the domestic mortality of falls was higher than that of the United Kingdom, the United States and Japan. And it was higher in men than women. The limitation of this study was the inaccuracy of computerized statistical data on the causes of death in the 1990s [20]. Although studies on the change of injury and its extent of socioeconomic burden have been carried out in many countries, domestic studies on them are very rare. In this vein, study findings seem to provide basic data to the studies on injuries.
DISCUSSION
-
The authors have no conflicts of interest with the material presented in this paper.
-
This article is available at http://jpmph.org/.
Notes
- 1. Lee HJ, Chung WJ, Kim HJ, Lee SM. Estimation of the burden of disease in Thailand. Korean Health Econ Rev 2003;9(1):79-95. (Korean)
- 2. Krug EG, Sharma GK, Lozano R. The global burden of injuries. Am J Public Health 2000;90(4):523-526. 10754963ArticlePubMedPMC
- 3. Organisation for Economic Co-operation and Development. Institut de recherche et documentation en economie de la sante. OECD health data 2007: statistics and indicators for 30 countries. 2007. Paris: OECD, CREDES
- 4. Kim S. Epidemiology and control of injury. J Prev Med Public Health 2005;38(2):125-131. (Korean). 16315748PubMed
- 5. Yoon SJ, Kim YI, Kim CY, Chang H. Measuring the burden of major cancers due to premature death in Korea. Korean J Prev Med 2000;33(2):231-238. (Korean)
- 6. Anand S, Hanson K. Disability-adjusted life years: a critical review. J Health Econ 1997;16(6):685-702. 10176779ArticlePubMed
- 7. Barker C, Green A. Opening the debate on DALYs (disability-adjusted life years). Health Policy Plan 1996;11(2):179-183. 10172660ArticlePubMed
- 8. Chapman G, Hansen KS, Jelsma J, Ndhlovu C, Piotti B, Byskov J, et al. The burden of disease in Zimbabwe in 1997 as measured by disability-adjusted life years lost. Trop Med Int Health 2006;11(5):660-671. 16640619ArticlePubMed
- 9. Chang H, Myoung JI, Shin Y. Burden of disease in Korea: years of life lost due to premature deaths. Korean J Prev Med 2001;34: 354-362. (Korean)
- 10. Chong YH. Estimation of loss of income from external causes of mortality. Health Welf Policy Forum 2002;cited 2011 Dec 20. 65: Available from: http://www.kihasa.re.kr/html/jsp/public/public_02_01_view.jsp?ano=1&aid=17
- 11. Chong YH. An estimation of lost earings attributable to cancer-induced deaths. Health Welf Policy Forum 2002;cited 2011 Dec 20. 67: Available from: http://www.kihasa.re.kr/html/jsp/public/public_02_01_view.jsp?ano=1&aid=19
- 12. Park K, Eun SJ, Lee EJ, Lee CE, Park DY, Han K, et al. The incidence and patterns of unintentional injuries in daily life in Korea: a nationwide study. J Prev Med Public Health 2008;41(4):265-271. (Korean). 18664733ArticlePubMedPDF
- 13. Park J, Kim S, Ji S, Lee J. Secular trends of suicide mortality in Korea. Korean J Epidemiol 2003;25(2):84-91. (Korean)
- 14. Kominski GF, Simon PA, Ho A, Luck J, Lim YW, Fielding JE. Assessing the burden of disease and injury in Los Angeles County using disability-adjusted life years. Public Health Rep 2002;117(2):185-191. 12357003ArticlePubMedPMC
- 15. Murray CJ, Lopez AD. The global burden of disease: a comprehensive assessment of mortality and disability from diseases, injuries and risk factors in 1990 and projected to 2020. 1996. Cambridge: Harvard University Press
- 16. Holder Y. Centers for Disease Control and Prevention. World Health Organization. Injury surveillance guidelines. 2001. Atlanta: Centers for Disease Control and Prevention; Geneva: World Health Organization
- 17. Jeong YH, Go SJ. Estimating socioeconomic costs of five major diseases. Korean Assoc Public Finance 2004;18(2):77-104. (Korean)
- 18. Park K, Lee JS, Kim Y, Kim YI, Kim J. The socioeconomic cost of injuries in South Korea. J Prev Med Public Health 2009;42(1):5-11. (Korean). 19229119ArticlePubMedPDF
- 19. Smith D, Gravelle H. The practice of discounting economic evaluation of health care interventions. 2000. York: University of York, Centre for Health Economics
- 20. Park DK, Kim SY, Kang JH, Han SH, Kim CH, Lee MC, et al. Errors in death certificates in Korea. J Korean Acad Fam Med 1992;13: 442-449. (Korean)
REFERENCES
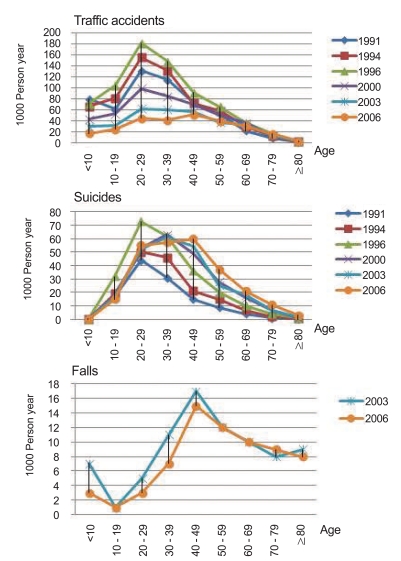
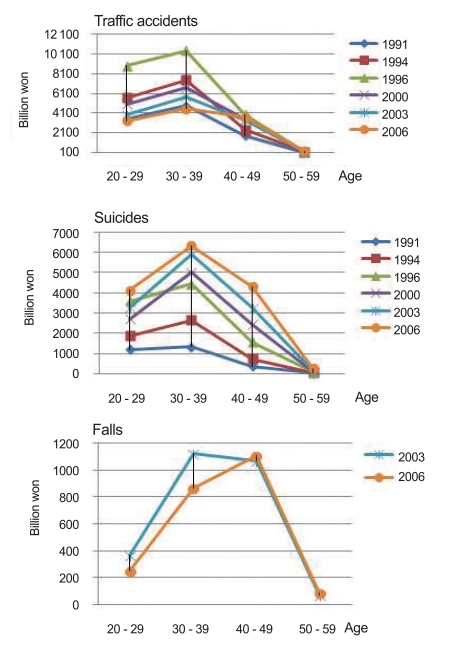
Table 1.Death rank and rank of SEYLL (1000 person year) and lost earnings (billion won)
Table 2.Results of mortality rate(100 000 person), SEYLL(1000 person year) and lost earnings (billion won) by gender
Table 3.Results of sensitivity analysis by using different discount rates (billion won)
Figure & Data
References
Citations
Citations to this article as recorded by 
- Joinpoint Regression About Injury Mortality and Hospitalization in Korea
Hyun Jin Park, Ui Jeong Kim, Won kyung Lee, Bohyun Park, Yoonhee Shin, Seonhwa Lee, Eun Jeong Choi, Nam-eun Kim, Ju Ok Park, Hyesook Park
Journal of Korean Medical Science.2022;[Epub] CrossRef - Development of a modified trauma and injury severity score to predict disability in acute trauma patients
Ki Jeong Hong, Kyoung Jun Song, Sang Do Shin, Young Sun Ro, Jeong Ho Park, Seung Chul Lee, Chu Hyun Kim
Clinical and Experimental Emergency Medicine.2020; 7(4): 281. CrossRef - Trend in Disability-Adjusted Life Years (DALYs) for Injuries in Korea: 2004–2012
Yoonjic Kim, Yu Jin Kim, Sang Do Shin, Kyoung Jun Song, Jungeun Kim, Jeong Ho Park
Journal of Korean Medical Science.2018;[Epub] CrossRef - The Burden of Acute Pesticide Poisoning and Pesticide Regulation in Korea
Seulki Ko, Eun Shil Cha, Yeongchull Choi, Jaeyoung Kim, Jong-Hun Kim, Won Jin Lee
Journal of Korean Medical Science.2018;[Epub] CrossRef - Disability-Adjusted Life Years (DALYs) for Injuries Using Death Certificates and Hospital Discharge Survey by the Korean Burden of Disease Study 2012
Won Kyung Lee, Dohee Lim, Hyesook Park
Journal of Korean Medical Science.2016; 31(Suppl 2): S200. CrossRef - The Burden of Premature Mortality in Hamadan Province in 2006 and 2010 Using Standard Expected Years of Potential Life Lost: A Population-based Study
Jalal Poorolajal, Nader Esmailnasab, Jamal Ahmadzadeh, Tahereh Azizi Motlagh
Epidemiology and Health.2012; 34: e2012005. CrossRef
 PubReader
 ePub Link
 Cite
Cite


