
Articles
- Page Path
- HOME > J Prev Med Public Health > Volume 52(6); 2019 > Article
-
Original Article
Associations of Ambient Air Pollutant Concentrations With Respiratory Symptoms and Perceived Health Status in Japanese Adults With and Without Chronic Respiratory Diseases: A Panel Study -
Motoyuki Nakao1
 , Keiko Yamauchi1, Satoshi Mitsuma2, Tetsuro Odaira3, Hideto Obata4, Yoichi Chijimatsu5, Yoko Ishihara1
 -
Journal of Preventive Medicine and Public Health 2019;52(6):416-426.
DOI: https://doi.org/10.3961/jpmph.19.180
Published online: November 13, 2019
1Department of Public Health, School of Medicine, Kurume University, Kurume, Japan
2Niigata Association of Occupational Health Inc., Niigata, Japan
3Nishi-Niigata Chuo National Hospital, Niigata, Japan
4Yamaguchi-ken Saiseikai Shimonoseki General Hospital, Yamaguchi, Japan
5Chijimatsu Kokyuki Junkanki Naika Clinic, Yamaguchi, Japan
- Corresponding author: Yoko Ishihara, PhD Department of Public Health, School of Medicine, Kurume University, 67 Asahimachi, Kurume, Fukuoka 830-0011, Japan E-mail: guni0you@gmail.com
Copyright © 2019 The Korean Society for Preventive Medicine
This is an Open Access article distributed under the terms of the Creative Commons Attribution Non-Commercial License (http://creativecommons.org/licenses/by-nc/4.0/) which permits unrestricted non-commercial use, distribution, and reproduction in any medium, provided the original work is properly cited.
ABSTRACT
-
Objectives
- In recent years, transboundary air pollution from mainland East Asia has led to growing concerns about air pollution in Japan. Air pollution is reportedly associated with the exacerbation of respiratory diseases. In this study, we assessed the effects of air pollution on respiratory symptoms and the health status of participants with and without chronic respiratory diseases.
-
Methods
- Participants (n=2753) with and without chronic respiratory diseases who visited healthcare facilities in Japan during February from 2010 to 2015 filled out a self-report questionnaire regarding their symptoms and perceived health status. Participants were followed up during April-May and June-July.
-
Results
- Oxidant concentrations were associated with respiratory symptoms, overall health, and quality of life (QoL). Suspended particulate matter (SPM) and particulate matter <2.5 μm levels were associated with physical fitness; SPM was also associated with QoL. Recent experience of an Asian sand dust event had a significant effect on allergic symptoms, change in health, and QoL.
-
Conclusions
- Respiratory symptoms were more strongly affected by oxidants than by other pollutants. Significant associations of air pollutants were found with a comprehensive range of items related to perceived health status, including overall health and QoL. Although the effects of air pollutants on respiratory symptoms and health status were more apparent among patients with respiratory diseases, the adverse effects of air pollutants were significant even among participants without such conditions.
- Chronic obstructive pulmonary disease (COPD) is characterized by airflow limitation [1], and has been reported by the World Health Organization to be the third leading cause of death worldwide [2]. Chronic respiratory diseases, including COPD and asthma, account for 4.7% of global disability-adjusted life-years, and the COPD burden is influenced by severity, exacerbation, and comorbidities [3-5]. This burden is expected to remain high in coming decades due to population aging in developed countries, including Japan and Korea. Although smoking is the best-known risk factor for COPD, occupational exposure and air pollution are also known risk factors [1,6,7].
- Of these factors, exposure to air pollution is particularly difficult to avoid. Air pollutant concentrations are associated with morbidity and mortality from cardiorespiratory diseases [8], and outdoor air pollution is associated with the exacerbation of COPD [9]. In Japan, major sources of air pollution were industry during the 1950s and 1960s and motorization during the 1970s. Such air pollution has decreased due to efforts by policymakers and the public administration [10]. However, there has been a recent revival of concerns about air pollution in Japan, partly owing to transboundary air pollution from mainland East Asia, where some severely air-polluted areas are known to be located [11-15]. Air pollutants come not only from anthropogenic sources, but also from a natural phenomenon known as Asian sand dust (ASD). ASD particles originate in Northeast Asia, and westerly winds transport ASD to Korea and Japan during the spring. These particles are accompanied by pollutants produced by industries on the eastern coast of China [16-18]. Air pollution might affect an individual’s health status by exacerbating existing diseases and symptoms. Moreover, the impact of air pollution on health status might be greater for respiratory diseases than for other conditions. We therefore investigated the associations between air pollution and health status among individuals with and without chronic respiratory diseases in Japan.
INTRODUCTION
- Study Design and Location
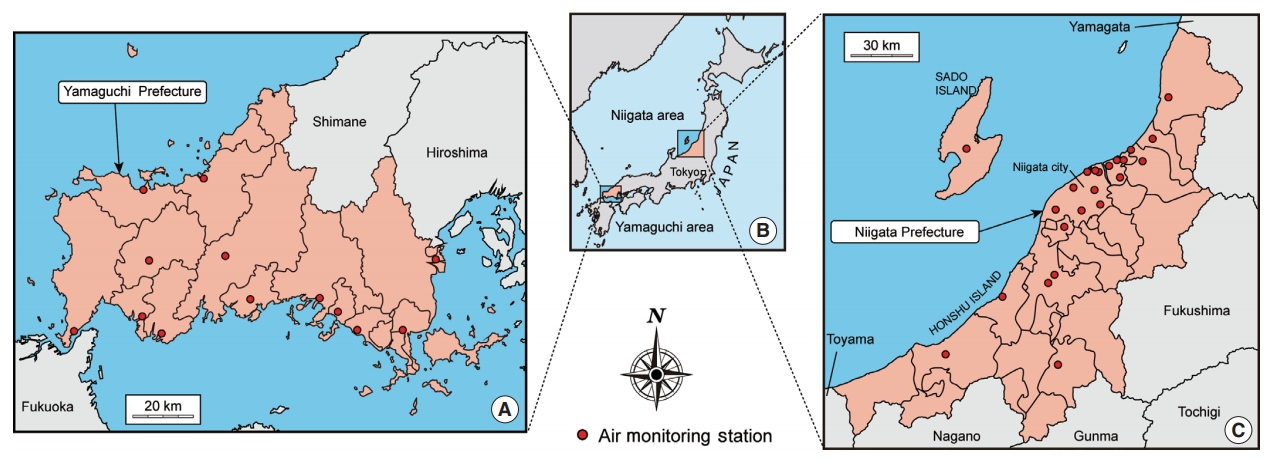
- Panel studies were conducted in 2 areas of Japan: Yamaguchi-ken Saiseikai Shimonoseki General Hospital, Shimonoseki City Hospital, Ushio Iin Kamenokou Clinic, Ikeda Naika Clinic, Chijimatsu Kokyuki Junkanki Naika Clinic, and Ohata Naika Kokyukika Clinic in Yamaguchi Prefecture; and Niigata Association of Occupational Health and Nishi-Niigata Chuo National Hospital in Niigata Prefecture. The studies were conducted during 2010-2015 in Yamaguchi and 2011-2015 in Niigata, with different participants each year. Participants were recruited during routine visits for stable chronic respiratory diseases or check-ups for participants without respiratory conditions. The follow-up rate is presented in Supplemental Material 1.
- Participants
- Initially, 2981 Japanese participants signed up for this study. To avoid a disproportionate age distribution between participants with and without respiratory diseases, 102 participants were excluded because they were outside the age range of 50-79 years old. To exclude patients in an unstable condition and those with an inaccurate diagnosis, we excluded participants with infectious diseases; those with severe diseases such as cancer, pneumoconiosis, pulmonary sarcoidosis, bronchiectasis, or a history of pneumonectomy (n=103); those with incomplete questionnaires (n=7); and those who did not undergo proper pulmonary function tests (n=16). Finally, 2753 participants were included in the analysis.
- Measurements
- Participants completed a questionnaire with items on age, sex, and symptoms experienced during the previous fortnight. They also completed the Dartmouth COOP Functional Health Assessment Charts/World Organization of Family Doctors (COOP/WONCA) questionnaire charts, which were used to measure health status, functional status, and health-related quality of life (HR-QoL) during the previous fortnight. Permission was obtained from the Japan Primary Care Association to use the Japanese version of the COOP/WONCA charts. The responses to the COOP/WONCA charts comprised 8 items (”physical fitness,“ ”feelings,“ ”daily activities,“ ”social activities,“ ”change in health,“ ”overall health,“ ”pain,“ and ”quality of life [QoL]”), scored using a 5-point ordinal scale (1, best functioning; 5, worst functioning) [19]. Questionnaires were administered to participants during February, with follow-ups during April-May and June-July in each year. The questionnaire was administered on-site in February and by mail during April-May and June-July; the content of the questionnaires was the same in each period.
- Air Quality Data
- Air monitoring data were obtained from local public administrations and the Ministry of the Environment of Japan. Variables including carbon monoxide (CO), nitrogen dioxide (NO2), photochemical oxidants (Ox), sulfur dioxide (SO2), particulate matter <2.5 μm in diameter (PM2.5), and suspended particulate matter (SPM) were measured according to the air quality standards (AQS) of the Ministry of the Environment of Japan [20]. SPM was defined as airborne particles with a diameter less than about 7 μm. The category of Ox included oxidizing substances, such as ozone and peroxyacetyl nitrate, produced by photochemical reactions (only those capable of isolating iodine from neutral potassium iodide, excluding NO2) [20]. Data obtained at the monitoring station nearest the residential address of each participant were considered as the participant’s environmental exposure. A map of the survey area is shown in Figure 1.
- Data Handling and Statistical Analyses
- All data were anonymized. We used a binary logistic model that specified a binominal distribution and a logit link function in a generalized estimating equation (GEE) analysis [21].
- For the GEE analysis, COOP/WONCA chart scores were coded as dependent variables (0=better scores [1-3 points]; 1=worse scores [4-5 points]). The following questions addressed respiratory symptoms:
- • Q1, Does the weather affect your cough?
- • Q2, Have you ever coughed up sputum from your chest when you do not have a cold?
- • Q3, Do you usually cough up sputum from your chest first thing in the morning?
- • Q4, How frequently do you wheeze?
- • Q5, Do you have or have you had any allergic symptoms?
- In the GEE analysis, negative and positive responses were coded as 0 and 1, respectively.
- Odds ratios (ORs) were adjusted according to the independent variables, including survey region (0=Niigata; 1=Yamaguchi), age (by 10-year intervals), sex (0=female; 1=male), body mass index (BMI; 10 kg/m2), smoking status (0=never smoker; 1=former smoker; 2=current smoker), COPD severity (0=no COPD; 1=Global Initiative for Chronic Obstructive Lung Disease [GOLD] stage 1; 2=GOLD stage 2; 3=GOLD stage 3-4), physician-diagnosed asthma (0=no asthma; 1=asthma), the interaction between COPD (0=no COPD; 1=COPD) and asthma (0=no asthma; 1=asthma), hay fever (0=no hay fever; 1=hay fever), time spent outdoors (by 1-hour increments), ambient temperature (by 10°C increments), and relative humidity (by 10% increments). ORs were presented for incremental differences of 10 ppb (Ox), 10 μg/m3 (SPM, PM2.5), and experience of an ASD event during the previous fortnight. For SPM and PM2.5, the mean of the preceding 14 daily mean values was entered as the independent variable. The mean of the daily mean values (6 a.m. to 8 p.m.) of each of the preceding 14 days was entered as the independent variable of Ox. If a participant experienced an ASD event during the previous fortnight, the variable was coded as 1; otherwise, 0 was entered. We used air quality data from the preceding 14 days because the questionnaire queried participants about their conditions during the previous 2 weeks. Air quality variables were entered separately in the model because they vary in relation to each other and multicollinearity was a concern.
- Statistical analyses were performed using SPSS version 25 (IBM Corp., Armonk, NY, USA) with the chi-square test for categorical data, the Welch t-test for continuous data, and GEE analysis. A p-value <0.05 was considered to indicate statistical significance.
- Ethics Statement
- This study was approved by the Clinical Ethical Review Board of Kurume University School of Medicine (IRB No. 13212). Before the investigation, participants were provided with an explanation in person regarding the purpose and method of the study, as well as information regarding handling of the results. All participants provided written consent.
METHODS
- Characteristics of Participants
- As shown in Table 1, more individuals with chronic respiratory diseases (patients) in Yamaguchi (n=911, 82.5%) participated in the present study than those in Niigata (n=321, 19.5%). The mean age of patients with chronic respiratory diseases was significantly higher than that of participants without chronic respiratory diseases (non-patients) in both areas. In Niigata, the mean BMI of patients was significantly lower than that of non-patients. There were more male than female participants in Niigata (sex ratio=1141:508) whereas the proportion of each sex was nearly equal in Yamaguchi (sex ratio=562:542). The current smoking rate among non-patients in Niigata (23.2%) was higher than that of non-patients in Yamaguchi (14.0%). In both areas, there were fewer smokers among patients than among non-patients, whereas there were more former smokers among patients than among non-patients. There were more patients with severe COPD (GOLD stage 3-4) in Niigata (24.3%) than in Yamaguchi (9.8%).
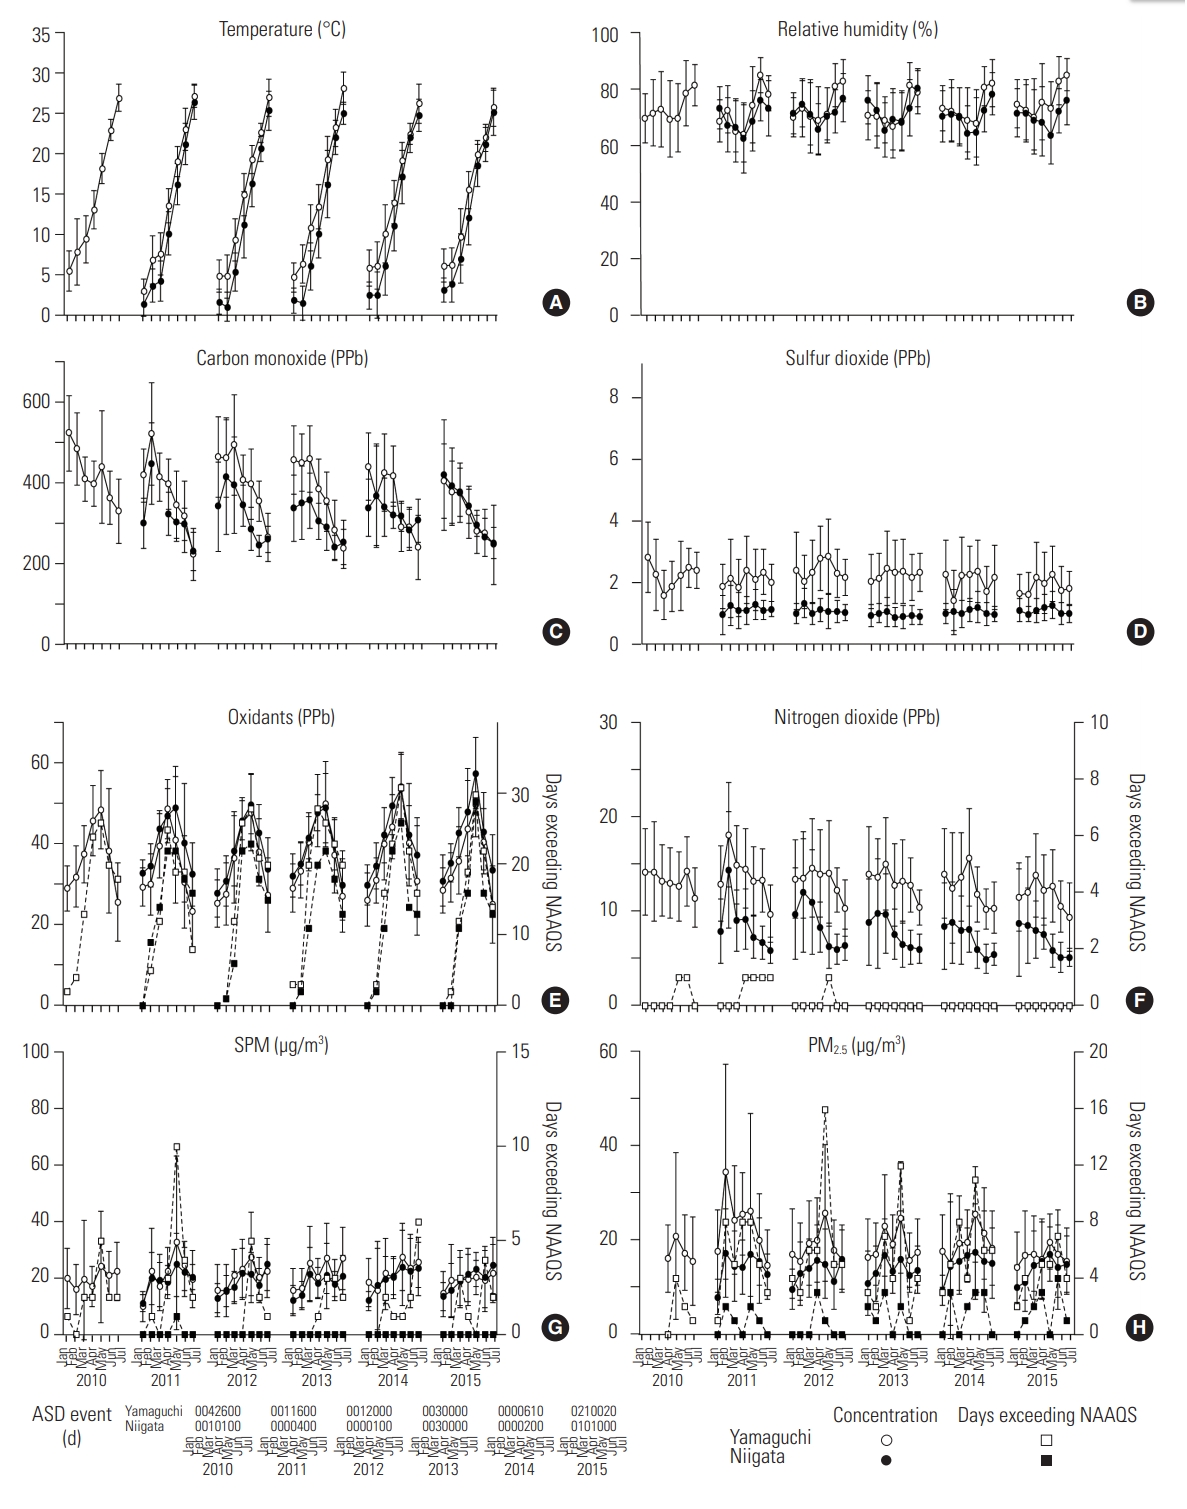
- Seasonal Variations in Ambient Air Quality During the Study
- Figure 2 depicts CO, SO2, and NO2 concentrations, which were generally well below the AQS [20]. NO2 concentrations exceeded AQS on 7 days over the 6 years, in Yamaguchi only. Although the monthly average of daily Ox levels did not reach the AQS during the study period, there were many days on which the hourly Ox levels during daytime hours exceeded the AQS (1113 days in Yamaguchi; 691 days in Niigata). The relatively large standard deviations of the monthly PM2.5 and SPM concentrations in both areas indicate large fluctuations in the daily levels of those pollutants. On some days, daily PM2.5 (247 days in Yamaguchi; 62 days in Niigata) and SPM levels (113 days in Yamaguchi; 3 days in Niigata) exceeded the AQS, yet the monthly means of both were below the AQS during the study period. ASD events were observed more often in Yamaguchi than in Niigata.
- Associations Between Exposure to Air Pollution and Respiratory Symptoms
- As shown in Table 2, symptoms 1 (weather affecting a cough), 2 (sputum production without a cold), and 3 (sputum production first thing in the morning) were significantly associated with Ox (symptom 1: OR, 1.094; 95% confidence interval [CI], 1.022 to 1.171; symptom 2: OR, 1.139; 95% CI, 1.083 to 1.198; and symptom 3: OR, 1.096; 95% CI, 1.038 to 1.157). ASD events were significantly associated with symptom 5 (allergic symptoms) (OR, 1.270; 95% CI, 1.041 to 1.549). Regarding variables other than air quality, a regional difference was observed for symptom 5 (OR, 1.433; 95% CI, 1.138 to 1.804). Symptom 5 was also negatively associated with older age (OR, 0.712; 95% CI, 0.620 to 0.818). Male participants were more susceptible to symptom 2 (OR, 1.304; 95% CI, 1.068 to 1.591) and symptom 3 (OR, 1.277; 95% CI, 1.023 to 1.595), whereas symptom 5 was more prevalent among female participants (OR, 0.674; 95% CI, 0.540 to 0.841). Being a current smoker was positively associated with symptom 2 (OR, 2.110; 95% CI, 1.659 to 2.683), symptom 3 (OR, 2.570; 95% CI, 1.966 to 3.360), and symptom 4 (frequent wheezing) (OR, 2.311; 95% CI, 1.706 to 3.130) and negatively associated with symptom 5 (OR, 0.640; 95% CI, 0.476 to 0.863). Hay fever (OR range, 1.246 to 7.211) and asthma (OR range, 3.740 to 8.710) were significantly associated with all symptoms. COPD was positively associated with symptoms 1-4, and the magnitude of the association increased with disease severity. The interaction between COPD and asthma was significant for all items. Time spent outdoors was negatively associated with symptom 5 (OR, 0.963; 95% CI, 0.941 to 0.985).
- Associations Between Exposure to Air Pollution and Health Status
- As shown in Table 3, Ox concentrations were negatively associated with change in health (OR, 1.123; 95% CI, 1.025 to 1.232), overall health (OR, 1.172; 95% CI, 1.085 to 1.265), and QoL (OR, 1.175; 95% CI, 1.087 to 1.271) scores. PM2.5 and SPM levels were associated with worse physical fitness scores (PM2.5: OR, 1.217; 95% CI, 1.047 to 1.415 and SPM: OR, 1.095; 95% CI, 1.011 to 1.187). SPM was also associated with worse QoL scores (OR, 1.145; 95% CI, 1.030 to 1.273). Experiencing an ASD event showed a negative association with change in health (OR, 1.384; 95% CI, 1.062 to 1.803) and QoL (OR, 1.424; 95% CI, 1.127 to 1.800) scores. Regarding other variables, a regional difference was observed for physical fitness (OR, 1.402; 95% CI, 1.159 to 1.696) scores. Older age was related to worse scores for physical fitness (OR, 1.887; 95% CI, 1.679 to 2.121) and better scores for feelings (OR, 0.770; 95% CI, 0.649 to 0.913) and change in health (OR, 0.854; 95% CI, 0.733 to 0.994). Male participants had better scores for physical fitness (OR, 0.467; 95% CI, 0.381 to 0.571), feelings (OR, 0.614; 95% CI, 0.461 to 0.819), change in health (OR, 0.767; 95% CI, 0.599 to 0.983), and pain (OR, 0.647; 95% CI, 0.497 to 0.842). BMI was associated with worse scores for physical fitness (OR, 1.027; 95% CI, 1.002 to 1.052) and pain (OR, 1.041; 95% CI, 1.010 to 1.072). Current smoking showed an association with worse physical fitness (OR, 1.728; 95% CI, 1.335 to 2.237) and feelings (OR, 1.598; 95% CI, 1.116 to 2.287). There were significant associations between hay fever and worse scores for feelings (OR, 1.436; 95% CI, 1.138 to 1.813), change in health (OR, 1.552; 95% CI, 1.265 to 1.906), overall health (OR, 1.413; 95% CI, 1.168 to 1.709), pain (OR, 1.414; 95% CI, 1.139 to 1.754), and QoL (OR, 1.426; 95% CI, 1.171 to 1.735). COPD severity was significantly associated with worse scores on all items except feelings and pain, and the magnitude of association increased with disease severity. Physician-diagnosed asthma was significantly associated with worse scores on all items except physical fitness (Table 3). The interaction between COPD and asthma was significant for all items. Time spent outdoors was associated with better scores for physical fitness (OR, 0.922; 95% CI, 0.899 to 0.945), feelings (OR, 0.947; 95% CI, 0.913 to 0.983), daily activities (OR, 0.924; 95% CI, 0.883 to 0.966), social activities (OR, 0.843; 95% CI, 0.787 to 0.903), and QoL (OR, 0.962; 95% CI, 0.936 to 0.989).
RESULTS
- Transboundary air pollution occurs during the winter in Japan due to severe air pollution in mainland East Asia [22,23]. ASD events are frequently observed during April-May [24]. Therefore, the first survey was held during winter, with follow up during April-May. The third survey was conducted during June-July, when the ambient air is relatively clean.
- Adverse effects of air pollution have been reported for decades [25,26]. In the present study, Ox concentrations were associated with symptoms 1-3 (Table 2). These symptoms were also associated with hay fever, COPD, and asthma (Table 2). These results suggest that Ox triggered respiratory symptoms even in participants without chronic respiratory diseases (non-patients), and that patients with these diseases were affected more adversely by Ox than non-patients. ASD was associated only with allergic symptoms, which were not associated with COPD; however, hay fever and asthma were related to allergic symptoms (Table 2). This finding is unsurprising because allergic or asthma-like symptoms have been reported to occur without clinical signs in some cases of environmental exposure [27].
- We measured health status, including QoL, because the concept of HR-QoL has been proposed as a health outcome of environmental pollution [28]. Here, physical fitness was associated with SPM, PM2.5, and COPD (Table 3). This result was also anticipated given that chronic airway obstruction degrades an individual’s physical fitness score, and this functional deterioration is enhanced by particulate matter. Ox concentrations were significantly associated with change in health, overall health, and QoL, and were related to hay fever, COPD, and asthma (Table 3). Change in health and QoL were associated with ASD events, and QoL showed a significant association with SPM. These results suggest that air pollutants, such as Ox, SPM, and ASD, tend to be associated with the comprehensive domain of health status, including change in health, overall health, and QoL. PM2.5 was significantly related only to physical fitness. The acute effects of exposure to PM2.5 might be less likely to occur than those of exposure to SPM and ASD, which are composed of larger particles.
- The adverse health effects of ozone have been well documented [29,30]. Ozone enhances airway hyperreactivity, even in healthy people [31,32]. The results of the present study are consistent with those of previous studies. Although the health effects of acute exposure to particulate matter have been evaluated using endpoints such as death, hospitalization, and symptoms [25,26,33], SPM and PM2.5 were not associated with any symptoms in this study (Table 2). We speculate that PM2.5 affects mortality and morbidity through long-term exposure, rather than by triggering symptoms caused by physical stimuli irritating the respiratory system. ASD events in Japan greatly influence particulate matter concentrations [16-18] and are associated with increased mortality and morbidity [34-36]. In the present study, ASD events showed a significant association with allergic symptoms, and regional differences in allergic symptoms were observed (Table 2). As ASD events were recorded more frequently in Yamaguchi than in Niigata (Figure 2), the regional difference in allergic symptoms might have been due to the difference in frequency of ASD events. These results suggest that recent experience of an episodic increase in particulate concentration, as occurs during an ASD event, is responsible for triggering allergic symptoms.
- Air pollution has been reported to be associated with the “vitality” domain of the Medical Outcome Study Short Form-36 Health Survey (SF-36), a questionnaire measuring HR-QoL [37,38]. “Vitality” is part of the mental component of the SF-36, whereas the corresponding item in the COOP/WONCA charts is “feelings.” In contrast to previous studies, air pollution was not associated with feelings, but was predominantly associated with broader and comprehensive items such as change in health, overall health, and QoL (Table 3). Differences in the study population or design might explain the differing results across studies. All symptoms except allergic symptoms and all health status items except feelings and pain were associated with COPD; these symptoms and health status (excluding symptom 4, daily activities, and social activities) were also associated with at least 1 air pollutant, even after adjustment for respiratory diseases (Tables 2 and 3). These results suggest that, in terms of symptoms 1-3, physical fitness, change in health, overall health, and QoL, patients were more vulnerable than non-patients to air pollution exposure. We observed a negative interaction between COPD and asthma (Tables 2 and 3). It is reasonable that asthma with concomitant COPD showed no synergistic effects on outcomes because some symptoms, such as coughing and wheezing, are common to both diseases. However, why the effect of asthma (without COPD) on outcomes (especially for symptoms) was greater than that of asthma overlapping with mild COPD remains unclear.
- There are several limitations of this study. First, the follow-up was not strict, as this was designed as a panel study; therefore, the underlying causal relationships remain unclear. Additionally, participants did not always fill out questionnaires during deconditioning, even though air pollution caused adverse effects on participants. Thus, the impact of air pollution may have been underestimated. Second, it was impossible to account for individual differences in participants’ activities and movements, which may have affected their exposure to air pollutants. To accurately estimate the effects of air pollution, it is necessary to measure personal air pollution exposure.
- In conclusion, respiratory symptoms were found to be more strongly affected by Ox than by other pollutants. We found significant associations of air pollutants with a comprehensive range of items relating to health status, including overall health and QoL. Although the associations of air pollutants with respiratory symptoms and health status were more apparent in patients with respiratory diseases, adverse associations between these outcomes and air pollutants were significant, even in participants without respiratory diseases.
DISCUSSION
SUPPLEMENTAL MATERIALS
-
CONFLICT OF INTEREST
The authors have no conflicts of interest associated with the material presented in this paper.
Notes
ACKNOWLEDGEMENTS
-
AUTHOR CONTRIBUTIONS
Conceptualization: YI, MN. Data curation: YI, MN, KY, SM, TO, HO, YC. Formal analysis: YI, MN, KY. Funding acquisition: YI. Methodology: YI, MN, KY. Project administration: YI, MN, SM, TO, HO, YC. Visualization: MN, KY. Writing - original draft: MN. Writing - review & editing: YI, MN, KY, SM, TO, HO, YC.
Notes
| Variables | Symptom 1 | Symptom 2 | Symptom 3 | Symptom 4 | Symptom 5 |
|---|---|---|---|---|---|
| Living in Yamaguchi area (vs. Niigata area) | 0.788 (0.609, 1.020) | 1.037 (0.850, 1.264) | 1.095 (0.884, 1.356) | 1.078 (0.864, 1.345) | 1.433 (1.138, 1.804)** |
| Age (10-y increments) | 0.912 (0.791, 1.051) | 0.968 (0.860, 1.088) | 1.087 (0.955, 1.237) | 1.115 (0.972, 1.279) | 0.712 (0.620, 0.818)*** |
| Male (vs. female) | 0.784 (0.605, 1.014) | 1.304 (1.068, 1.591)** | 1.277 (1.023, 1.595)* | 0.969 (0.761, 1.235) | 0.674 (0.540, 0.841)*** |
| Body mass index (1 kg/m2 increments) | 0.980 (0.954, 1.008) | 1.007 (0.984, 1.031) | 1.025 (0.999, 1.051) | 1.024 (0.998, 1.051) | 0.996 (0.971, 1.022) |
| Smoking status (vs. never smoker) | |||||
| Current smoker | 0.980 (0.692, 1.387) | 2.110 (1.659, 2.683)*** | 2.570 (1.966, 3.360)*** | 2.311 (1.706, 3.130)*** | 0.640 (0.476, 0.863)** |
| Ex-smoker | 0.870 (0.668, 1.134) | 1.064 (0.872, 1.299) | 1.057 (0.841, 1.329) | 1.126 (0.875, 1.448) | 0.879 (0.695, 1.113) |
| Hay fever (vs. without hay fever) | 2.486 (2.030, 3.044)*** | 1.246 (1.051, 1.477)* | 1.351 (1.128, 1.618)** | 1.764 (1.449, 2.148)*** | 7.211 (6.047, 8.599)*** |
| COPD stage (vs. without COPD) | |||||
| GOLD stage 3 or 4 | 8.771 (5.604, 13.727)*** | 5.333 (3.644, 7.805)*** | 5.178 (3.572, 7.506)*** | 13.444 (9.272, 19.494)*** | 1.137 (0.719, 1.799) |
| GOLD stage 2 | 6.256 (4.063, 9.633)*** | 4.867 (3.388, 6.991)*** | 3.168 (2.179, 4.605)*** | 7.452 (5.171, 10.739)*** | 1.078 (0.664, 1.750) |
| GOLD stage 1 | 3.712 (2.282, 6.041)*** | 2.859 (1.962, 4.167)*** | 2.253 (1.532, 3.314)*** | 3.863 (2.497, 5.977)*** | 1.470 (0.894, 2.418) |
| Bronchial asthma (vs. without asthma) | 7.853 (5.777, 10.675)*** | 4.426 (3.489, 5.615)*** | 4.214 (3.258, 5.450)*** | 8.710 (6.668, 11.379)*** | 3.740 (2.885, 4.847)*** |
| Interaction (COPD*Asthma) | 0.135 (0.087, 0.211)*** | 0.293 (0.199, 0.431)*** | 0.317 (0.215, 0.468)*** | 0.135 (0.091, 0.198)*** | 0.477 (0.297, 0.764)** |
| Time spent outdoors (1-hr increments) | 0.977 (0.950, 1.005) | 0.997 (0.978, 1.016) | 1.001 (0.980, 1.023) | 1.012 (0.987, 1.037) | 0.963 (0.941, 0.985)** |
| Temperature (10°C increments) | 1.026 (0.930, 1.132) | 0.986 (0.925, 1.051) | 1.044 (0.969, 1.125) | 0.985 (0.902, 1.076) | 0.999 (0.922, 1.082) |
| Relative humidity (10% increments) | 0.998 (0.903, 1.102) | 1.122 (1.040, 1.210)** | 1.084 (0.999, 1.175) | 0.903 (0.828, 0.985)* | 0.859 (0.783, 0.944)** |
| Oxidants (10 ppb increments) | 1.094 (1.022, 1.171)** | 1.139 (1.083, 1.198)*** | 1.096 (1.038, 1.157)** | 1.022 (0.961, 1.087) | 1.057 (0.993, 1.125) |
| SPM (10 µg/m3 increments) | 1.005 (0.915, 1.104) | 1.030 (0.955, 1.112) | 1.013 (0.935, 1.097) | 0.951 (0.874, 1.035) | 1.095 (0.952, 1.260) |
| PM2.5 (10 µg/m3 increments) | 1.105 (0.921, 1.325) | 1.107 (0.960, 1.278) | 1.125 (0.964, 1.313) | 0.935 (0.800, 1.093) | 1.098 (0.929, 1.299) |
| ASD event (experienced) | 1.071 (0.864, 1.327) | 1.059 (0.889, 1.261) | 1.150 (0.963, 1.374) | 1.118 (0.917, 1.363) | 1.270 (1.041, 1.549)* |
Values are presented as odds ratio (95% confidence interval).
Odds ratios were adjusted by region of the survey, sex, age, body mass index (kg/m2), smoking status (current, ex- or never-smoker), COPD severity (GOLD stage 3 and 4, 2, 1 or 0), physician-diagnosed asthma, interaction between COPD and asthma, time spent outdoors (h), ambient temperature (°C), and relative humidity (%).
Symptom 1, weather affects a cough (negative=0; positive=1); Symptom 2, coughing up sputum when the subject does not have a cold (negative=0; positive=1); Symptom 3, coughing up sputum first thing in the morning (negative=0; positive=1); Symptom 4, frequent wheezing (negative=0; positive=1); Symptom 5, allergic symptoms (negative=0; positive=1); COPD, chronic obstructive pulmonary disease; GOLD, Global Initiative for Chronic Obstructive Lung Disease; SPM, suspended particulate matter; PM2.5, particulate matter <2.5 μm in diameter; ASD, Asian sand dust.
* p<0.05,
** p<0.01,
*** p<0.001.
| Variables | Physical fitness | Feelings | Daily activities | Social activities | Change in health | Overall health | Pain | Quality of life |
|---|---|---|---|---|---|---|---|---|
| Living in Yamaguchi area (vs. Niigata area) | 1.402 (1.159, 1.696)*** | 0.919 (0.703, 1.202) | 0.938 (0.695, 1.266) | 1.108 (0.774, 1.586) | 1.113 (0.867, 1.429) | 1.049 (0.840, 1.309) | 0.997 (0.782, 1.269) | 1.066 (0.851, 1.336) |
| Age (10-y increments) | 1.887 (1.679, 2.121)*** | 0.770 (0.649, 0.913)** | 1.148 (0.952, 1.383) | 1.137 (0.918, 1.409) | 0.854 (0.733, 0.994)* | 0.910 (0.793, 1.044) | 0.965 (0.833, 1.118) | 0.916 (0.797, 1.053) |
| Male (vs. female) | 0.467 (0.381, 0.571)*** | 0.614 (0.461, 0.819)*** | 0.716 (0.505, 1.016) | 1.230 (0.827, 1.828) | 0.767 (0.599, 0.983)* | 0.902 (0.710, 1.145) | 0.647 (0.497, 0.842)** | 0.962 (0.756, 1.223) |
| Body mass index (1 kg/m2) | 1.027 (1.002, 1.052)* | 0.990 (0.957, 1.025) | 1.005 (0.967, 1.044) | 0.962 (0.914, 1.011) | 0.985 (0.957, 1.014) | 1.005 (0.976, 1.034) | 1.041 (1.010, 1.072)** | 0.988 (0.959, 1.017) |
| Smoking status (vs. never smoker) | ||||||||
| Current smoker | 1.728 (1.335, 2.237)*** | 1.598 (1.116, 2.287)* | 1.417 (0.908, 2.211) | 1.486 (0.902, 2.450) | 0.880 (0.635, 1.221) | 0.819 (0.606, 1.108) | 1.092 (0.777, 1.536) | 0.782 (0.571, 1.072) |
| Ex-smoker | 1.402 (1.139, 1.726)** | 1.201 (0.900, 1.603) | 1.236 (0.864, 1.767) | 1.075 (0.721, 1.602) | 0.800 (0.615, 1.042) | 0.762 (0.597, 0.974)* | 1.065 (0.814, 1.393) | 0.731 (0.571, 0.935)* |
| Hay fever (vs. without hay fever) | 0.853 (0.712, 1.022) | 1.436 (1.138, 1.813)** | 1.298 (0.992, 1.697) | 1.086 (0.778, 1.515) | 1.552 (1.265, 1.906)*** | 1.413 (1.168, 1.709)*** | 1.414 (1.139, 1.754)** | 1.426 (1.171, 1.735)*** |
| COPD stage (vs. without COPD) | ||||||||
| GOLD stage 3 or 4 | 9.130 (6.129, 13.600)*** | 1.435 (0.842, 2.444) | 3.822 (2.339, 6.244)*** | 8.631 (4.966, 15.001)*** | 3.035 (1.958, 4.706)*** | 3.069 (2.046, 4.604)*** | 1.006 (0.612, 1.655) | 2.705 (1.818, 4.027)*** |
| GOLD stage 2 | 1.876 (1.329, 2.648)*** | 1.632 (0.888, 3.000) | 2.273 (1.315, 3.930)** | 2.824 (1.449, 5.504)** | 2.537 (1.622, 3.967)*** | 2.467 (1.643, 3.705)*** | 1.277 (0.791, 2.062) | 2.472 (1.611, 3.791)*** |
| GOLD stage 1 | 1.533 (1.064, 2.208)* | 1.088 (0.562, 2.105) | 1.277 (0.694, 2.350) | 1.724 (0.786, 3.781) | 1.571 (0.950, 2.600) | 1.952 (1.192, 3.197)** | 1.084 (0.614, 1.915) | 1.827 (1.067, 3.129)* |
| Bronchial asthma (vs. without asthma) | 1.149 (0.929, 1.421) | 1.727 (1.255, 2.377)*** | 1.648 (1.149, 2.363)** | 1.977 (1.297, 3.014)** | 1.953 (1.499, 2.545)*** | 1.944 (1.517, 2.491)*** | 1.585 (1.210, 2.076)*** | 2.006 (1.558, 2.584)*** |
| Interaction (COPD*Asthma) | 0.555 (0.381, 0.810)** | 0.407 (0.210, 0.787)** | 0.505 (0.283, 0.902)* | 0.437 (0.230, 0.831)* | 0.358 (0.223, 0.574)*** | 0.407 (0.263, 0.630)*** | 0.571 (0.334, 0.976)* | 0.340 (0.215, 0.539)*** |
| Time spent outdoors (1-hr increments) | 0.922 (0.899, 0.945)*** | 0.947 (0.913, 0.983)** | 0.924 (0.883, 0.966)*** | 0.843 (0.787, 0.903)*** | 1.003 (0.975, 1.032) | 0.983 (0.958, 1.009) | 0.998 (0.969, 1.027) | 0.962 (0.936, 0.989)** |
| Temperature (10°C increments) | 1.022 (0.946, 1.104) | 0.945 (0.838, 1.067) | 1.153 (0.988, 1.346) | 1.134 (0.932, 1.379) | 1.152 (1.004, 1.323)* | 1.133 (1.018, 1.261)* | 0.925 (0.832, 1.029) | 1.158 (1.032, 1.299)* |
| Relative humidity (10% increments) | 1.149 (1.059, 1.248)*** | 1.115 (0.968, 1.285) | 0.920 (0.787, 1.075) | 1.016 (0.842, 1.227) | 0.982 (0.854, 1.129) | 1.067 (0.954, 1.194) | 0.964 (0.854, 1.089) | 1.035 (0.920, 1.165) |
| Oxidants (10 ppb increments) | 1.035 (0.978, 1.095) | 1.059 (0.962, 1.165) | 1.065 (0.964, 1.178) | 1.116 (0.977, 1.275) | 1.123 (1.025, 1.232)* | 1.172 (1.085, 1.265)*** | 0.994 (0.914, 1.081) | 1.175 (1.087, 1.271)*** |
| SPM (10 µg/m3 increments) | 1.095 (1.011, 1.187)* | 1.031 (0.899, 1.183) | 1.071 (0.931, 1.233) | 0.961 (0.783, 1.178) | 1.074 (0.950, 1.213) | 1.046 (0.944, 1.158) | 1.057 (0.951, 1.174) | 1.145 (1.030, 1.273)* |
| PM2.5 (10 µg/m3 increments) | 1.217 (1.047, 1.415)* | 0.940 (0.726, 1.216) | 0.935 (0.711, 1.228) | 0.904 (0.623, 1.312) | 1.062 (0.839, 1.345) | 1.082 (0.896, 1.308) | 0.939 (0.759, 1.161) | 1.133 (0.938, 1.369) |
| ASD event (experienced) | 1.058 (0.879, 1.273) | 1.086 (0.794, 1.485) | 1.081 (0.792, 1.476) | 1.335 (0.907, 1.965) | 1.384 (1.062, 1.803)* | 1.217 (0.966, 1.534) | 1.005 (0.776, 1.300) | 1.424 (1.127, 1.800)** |
Values are presented as odds ratio (95% confidence interval).
Odds ratios were adjusted by region of the survey, sex, age, body mass index (kg/m2), smoking status (current, ex-, or never-smoker), COPD severity (GOLD stage 3 and 4, 2, 1, or 0), physician-diagnosed asthma, interaction between COPD and asthma, time spent outdoors (h), ambient temperature (°C), and relative humidity (%).
COPD, chronic obstructive pulmonary disease; GOLD, Global Initiative for Chronic Obstructive Lung Disease; SPM, suspended particulate matter; PM2.5, particulate matter <2.5 μm in diameter; ASD, Asian sand dust.
1 The Dartmouth COOP Functional Health Assessment Charts/World Organization of Family Doctors chart scores were coded as dependent variables (0=better scores [1-3 points]; 1=worse scores [4-5 points]).
* p<0.05,
** p<0.01,
*** p<0.001.
- 1. Global Initiative for Chronic Obstructive Lung Disease. Global strategy for the diagnosis, management, and prevention of chronic obstructive pulmonary disease (2019 report). [cited 2019 Nov 10]. Available from: https://goldcopd.org/wp-content/uploads/2018/11/GOLD-2019-v1.7-FINAL-14Nov2018-WMS.pdf
- 2. World Health Organization. The top 10 causes of death. 2018 [cited 2018 Dec 5]. Available from: https://www.who.int/news-room/fact-sheets/detail/the-top-10-causes-of-death
- 3. Murray CJ, Vos T, Lozano R, Naghavi M, Flaxman AD, Michaud C, et al. Disability-adjusted life years (DALYs) for 291 diseases and injuries in 21 regions, 1990-2010: a systematic analysis for the Global Burden of Disease Study 2010. Lancet 2012;380(9859):2197-2223ArticlePubMed
- 4. Mannino DM, Buist AS. Global burden of COPD: risk factors, prevalence, and future trends. Lancet 2007;370(9589):765-773ArticlePubMed
- 5. Rabe KF, Hurd S, Anzueto A, Barnes PJ, Buist SA, Calverley P, et al. Global strategy for the diagnosis, management, and prevention of chronic obstructive pulmonary disease: GOLD executive summary. Am J Respir Crit Care Med 2007;176(6):532-555ArticlePubMed
- 6. López-Campos JL, Tan W, Soriano JB. Global burden of COPD. Respirology 2016;21(1):14-23ArticlePubMed
- 7. Salvi SS, Barnes PJ. Chronic obstructive pulmonary disease in non-smokers. Lancet 2009;374(9691):733-743ArticlePubMed
- 8. Sunyer J. Urban air pollution and chronic obstructive pulmonary disease: a review. Eur Respir J 2001;17(5):1024-1033ArticlePubMed
- 9. Arbex MA, de Souza Conceição GM, Cendon SP, Arbex FF, Lopes AC, Moysés EP, et al. Urban air pollution and chronic obstructive pulmonary disease-related emergency department visits. J Epidemiol Community Health 2009;63(10):777-783ArticlePubMed
- 10. Shima M. Health effects of air pollution: a historical review and present status. Nihon Eiseigaku Zasshi 2017;72(3):159-165ArticlePubMed
- 11. World Health Organization. Country profile of environmental burden of disease: China. [cited 2017 Nov 11]. Available from: https://www.who.int/quantifying_ehimpacts/national/countryprofile/china.pdf?ua%20=1
- 12. Jin Y, Andersson H, Zhang S. Air pollution control policies in China: a retrospective and prospects. Int J Environ Res Public Health 2016;13(12):1219ArticlePubMedPMC
- 13. He MZ, Zeng X, Zhang K, Kinney PL. Fine particulate matter concentrations in urban Chinese cities, 2005-2016: a systematic review. Int J Environ Res Public Health 2017;14(2):191ArticlePubMedPMC
- 14. Sato K, Takami A, Irei S, Miyoshi T, Ogawa Y, Yoshino A, et al. Transported and local organic aerosols over Fukuoka, Japan. Aerosol Air Qual Res 2013;13: 1263-1272ArticlePDF
- 15. Moreno T, Kojima T, Querol X, Alastuey A, Amato F, Gibbons W. Natural versus anthropogenic inhalable aerosol chemistry of transboundary East Asian atmospheric outflows into western Japan. Sci Total Environ 2012;424: 182-192ArticlePubMed
- 16. Uno I, Amano H, Emori S, Kinoshita K, Matsui I, et al. Trans‐Pacific yellow sand transport observed in April 1998: a numerical simulation. J Geophys Res Atmos 2001;106(D16):18331-18344ArticlePDF
- 17. Coulibaly S, Minami H, Abe M, Hasei T, Oro T, Funasaka K, et al. Long-range transport of mutagens and other air pollutants from mainland East Asia to western Japan. Genes Environ 2015;37: 25ArticlePubMedPMC
- 18. Mori I, Nishikawa M, Tanimura T, Quan H. Change in size distribution and chemical composition of Kosa (Asian dust) aerosol during long-range transport. Atmos Environ 2003;37(30):4253-4263Article
- 19. Van Weel C. Functional status in primary care: COOP/WONCA charts. Disabil Rehabil 1993;15(2):96-101ArticlePubMed
- 20. Ministry of the Environment. Environmental quality standards in Japan: air quality. [cited 2018 Jun 12]. Available from: http://www.env.go.jp/en/air/aq/aq.html
- 21. Zeger SL, Liang KY. Longitudinal data analysis for discrete and continuous outcomes. Biometrics 1986;42(1):121-130ArticlePubMed
- 22. Yamazaki S, Shima M, Yoda Y, Oka K, Kurosaka F, Shimizu S, et al. Association between PM2.5 and primary care visits due to asthma attack in Japan: relation to Beijing’s air pollution episode in January 2013. Environ Health Prev Med 2014;19(2):172-176ArticlePubMedPDF
- 23. Inomata Y, Kajino M, Sato K, Ohara T, Kurokawa J, Ueda H, et al. Emission and atmospheric transport of particulate PAHs in Northeast Asia. Environ Sci Technol 2012;46(9):4941-4949ArticlePubMed
- 24. Japan Meteorological Agency. Long-term trends of Aeolian dust. [cited 2018 Dec 18]. Available from: http://www.data.jma.go.jp/gmd/env/kosahp/en/kosa_shindan_e.html
- 25. Pope CA 3rd. Epidemiology of fine particulate air pollution and human health: biologic mechanisms and who’s at risk? Environ Health Perspect 2000;108 Suppl 4: 713-723ArticlePubMed
- 26. Atkinson RW, Kang S, Anderson HR, Mills IC, Walton HA. Epidemiological time series studies of PM2.5 and daily mortality and hospital admissions: a systematic review and meta-analysis. Thorax 2014;69(7):660-665ArticlePubMedPMC
- 27. Claeson AS, Palmquist E, Lind N, Nordin S. Symptom-trigger factors other than allergens in asthma and allergy. Int J Environ Health Res 2016;26(4):448-457ArticlePubMed
- 28. Samet J, Buist S, Bascom R, Garcia J, Lipsett M, Mauderly J, et al. What constitutes an adverse health effect of air pollution? Official statement of the American Thoracic Society. Am J Respir Crit Care Med 2000;161(2I):665-673ArticlePubMed
- 29. Nuvolone D, Petri D, Voller F. The effects of ozone on human health. Environ Sci Pollut Res Int 2018;25(9):8074-8088ArticlePubMedPDF
- 30. Bell ML, Dominici F, Samet JM. A meta-analysis of time-series studies of ozone and mortality with comparison to the national morbidity, mortality, and air pollution study. Epidemiology 2005;16(4):436-445ArticlePubMedPMC
- 31. World Health Organization. Air quality guidelines global update 2005: particulate matter, ozone, nitrogen dioxide and sulfur dioxide. 2006 [cited 2017 Dec 18]. Available from: http://www.euro.who.int/__data/assets/pdf_file/0005/78638/E90038.pdf
- 32. Horstman DH, Folinsbee LJ, Ives PJ, Abdul-Salaam S, McDonnell WF. Ozone concentration and pulmonary response relationships for 6.6-hour exposures with five hours of moderate exercise to 0.08, 0.10, and 0.12 ppm. Am Rev Respir Dis 1990;142(5):1158-1163ArticlePubMed
- 33. Health Effects Institute. Special report: revised analyses of time-series studies of air pollution and health. 2003 [cited 2019 Nov 10]. Available from: https://www.healtheffects.org/system/files/TimeSeries.pdf
- 34. Kashima S, Yorifuji T, Tsuda T, Eboshida A. Asian dust and daily all-cause or cause-specific mortality in western Japan. Occup Environ Med 2012;69(12):908-915ArticlePubMed
- 35. Matsukawa R, Michikawa T, Ueda K, Nitta H, Kawasaki T, Tashiro H, et al. Desert dust is a risk factor for the incidence of acute myocardial infarction in Western Japan. Circ Cardiovasc Qual Outcomes 2014;7(5):743-748ArticlePubMed
- 36. Kamouchi M, Ueda K, Ago T, Nitta H, Kitazono T; Fukuoka Stroke Registry Investigators. Relationship between asian dust and ischemic stroke: a time-stratified case-crossover study. Stroke 2012;43(11):3085-3087ArticlePubMed
- 37. Yamazaki S, Nitta H, Murakami Y, Fukuhara S. Association between ambient air pollution and health-related quality of life in Japan: ecological study. Int J Environ Health Res 2005;15(5):383-391ArticlePubMed
- 38. Yamazaki S, Nitta H, Fukuhara S. Associations between exposure to ambient photochemical oxidants and the vitality or mental health domain of the health related quality of life. J Epidemiol Community Health 2006;60(2):173-179ArticlePubMedPMC
REFERENCES
Figure & Data
References
Citations
- Loranthus tanakae Franch. and Sav. Attenuates Respiratory Inflammation Caused by Asian Sand Dust
Se-Jin Lee, So-Won Pak, A Yeong Lee, Woong-Il Kim, Sung-Wook Chae, Young-Kwon Cho, Je-Won Ko, Tae-Won Kim, Jong-Choon Kim, Byeong Cheol Moon, Yun-Soo Seo, In-Sik Shin
Antioxidants.2024; 13(4): 419. CrossRef - Evaluation of the impact of energy utilization and PM on respiratory health in China
Changfeng Shi, Xinhui Liu, Min Gu, Qinghua Pang, Zhen Shi
Energy & Environment.2021; 32(3): 380. CrossRef - Respiratory Effects of Exposure to Traffic-Related Air Pollutants During Exercise
Giuseppe Morici, Fabio Cibella, Annalisa Cogo, Paolo Palange, Maria R. Bonsignore
Frontiers in Public Health.2020;[Epub] CrossRef
 PubReader
 ePub Link
 Cite
Cite


