
Articles
- Page Path
- HOME > J Prev Med Public Health > Volume 53(1); 2020 > Article
-
Original Article
Comparison of Trends in Blood Pressure and the Prevalence of Obesity Among Korean and American Adolescents: A 12-Years Cross-sectional Study -
Somi Heo1
 , Seyoung Kwon2, Yu-Mi Lee1, Ji-Yeon Shin1, Duk-Hee Lee1
 -
Journal of Preventive Medicine and Public Health 2020;53(1):45-55.
DOI: https://doi.org/10.3961/jpmph.19.198
Published online: November 20, 2019
1Department of Preventive Medicine, Kyungpook National University School of Medicine, Daegu, Korea
2Department of Public Health, Graduate School of Kyungpook National University, Daegu, Korea
- Corresponding author: Duk-Hee Lee, MD, PhD Department of Preventive Medicine, Kyungpook National University School of Medicine, 680 Gukchaebosang-ro, Jung-gu, Daegu 41944, Korea E-mail: lee_dh@knu.ac.kr
Copyright © 2020 The Korean Society for Preventive Medicine
This is an Open Access article distributed under the terms of the Creative Commons Attribution Non-Commercial License (http://creativecommons.org/licenses/by-nc/4.0/) which permits unrestricted non-commercial use, distribution, and reproduction in any medium, provided the original work is properly cited.
ABSTRACT
-
Objectives
- This study was conducted to explore recent trends in the prevalence of pediatric elevated blood pressure and hypertension (HTN) in Korea and the United States, applying the new HTN reference values for adolescents.
-
Methods
- This study analyzed 17 339 (8755 Korean and 8584 American) adolescents aged 10 to 17 who participated in the Korea National Health and Nutrition Examination Survey and the National Health and Nutrition Examination Survey, respectively, between 2005 and 2016. HTN was defined using percentile-based reference values for non-overweight adolescents from 7 nations, and obesity was defined by body mass index (BMI) based on country-specific growth charts. All analyses were stratified by sex and year-over-year changes were evaluated by calculating the p for trend.
-
Results
- Systolic blood pressure showed a statistically meaningful upward trend in Korean boys and girls, while diastolic blood pressure did not show any significant changes. Both systolic and diastolic blood pressure levels declined among United States boys and girls. The prevalence of elevated blood pressure and HTN remained similar in Korean adolescents, but declined in both sexes among United States adolescents. BMI increased in both sexes among Korean adolescents, although the overweight and obesity rates stayed the same. No significant trends were found in any obesity indices among United States adolescents. The prevalence of elevated blood pressure and HTN by obesity level was higher among Korean adolescents than among their United States peers in both sexes, and the gap became higher at more severe levels of obesity.
-
Conclusions
- Despite the strong correlation between obesity and HTN, recent trends in the prevalence of HTN and obesity among Korean and United States adolescents were strikingly different. Follow-up studies are necessary to determine why the prevalence of HTN was more than twice as high among Korean adolescents than among their United States counterparts.
- Cardiovascular disease is a major cause of death in many countries around the world [1], and hypertension (HTN) is a well-known risk factor for cardiovascular disease [2]. HTN is a chronic condition that is more commonly found in adults, but in recent years has been increasingly reported in children and adolescents [3,4]. Those who develop HTN during childhood or adolescence are likely to continue to have the same condition in adulthood [5,6], underscoring the importance of the early diagnosis and management of HTN during childhood.
- The risk factors known to be associated with pediatric HTN include sex, race, family history, low birth weight, obesity, dietary habits, and physical activity [7]. Of these risk factors, obesity has been suggested to be the largest contributor to pediatric HTN, as obese children are at a two-fold higher risk of developing HTN compared to normal-weight children [8].
- While adolescent obesity has consistently increased in most countries over the past couple of decades [9], blood pressure (BP) trends have been distinct in each country. In some countries, the prevalence of HTN has declined even while obesity became more common [10,11], a trend that was also reported in a Korean pediatric study. According to a study conducted by Xi et al. [12], HTN cases among Korean adolescents significantly decreased between 1997 and 2012, even though the obesity rate increased over the same period, which is surprising considering the strong correlation between obesity and HTN in pediatric patients.
- The diagnostic reference values for pediatric HTN have traditionally been based on BP percentiles of children and adolescents in certain age groups, regardless of their obesity level. These reference values therefore include both overweight/obese and normal-weight individuals. As a result, the threshold for HTN tends to increase when overweight/obesity rates go up, which disguises the true prevalence of HTN and makes it seem lower than it is. Considering this issue, the new pediatric HTN guidelines in 2017 [13] suggested new normative pediatric BP tables based on normal-weight children without including overweight and obese children. Percentile-based references for normal-weight children and adolescents in 7 countries, including Korea, have also been suggested to facilitate comparisons among nations [14].
- This study was conducted to explore trends in the prevalence in pediatric elevated blood pressure (EBP) and HTN in Korea and the United States by analyzing Korean National Health and Nutrition Examination Survey (KNHANES) and National Health and Nutrition Examination Survey (NHANES) data using percentile-based reference values for normal-weight children and adolescents from 7 countries [14].
INTRODUCTION
- Subjects
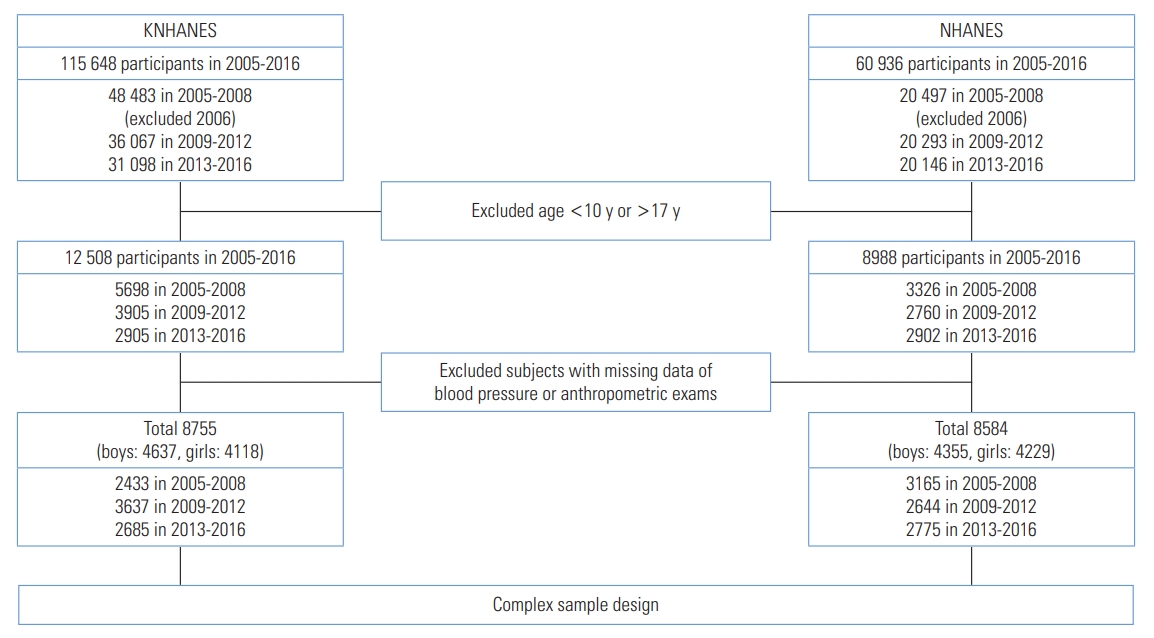
- This study was conducted using data from adolescents aged 10 to 17 who participated in the KNHANES and NHANES between 2005 and 2016. A total of 8755 Korean subjects, including 4637 males and 4118 females, were selected out of the 12 508 KNHANES participants in the relevant age range, after the exclusion of 3753 individuals with missing BP, height, or weight data. For the United States subjects, a total of 8584 adolescents, including 4355 males and 4229 females, were selected from the 8988 NHANES participants in the relevant age range, after the exclusion of 404 individuals. Participants in the 2006 KNHANES were excluded due to missing survey data (Figure 1).
- Anthropometric Measurements and Definition of Obesity
- Anthropometric measurements were carried out by skilled researchers. For the height measurements, participants stepped on a stadiometer, stood straight, and looked forward. Weight was measured by having participants step onto a scale and stand still, after calibration. Height and weight were each measured once, and body mass index (BMI) was calculated using the measured values dividing weight (kg) by height squared (m2). Obesity was defined by a BMI in the 95th percentile or higher based on the sex- and age-specific growth charts of each country (2007 Korean National Growth Charts for Korea [15], Centers for Disease Control and Prevention growth charts; United States, 2000 [16]), overweight was defined as a BMI between the 85th percentile and 95th percentile, and normal weight as a BMI below the 85th percentile.
- Blood Pressure Measurements and Definition of Hypertension
- Skilled measurers measured BP using a standard mercury sphygmomanometer following standardized guidelines [17]. An appropriate cuff size was selected based on the circumference of the upper arm of the subjects. BP was measured with participants seated, after 5 minutes of rest. Systolic blood pressure (SBP) was defined as Korotkoff phase 1, and diastolic blood pressure (DBP) was defined as Korotkoff phase 5. BP was measured 3 times in total, and the average of the second and third measurements was used as the final value.
- Prior to 2005, KNHANES determined the final BP values by averaging 2 BP measurements, and then switched to averaging the second and third of 3 measurements until 2016, when this study ended. The measurement environment has changed since 2007 depending on the year, equipment, and height of the measuring stand, but adjusted standards were subsequently presented considering potential errors due to such differences. The adjusted values were used in this study to minimize the potential of serious errors occurring due to variations in the measurement environment.
- HTN was defined in accordance to the percentile reference for non-overweight adolescents from 7 nations, including Korea [14]. The term “preHTN” was replaced with the term “EBP” pursuant to the 2017 American Academy of Pediatrics (AAP) guidelines [13]. Normal BP, EBP, and HTN were defined based on percentiles by sex, age, and BP by height.
- (1) Normal BP: Both SBP and DBP less than the 90th percentile
- (2) EBP: SBP or DBP between the 90th and 95th percentiles
- (3) HTN: SBP or DBP in the 95th percentile or higher
- Statistical Analysis
- For the analysis, the 12-year (2005-2016) data from both Korea and the United States were grouped into 3 sets of 4-year data (2005-2008, 2009-2012, and 2013-2016). For the Korean data, the 2005, 2007, and 2008 data were combined into a single set due to the absence of the 2006 data. A multistage analysis was carried out for sex utilizing a complex sample design reflecting multistage, stratified, and weighted values. Weighted values for each merged dataset were calculated when merging the yearly data. The prevalence of obesity and HTN was presented as percentages, while arithmetic averages were calculated for other variables. When comparing general characteristics between Korean and United States adolescents, the independent t-test was used for continuous variables and the chi-square test was used for categorical variables. Year-over-year trends for the 3 sets of 4-year data were analyzed using the p for trend. Statistical significance was defined as p-value<0.05, and SAS version 9.4 (SAS Institute Inc., Cary, NC, USA) was used for the analysis.
- Ethics Statement
- This study is not subject to ethical review as it is conducted using public data of KNHANES in Korea and NHANES data in the United States.
METHODS
- General Characteristics of the Subjects
- The general characteristics of all Korean and United States subjects of this study are presented in Table 1 by sex. Height was similar among boys in both countries, while United States girls were taller than their Korean counterparts. The 12-year average values for weight, BMI, and rates of overweight and obesity were all meaningfully higher among United States adolescents than among their Korean counterparts. The obesity rates for United States adolescents were 20.6% for boys and 18.7% for girls, 2.5 times to 3.0 times higher than the Korean obesity rates of 7.1% and 7.5%. BP–related indices showed that DBP and the prevalence of EBP and HTN were higher among Korean adolescents, while only SBP was higher among United States male and female adolescents (Table 1).
- Trends in the Prevalence of Blood Pressure and Hypertension
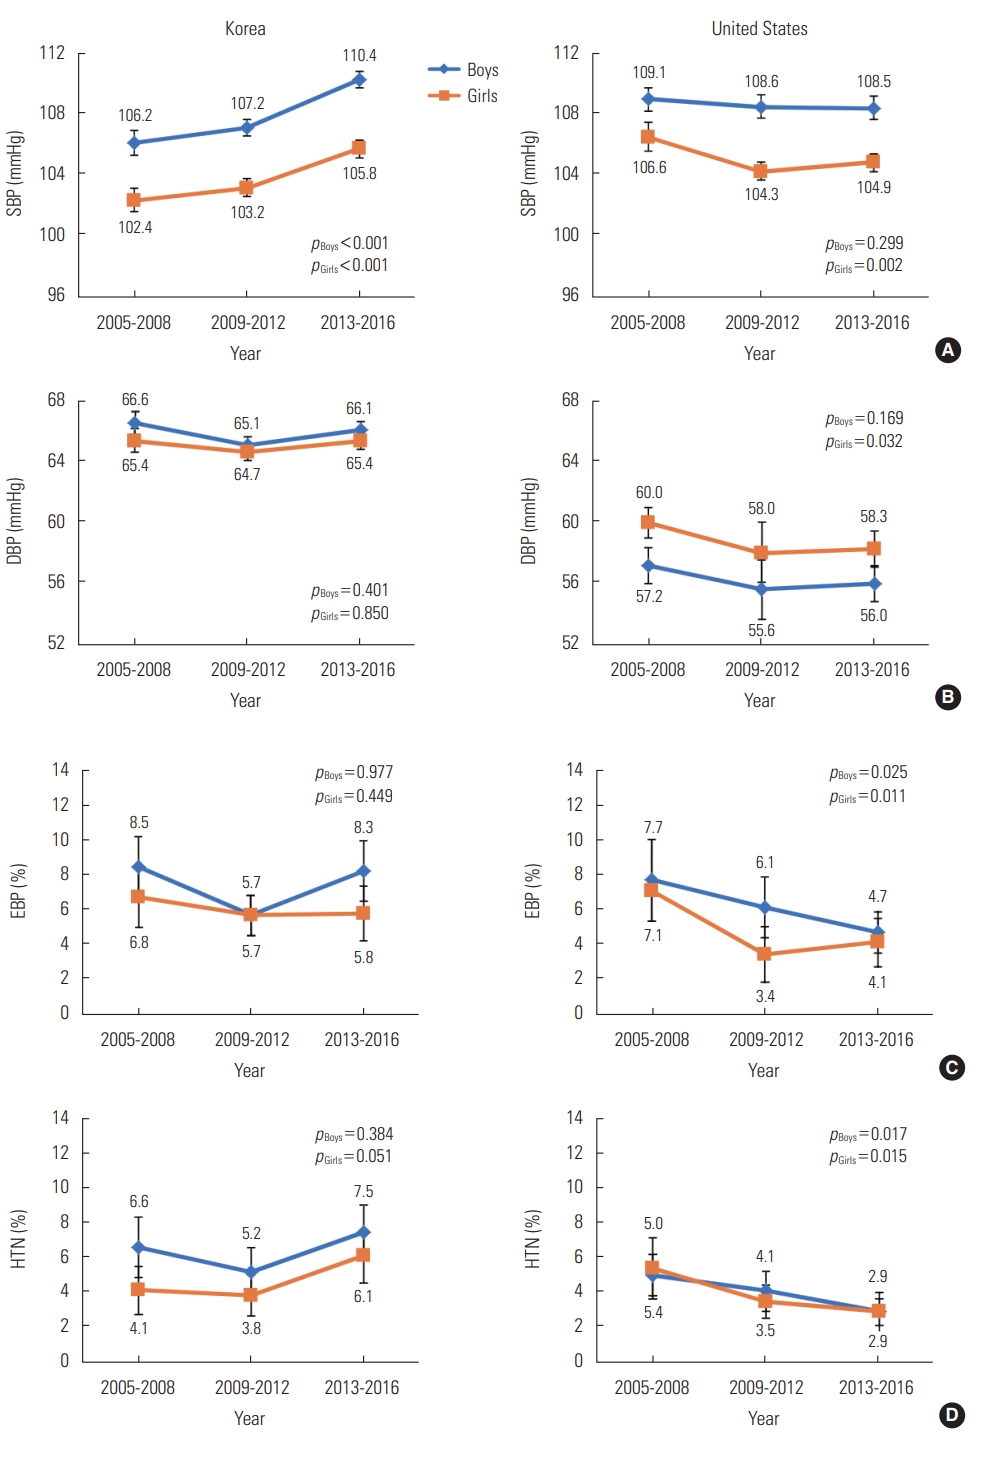
- Figure 2 illustrates the 12-year trends of SBP, DBP, and the prevalence of EBP and HTN. SBP showed statistically meaningful upward trends in Korean boys and girls (p for trend <0.001 for both males and females), while United States female adolescents showed a significantly declining trend (p for trend=0.002) and a slight decrease was observed among United States male adolescents, but was not statistically meaningful (Figure 2A). The only statistically meaningful change in DBP was a decrease among United States female adolescents (p trend=0.032) (Figure 2B).
- The prevalence of EBP did not demonstrate significant changes in either male or female Korean subjects, although it meaningfully decreased among United States subjects of both sexes (p for trend=0.025, p for trend=0.011 in males and females, respectively). The prevalence of EBP among Korean adolescents between 2013-2016 was 8.3% among boys and 5.8% among girls, 1.4 times to 1.8 times higher than the rates of 4.7% and 4.1% among United States adolescents (Figure 2C). The prevalence of HTN showed similar trends as that of EBP, with no significant change in Korean subjects of both sexes, whereas HTN decreased with statistical significance in both United States male and female subjects (p for trend=0.017, p for trend=0.015 in males and females, respectively). The prevalence of HTN was consistently higher among Korean subjects over the entire study period, except for the 2005-2008 Korean female data. The prevalence of HTN among Korean adolescents was 7.5% for boys and 6.1% for girls between 2013 and 2016, 2 times to 2.5 times higher than that of United States adolescents (2.9% and 2.9% for each sex) (Figure 2D).
- Trends in Body Mass Index and Overweight/Obesity Rates
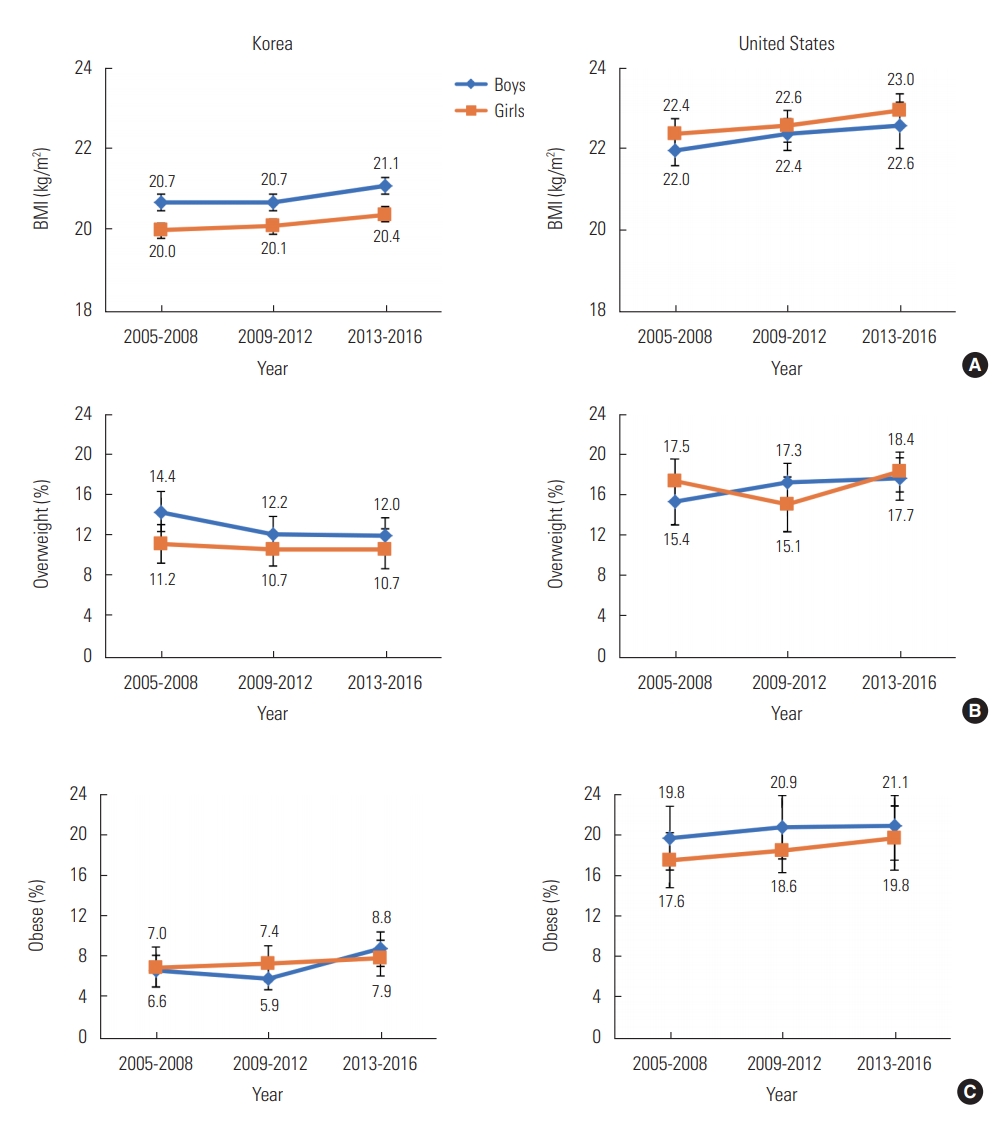
- Figure 3 illustrates the 12-year trends in BMI and overweight/obesity rates among Korean and United States adolescents. BMI values showed statistically significant upward trends in Korean male and female subjects (p for trend=0.038, p for trend=0.019 in males and females), while United States male and female subjects did not show clear trends (Figure 3A). The absolute magnitude of the increase in BMI values was higher among United States subjects in both sexes, but the changes were not found to be statistically significant because the standard error was higher in the United States subjects. Although this information is not included in Figure 3A, the standard error of BMI for Korean adolescents was approximately 0.1 for both sexes for all 3 periods of data, versus 0.2 and 0.3 in the United States subjects. Meanwhile, the prevalence of overweight and obesity did not change significantly in either country (Figure 3B and 3C).
- Prevalence of Elevated Blood Pressure and Hypertension by Obesity Level
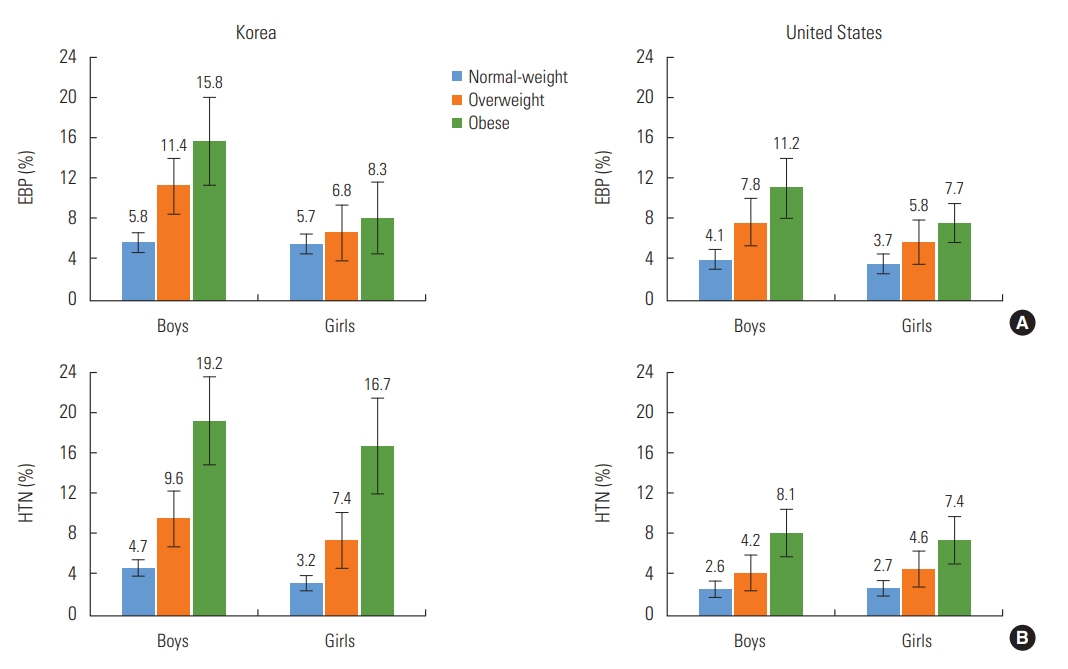
- Figure 4 demonstrates the prevalence of EBP and HTN among all subjects divided into normal-weight, overweight, and obese groups. The prevalence of EBP and HTN increased as obesity became more severe, from the normal-weight group to the overweight group and the obese group. EBP and HTN were more common in Korea in all 3 groups. However, the discrepancy became larger as the level of obesity became more severe. For instance, in the normal-weight subjects, HTN was found in 4.7% and 2.6% of the male Korean and United States subjects, respectively, and in 3.2% and 2.7% of the female Korean and United States subjects, respectively, while the corresponding figures were 9.6% and 4.2% for males and 7.4% and 4.6% for females in the overweight group and 19.2% and 8.1% for males and 16.7% and 7.4% for females in the obese group, respectively.
RESULTS
- This study compared trends in BP and obesity rates between 2005 and 2016 among Korean and United States adolescents based on large-scale representative data from each country. SBP levels were similar in both countries, unlike DBP, which was strikingly distinct. For instance, the DBP of Korean adolescents was 8-10 mmHg higher than that of their United States peers. Similarly high DBP values among Korean adolescents have been reported in previous studies [14,18], and analogous results have been reported for other East Asian countries, particularly China [12]. The present study found that EBP and HTN were more commonly found among Korean adolescents, although their SBP tended to be lower, which was likely caused by the higher DBP among Korean adolescents. Studies on adult subjects have also shown higher DBP values among Koreans than among Americans, and only slightly lower SBP values among Koreans [19, 20].
- SBP showed a significant increase over the period analyzed in the study among Korean adolescents of both sexes, while DBP remained steady over the same period. In contrast, both SBP and DBP decreased in United States adolescents, especially among girls. This trend is somewhat different from the results of previous studies, including that of Xi et al. [12], who suggested a downward trend in both SBP and DBP in both Korean boys and girls between 1997 and 2012 [12]. This inconsistency may result from the mismatch in the periods when the studies were conducted. In the study of Xi et al. [12], SBP was highest among Korean adolescents between 1997 and 2000, the earliest period analyzed in their study, and then continued to decrease from 1997 to 2008, before starting to increase again in 2008. Meanwhile, in other East Asian countries, especially China, SBP and DBP in boys increased between 1997 and 2012, while girls did not experience any significant changes [12]. Over the same period, Japanese boys and girls exhibited declining SBP and DBP [10,21], reflecting inconsistent BP trends among East Asian nations.
- When EBP and HTN were calculated among the Korean and United States subjects using the international references based on 7 nations [14], both conditions were more prevalent in Korean adolescents of both sexes. However, these results cannot be directly compared with those of previous studies due to changes in the definition of HTN. For example, many of the previously conducted studies on the prevalence of pediatric HTN [4,22] were based on the 2004 Fourth Report on the Diagnosis, Evaluation, and Treatment of High Blood Pressure in Children and Adolescents [23], which suggested BP percentile charts based on the physical development of United States children and adolescents, which may be inappropriate to apply directly to their peers in other countries. Given such limitations, several countries, including Korea, developed their own percentile-based reference values for BP [24,25] based on the physical development of children and adolescents in each nation [26].
- In the updated 2017 AAP guidelines [13], a new percentile chart for BP was suggested that took into account the correlation between obesity and HTN by only including normal-weight United States children and adolescents, and not overweight and obese children and adolescents. The new guideline helped resolve the issue of instability in the definition of HTN depending on the obesity rate, but was still inappropriate to apply to children and adolescents outside of the United States. Subsequently, in 2018, international BP references based on non-overweight children and adolescents from 7 select nations, including Korea and the United States, were released [14]; these values were utilized in this study to evaluate the prevalence of EBP and HTN.
- The inconsistent percentile-based reference values for HTN led to varying results in comparisons of the prevalence of HTN among Korean and United States children over the same period. This study used reference values based on only non-overweight children and adolescents, leading to the expectation that the results would show a higher prevalence than reported previously. The study of Xi et al. [12] based on the 2004 Fourth Report [23] concluded that HTN was present in 3.1% of boys and 2.1% of girls between 2009 and 2010 and 4.2% and 3.1% of boys and girls, respectively, between 2011 and 2012, while the figures were higher in this study, at 5.2% and 3.8%, respectively. United States children and adolescents showed similar trends, with figures of 1.7% and 1.5% for boys and girls, respectively, between 2009 and 2010, and 2.2% and 1.3%, respectively, between 2011 and 2012 when the 2004 Fourth Report criteria were applied [23], while higher values (4.1% and 3.5% for boys and girls, respectively) were found between 2009 and 2012 in this study.
- During the period of this study, the prevalence of EBP and HTN among Korean subjects did not show meaningful upward or downward trends. The stagnant prevalence of HTN despite the meaningful increase in SBP over the same period is probably because the magnitude of the increase was not high enough to affect the overall prevalence of HTN. If the upward trend of SBP continues, more cases of EBP or HTN will likely occur. Recent studies of Korean children and adolescents have reported fewer cases of HTN in Korea [12,27], which can be interpreted as a result of using BP reference values that included those obtained from overweight and obese children and adolescents. In China, the prevalence of HTN did not show significant changes between 1997 and 2012 when the United States 2004 Fourth Report criteria [23] were applied by Xi et al. [12], but meaningfully increased when a different set of reference values was applied [24]. In contrast, the United States subjects showed meaningful decreases in EBP and HTN in both sexes. This result is consistent with the observed downward trend in SBP and DBP, as well as the results of previous studies reporting a decreasing trend in the prevalence of HTN [22,28] and the results of this study.
- Meanwhile, a factor that might explain the upward trend in SBP among Korean children and adolescents is the age distribution of subjects, which has changed over time. During the entire period of the study, the proportion of the 13-17 age group increased from 54.7% (male) and 55.1% (female) of the population to 59.7% (male) and 63.0% (female) in Korea, whereas in the United States, the proportion of that age group decreased from 63.6% (male) and 64.5% (female) to 59.3% (male) and 58.6% (female) (Supplemental Material 1). This difference in the age distribution may have contributed to the conflicting trends in SBP between Korean and United States subjects.
- Unlike BP, obesity-related indices including BMI, the overweight rate, and the obesity rate were all higher among United States subjects than among their Korean counterparts. In particular, the obesity rates of the United States subjects were 2.5 times to 3.0 times higher than those of the Korean subjects. Interestingly, HTN was more common among Korean adolescents in the normal-weight, overweight, and obese groups, and the Korean overweight and obese groups were twice or more likely to have developed HTN. This result implies that obesity potentially plays a more significant role in adolescent obesity in Korea than in the United States, although this possibility remains to be proven in follow-up studies.
- Korean adolescents showed a slight increase in their BMI, while maintaining stable overweight and obesity rates. When comparing these results with the trends in BP indices, BMI and SBP moved hand-in-hand, showing similar patterns in Korean adolescents. In contrast, obesity and BP showed distinct patterns in United States adolescents, as obesity levels remained stable while BP indices decreased. Previous studies have suggested similar patterns, as the obesity rate increased between 2001 and 2012 [29], while HTN became less common [28] over the same period in United States adolescents. The root causes of such results have yet to be determined, but a potential factor could be changes in diet. A study on the dietary habits of American adolescents between 1999 and 2012 suggested a lower intake of calories and a higher proportion of unsaturated fatty acid intake to saturated fatty acid intake [30]. Saturated and unsaturated fatty acids are known to have opposite effects on BP and arteriosclerosis [31], so a relatively higher intake of unsaturated fatty acids could have contributed to the lower rate of HTN by improving arteriosclerosis and preventing increases in BP levels. Another study conducted from 2001 to 2009 found that United States adolescents were drinking less soda [32], which potentially contributed to a lower prevalence of HTN based on studies demonstrating a correlation between sugar intake and higher BP, regardless of obesity. Future studies will be necessary, as many other factors are known to affect the risk of pediatric HTN [7].
- The limitations of this study are as follows. First, this study focused on trends in overweight and obesity rates and BP over 12 years, but it would have been preferable to include even longer-term data. This study focused on the most recent 12 years because it was difficult to directly compare data before 2005, because the NHANES was carried out as an annual survey starting in 1999, whereas the KNHANES became an annual survey in 2005. Second, there is a possibility that the measurements of BP were incorrect, although measurements were carried out in accordance to standard guidelines. For instance, environmental differences in physical measurements between the 2 nations may have caused errors in physical measurements, including those of BP. The KNHANES also suggested the possibility of measurement errors between July 2008 and December 2010 and presented revised values in the recommendations for determining BP in humans using sphygmomanometers from the American Heart Association [33]. Third, restricted access to information on risk factors and the cross-sectional study design limit the ability to infer conclusions regarding the direct association between obesity and HTN. Despite such limitations, this study is meaningful in that it compared Korean and United States adolescents using reference values based on non-overweight children and adolescents from 7 countries.
- In conclusion, the trends in the prevalence of HTN and obesity showed largely different trajectories in Korean and United States adolescents despite the strong correlation between obesity and HTN. Follow-up studies are needed to explain the causes of these discrepancies. Above all, since HTN is much more common in obese children and adolescents, weight control is necessary to manage HTN.
DISCUSSION
SUPPLEMENTAL MATERIALS
Supplemental Material 1.
-
CONFLICT OF INTEREST
The authors have no conflicts of interest associated with the material presented in this paper.
-
FUNDING
None.
Notes
ACKNOWLEDGEMENTS
-
AUTHOR CONTRIBUTIONS
Conceptualization: SH, DHL. Data curation: SH, SK. Formal analysis: SH, SK. Methodology: DHL, YML, JYS. Visualization: SH, SK. Writing - original draft: SH. Writing - review & editing: DHL, YML, JYS, SK.
Notes
- 1. Beaglehole R, Horton R. Chronic diseases: global action must match global evidence. Lancet 2010;376(9753):1619-1621ArticlePubMed
- 2. Lewington S, Clarke R, Qizilbash N, Peto R, Collins R; Prospective Studies Collaboration. Age-specific relevance of usual blood pressure to vascular mortality: a meta-analysis of individual data for one million adults in 61 prospective studies. Lancet 2002;360(9349):1903-1913ArticlePubMed
- 3. Kollias A, Antonodimitrakis P, Grammatikos E, Chatziantonakis N, Grammatikos EE, Stergiou GS. Trends in high blood pressure prevalence in Greek adolescents. J Hum Hypertens 2009;23(6):385-390ArticlePubMedPDF
- 4. Yan W, Li X, Zhang Y, Niu D, Mu K, Ye Y, et al. Reevaluate secular trends of body size measurements and prevalence of hypertension among Chinese children and adolescents in past two decades. J Hypertens 2016;34(12):2337-2343ArticlePubMed
- 5. Raitakari OT, Juonala M, Kähönen M, Taittonen L, Laitinen T, Mäki-Torkko N, et al. Cardiovascular risk factors in childhood and carotid artery intima-media thickness in adulthood: the Cardiovascular Risk in Young Finns Study. JAMA 2003;290(17):2277-2283ArticlePubMedPDF
- 6. Barker DJ, Bagby SP, Hanson MA. Mechanisms of disease: in utero programming in the pathogenesis of hypertension. Nat Clin Pract Nephrol 2006;2(12):700-707ArticlePubMedPDF
- 7. Ewald DR, Haldeman LA. Risk factors in adolescent hypertension. Glob Pediatr Health 2016;3: 2333794X15625159ArticlePubMedPMC
- 8. Willig AL, Casazza K, Dulin-Keita A, Franklin FA, Amaya M, Fernandez JR. Adjusting adiposity and body weight measurements for height alters the relationship with blood pressure in children. Am J Hypertens 2010;23(8):904-910ArticlePubMedPMCPDF
- 9. NCD Risk Factor Collaboration (NCD-RisC). Worldwide trends in body-mass index, underweight, overweight, and obesity from 1975 to 2016: a pooled analysis of 2416 population-based measurement studies in 128·9 million children, adolescents, and adults. Lancet 2017;390(10113):2627-2642PubMedPMC
- 10. Kouda K, Nakamura H, Nishio N, Fujita Y, Takeuchi H, Iki M. Trends in body mass index, blood pressure, and serum lipids in Japanese children: Iwata population-based annual screening (1993–2008). J Epidemiol 2010;20(3):212-218ArticlePubMedPMC
- 11. Watkins D, McCarron P, Murray L, Cran G, Boreham C, Robson P, et al. Trends in blood pressure over 10 years in adolescents: analyses of cross sectional surveys in the Northern Ireland Young Hearts project. BMJ 2004;329(7458):139ArticlePubMedPMC
- 12. Xi B, Bovet P, Hong YM, Zong X, Chiolero A, Kim HS, et al. Recent blood pressure trends in adolescents from China, Korea, Seychelles and the United States of America, 1997-2012. J Hypertens 2016;34(10):1948-1958ArticlePubMed
- 13. Flynn JT, Kaelber DC, Baker-Smith CM, Blowey D, Carroll AE, Daniels SR, et al. Clinical practice guideline for screening and management of high blood pressure in children and adolescents. Pediatrics 2017;140(3):e20171904ArticlePubMed
- 14. Xi B, Zong X, Kelishadi R, Hong YM, Khadilkar A, Steffen LM, et al. Establishing international blood pressure references among nonoverweight children and adolescents aged 6 to 17 years. Circulation 2016;133(4):398-408ArticlePubMed
- 15. Moon JS, Lee SY, Nam CM, Choi JM, Choe BK, Seo JW, et al. 2007 Korean National Growth Charts: review of developmental process and an outlook. Korean J Pediatr 2008;51(1):1-25. (Korean)Article
- 16. Centers for Disease Control and Prevention. CDC growth charts [cited 2019 Dec 5]. Available from: https://www.cdc.gov/gr-owthcharts/cdc_charts.htm
- 17. Perloff D, Grim C, Flack J, Frohlich ED, Hill M, McDonald M, et al. Human blood pressure determination by sphygmomanometry. Circulation 1993;88(5 Pt 1):2460-2470ArticlePubMed
- 18. Park J, Hilmers DC, Mendoza JA, Stuff JE, Liu Y, Nicklas TA. Prevalence of metabolic syndrome and obesity in adolescents aged 12 to 19 years: comparison between the United States and Korea. J Korean Med Sci 2010;25(1):75-82ArticlePubMed
- 19. Park J, Mendoza JA, O’Neil CE, Hilmers DC, Liu Y, Nicklas TA. A comparison of the prevalence of the metabolic syndrome in the United States (US) and Korea in young adults aged 20 to 39 years. Asia Pac J Clin Nutr 2008;17(3):471-482PubMed
- 20. Ha K, Kim K, Chun OK, Joung H, Song Y. Differential association of dietary carbohydrate intake with metabolic syndrome in the US and Korean adults: data from the 2007-2012 NHANES and KNHANES. Eur J Clin Nutr 2018;72(6):848-860ArticlePubMedPDF
- 21. Shirasawa T, Ochiai H, Nishimura R, Morimoto A, Shimada N, Ohtsu T, et al. Secular trends in blood pressure among Japanese schoolchildren: a population-based annual survey from 1994 to 2010. J Epidemiol 2012;22(5):448-453ArticlePubMedPMC
- 22. Xi B, Zhang T, Zhang M, Liu F, Zong X, Zhao M, et al. Trends in elevated blood pressure among US children and adolescents: 1999-2012. Am J Hypertens 2016;29(2):217-225ArticlePubMedPDF
- 23. National High Blood Pressure Education Program Working Group on High Blood Pressure in Children and Adolescents. The fourth report on the diagnosis, evaluation, and treatment of high blood pressure in children and adolescents. Pediatrics 2004;114(Suppl 2):555-576ArticlePubMed
- 24. Mi J, Wang TY, Meng LH, Zhu GJ, Han SM, Zhong Y, et al. Development of blood pressure reference standards for Chinese children and adolescents. Chin J Evid Based Pediatr 2010;5(1):4-14
- 25. Jackson LV, Thalange NK, Cole TJ. Blood pressure centiles for Great Britain. Arch Dis Child 2007;92(4):298-303ArticlePubMed
- 26. Lee CG, Moon JS, Choi JM, Nam CM, Lee SY, Oh K, et al. Normative blood pressure references for Korean children and adolescents. Korean J Pediatr 2008;51(1):33-41. (Korean)Article
- 27. Khang YH, Lynch JW. Exploring determinants of secular decreases in childhood blood pressure and hypertension. Circulation 2011;124(4):397-405ArticlePubMed
- 28. Jackson SL, Zhang Z, Wiltz JL, Loustalot F, Ritchey MD, Goodman AB, et al. Hypertension among youths - United States, 2001-2016. Am J Transplant 2018;18(9):2356-2360Article
- 29. Skinner AC, Skelton JA. Prevalence and trends in obesity and severe obesity among children in the United States, 1999-2012. JAMA Pediatr 2014;168(6):561-566ArticlePubMed
- 30. Gu X, Tucker KL. Dietary quality of the US child and adolescent population: trends from 1999 to 2012 and associations with the use of federal nutrition assistance programs. Am J Clin Nutr 2017;105(1):194-202ArticlePubMed
- 31. Livingstone KM, Givens DI, Cockcroft JR, Pickering JE, Lovegrove JA. Is fatty acid intake a predictor of arterial stiffness and blood pressure in men? Evidence from the Caerphilly Prospective Study. Nutr Metab Cardiovasc Dis 2013;23(11):1079-1085ArticlePubMed
- 32. Iannotti RJ, Wang J. Trends in physical activity, sedentary behavior, diet, and BMI among US adolescents, 2001-2009. Pediatrics 2013;132(4):606-614ArticlePubMedPMC
- 33. Kirkendall WM, Burton AC, Epstein FH, Freis ED. Recommendations for human blood pressure determination by sphygmomanometers. Circulation 1967;36(6):980-988ArticlePubMed
REFERENCES
Figure & Data
References
Citations
- Body Mass Index, Waist Circumference, Hip Circumference, Waist-To-Height Ratio: Which Affects Adolescent Hypertension More?
Melike TELLİOĞLU, Muammer YILMAZ, İnci ARIKAN, Yaşar ÇAKMAKÇI
Phoenix Medical Journal.2023; 5(1): 17. CrossRef - Combined associations of general obesity and central obesity with hypertension stages and phenotypes among children and adolescents in Zhejiang, China
Dong Zhao, Jiali Zhou, Danting Su, Yun Li, Weidi Sun, Boren Tan, Shuting Li, Ronghua Zhang, Peige Song
The Journal of Clinical Hypertension.2023; 25(11): 983. CrossRef - Дискордантные тренды повышенного артериального давления и избыточной массы тела у подростков 14–18 лет Новосибирска (по данным популяционных исследований в Новосибирске – 1989–2019 гг.)
Д. В. Денисова, Е. А. Беляевская
Ateroscleroz.2023; 19(3): 210. CrossRef - Association between body mass index and oesophageal cancer mortality: a pooled analysis of prospective cohort studies with >800 000 individuals in the Asia Cohort Consortium
Sangjun Lee, Jieun Jang, Sarah Krull Abe, Shafiur Rahman, Eiko Saito, Rashedul Islam, Prakash C Gupta, Norie Sawada, Akiko Tamakoshi, Xiao-Ou Shu, Woon-Puay Koh, Atsuko Sadakane, Ichiro Tsuji, Jeongseon Kim, Isao Oze, Chisato Nagata, San-Lin You, Myung-He
International Journal of Epidemiology.2022; 51(4): 1190. CrossRef - Correlates of Undiagnosed Hypertension Among Chinese and Korean American Immigrants
Brittany N. Morey, Connie Valencia, Sunmin Lee
Journal of Community Health.2022; 47(3): 425. CrossRef - Association between Body Mass Index and Risk of Gastric Cancer by Anatomic and Histologic Subtypes in Over 500,000 East and Southeast Asian Cohort Participants
Jieun Jang, Sangjun Lee, Kwang-Pil Ko, Sarah K. Abe, Md. Shafiur Rahman, Eiko Saito, Md. Rashedul Islam, Norie Sawada, Xiao-Ou Shu, Woon-Puay Koh, Atsuko Sadakane, Ichiro Tsuji, Jeongseon Kim, Isao Oze, Chisato Nagata, Shoichiro Tsugane, Hui Cai, Jian-Min
Cancer Epidemiology, Biomarkers & Prevention.2022; 31(9): 1727. CrossRef - Association Between Obesity and Blood Pressure Among Iranian Children and Adolescents: A Sub-analysis from the SHED LIGHT Study
Avisa Tabib, Akbar Nikpajouh, Maryam Aryafar, Niloufar Samiei, Yousef Rezaei, Hassan Ziaodini, Azam Goodarzi, Bahareh Kazemborji, Nasim Naderi, Sepideh Taghavi, Hooman Bakhshandeh, Saeid Hosseini
Pediatric Cardiology.2022;[Epub] CrossRef
 PubReader
 ePub Link
 Cite
Cite


