Articles
- Page Path
- HOME > J Prev Med Public Health > Volume 55(5); 2022 > Article
-
Original Article
The Association Between Metabolic Syndrome and Colorectal Cancer Risk by Obesity Status in Korean Women: A Nationwide Cohort Study -
Seong-geun Moon
 , Boyoung Park
 -
Journal of Preventive Medicine and Public Health 2022;55(5):475-484.
DOI: https://doi.org/10.3961/jpmph.22.286
Published online: September 21, 2022
Department of Preventive Medicine, Hanyang University College of Medicine, Seoul, Korea
- Corresponding author: Boyoung Park, Department of Preventive Medicine, Hanyang University College of Medicine, 222 Wangsimni-ro, Seongdong-gu, Seoul 04763, Korea, E-mail: hayejine@hanyang.ac.kr
Copyright © 2022 The Korean Society for Preventive Medicine
This is an Open Access article distributed under the terms of the Creative Commons Attribution Non-Commercial License (https://creativecommons.org/licenses/by-nc/4.0/) which permits unrestricted non-commercial use, distribution, and reproduction in any medium, provided the original work is properly cited.
ABSTRACT
-
Objectives
- This study aimed to determine the association between metabolic syndrome (MetS) and the incidence of colorectal cancer (CRC) in Korean women with obesity.
-
Methods
- Cancer-free women (n=6 142 486) aged 40–79 years, who underwent National Health Insurance Service health examinations in 2009 and 2010 were included. The incidence of CRC was followed until 2018. The hazard ratio (HR) of MetS for the incidence of colon and rectal cancer was analyzed according to body mass index (BMI) categories, adjusting for confounders such as women’s reproductive factors. In addition, the heterogeneity of associations across BMI categories was assessed.
-
Results
- Women with MetS were at increased risk of colon and rectal cancer compared to women without MetS (HR, 1.20; 95% confidence interval [CI], 1.16 to 1.23 and HR,1.15; 95% CI, 1.11 to 1.20), respectively. The HR of MetS for colon cancer across BMI categories was 1.12 (95% CI, 1.06 to 1.19), 1.14 (95% CI, 1.08 to 1.20), and 1.16 (95% CI, 1.12 to 1.21) in women with BMIs <23.0 kg/m2, 23.0–24.9 kg/m2, and ≥25.0 kg/m2, respectively. The HR of MetS for rectal cancer across corresponding BMI categories was 1.16 (95% CI, 1.06 to 1.26), 1.14 (95% CI, 1.05 to 1.23), and 1.13 (95% CI, 1.06 to 1.20). The heterogeneity of associations across BMI categories was not significant in either colon or rectal cancer (p=0.587 for colon cancer and p=0.927 for rectal cancer).
-
Conclusions
- Women with MetS were at increased risk of colon and rectal cancer. Clinical and public health strategies should be considered for primary CRC prevention with an emphasis on improving women’s metabolic health across all BMI groups.
- Metabolic syndrome (MetS), a cluster of pathological conditions that includes visceral obesity, hyperglycemia, dyslipidemia, and increased blood pressure (BP), is a growing global health concern [1]. Although MetS and obesity are associated by definition, certain individuals who are obese with non-pathological metabolic components are called metabolically healthy obese [2]. The prevalence of metabolically healthy obesity (MHO) among obese people was estimated to be 50% if fewer than 3 component criteria for MetS were satisfied and 7% if none of the MetS component criteria were satisfied [3].
- Colorectal cancer (CRC) is a leading cause of cancer-related death, and its incidence is increasing worldwide [4]. The associations among MetS, obesity, and CRC are well established [5,6]. A meta-analysis study found that metabolically unhealthy obesity (MUHO) and MHO increased the risk of CRC in men. In women, however, a comparison of the association between metabolically healthy normal weight and CRC to the association of MHO or MUHO and CRC was not shown to be statistically significant. The study suggested that this gender-based difference might be due to variations in hormonal status between men and women or to gender-based differences in CRC carcinogenesis [7]. In addition to hormonal effects on CRC carcinogenesis, the association between MetS, obesity, and the anatomical site of the CRC should be considered. A study by Shen et al. [5] suggested that MetS was associated with a significantly increased risk of colon cancer in both genders, but not associated with rectal cancer in women. Another study showed that the association between obesity and colon cancer was prominent in both men and women, whereas the association between obesity and rectal cancer was less significant in women [6]. There have been several studies in Korea on the associations between MetS and CRC, obesity and CRC, or a combination of MetS, obesity, and CRC [8–11]. However, most Korean studies have not adjusted for women’s reproductive factors as confounders, despite the association between reproductive factors and CRC risk [12–14]. In addition, the association between the combination of MetS and obesity and the anatomical site of CRC in women has received little attention.
- Therefore, we used a nationwide insurance-based cohort study to investigate the associations between metabolic health, obesity, and CRC based on anatomical site in Korean women, adjusting for reproductive factors.
INTRODUCTION
- Study Population
- The National Health Insurance Service (NHIS) is a single mandatory health insurance system that covers most of the Korean population. The NHIS conducts biennial health examinations for most Koreans as well as age-standardized cancer screenings for adult Koreans. The NHIS health examination includes a self-reported questionnaire on lifestyle factors, family history (first-degree relatives), reproductive factors, anthropometric measurements, and laboratory measurements. Detailed information regarding the NHIS data is available in the cohort profile by Lee et al. [15].
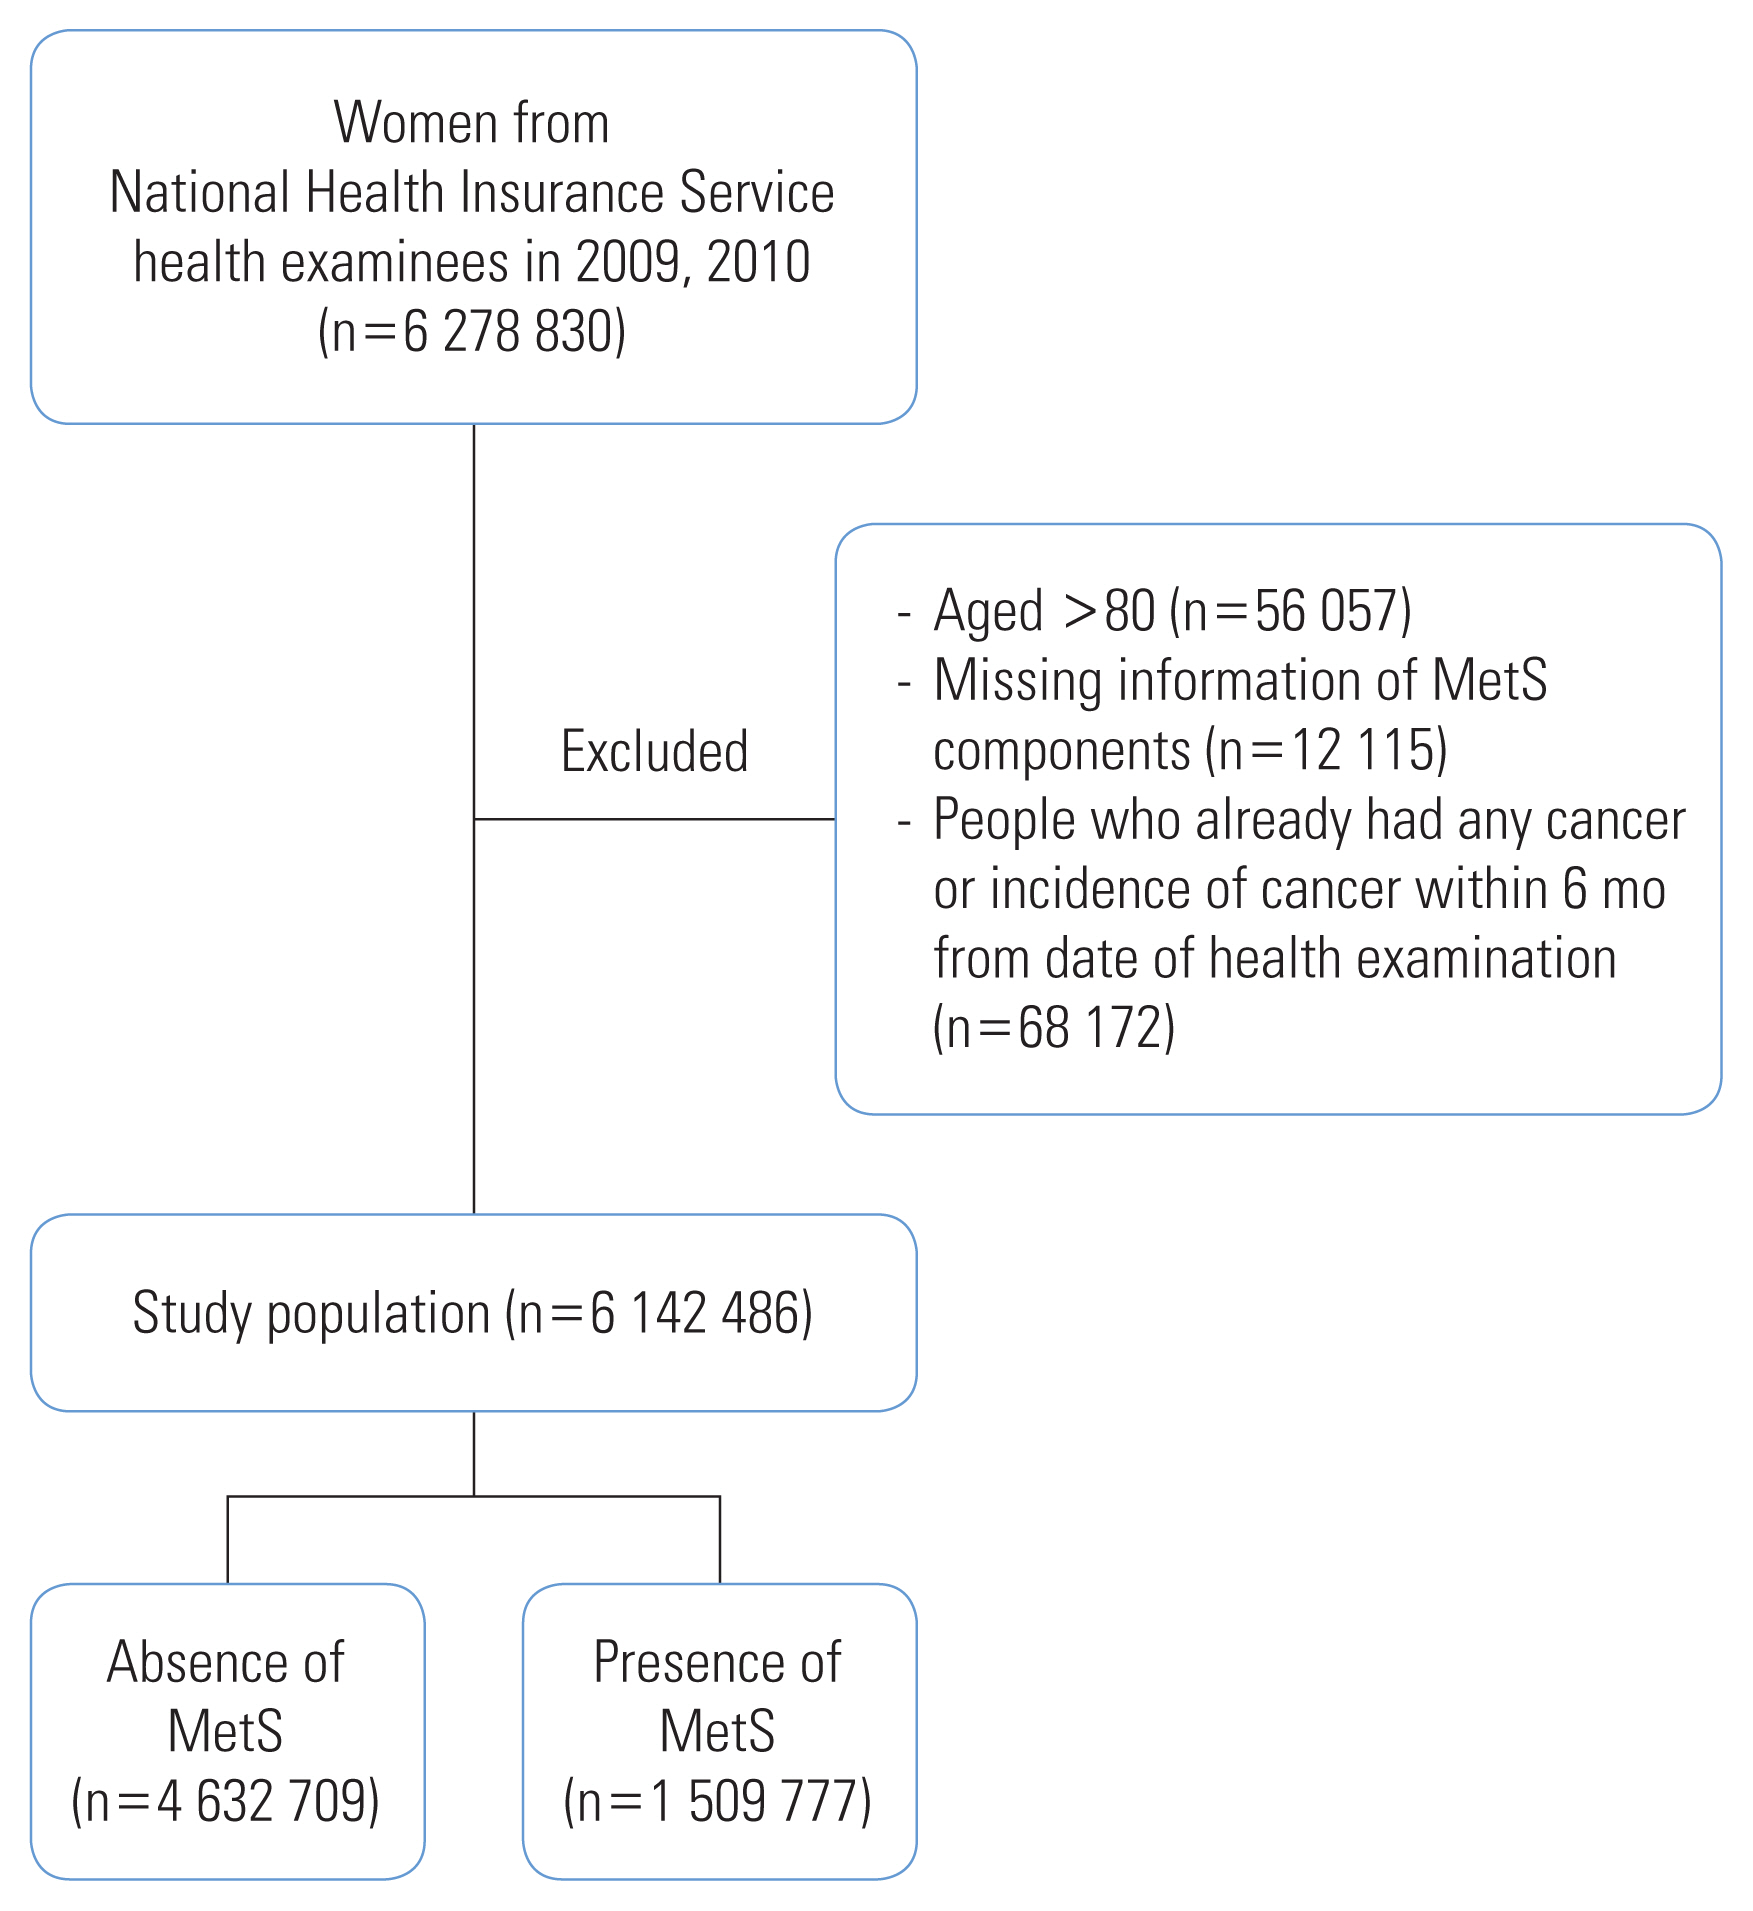
- Women who underwent the biennial health examination in 2009 and 2010 and were at risk of CRC were included in this study. Among the 6 278 830 women who underwent the NHIS health examination, we excluded the following: women aged >80 years (n=56 057), those with missing information on MetS (n=12 115), those with healthcare utilization for any type of cancer, and those registered in the Rare and Intractable Disease (RID) program before their health examination date or within 6 months following that date to exclude possible prevalent cases at screening (n=68 172). The final study sample included 6 142 486 women (Figure 1).
- Definition of Metabolic Syndrome and Obesity
- We used the modified National Cholesterol Education Program Adult Treatment Panel III to define MetS [16]. The MetS components were defined as follows: (1) waist circumference (WC) ≥80 cm, (2) fasting plasma glucose (FPG) ≥100 mg/dL, (3) triglyceride (TG) level ≥150 mg/dL, (4) high-density lipoprotein cholesterol (HDL) level <50 mg/dL, and (5) elevated BP (systolic BP ≥130 mmHg or diastolic BP ≥85 mmHg). MetS was defined as present if the participant met the criteria for 3 or more of the 5 above-mentioned components.
- Obesity was defined using the body mass index (BMI) criteria for Asians [17]. BMI was calculated using anthropometric measurements and categorized into 3 groups: (1) normal (BMI <23.0 kg/m2), (2) overweight (BMI 23.0–24.9 kg/m2), and (3) obese (BMI ≥25.0 kg/m2).
- Follow-up and Primary Endpoint
- The incidence of CRC was used as the primary endpoint and was identified by linking the National Health Screening Database to the NHIS Health Care Utilization Database on December 31, 2018. The incidence of CRC was defined by the International Classification of Disease, 10th version (ICD-10) codes for malignant neoplasms (C18–C20) combined with the RID registration program claims codes as entered into the NHIS health care utilization database for cancer (V193, V194). The RID registration program is a special-case system that lowers co-payment rates for patients with severe, rare, and incurable diseases. Patients with cancer who are registered in this system receive insurance benefits according to the benefit extension policy [18]. Patients are required to register their clinical information to qualify as a special case. Therefore, combining these codes increases the reliability of the NHIS cancer codes [19]. CRC was stratified into 2 kinds of cancer using the ICD-10 codes C18–C19 for colon cancer and C20 for rectal cancer.
- The follow-up period was from the health examination date in 2009 or 2010 until December 31, 2018, or until the date of death, date of CRC diagnosis, or date of another cancer diagnosis, whichever came first. A diagnosis of CRC was defined as an event, while death, diagnosis of another cancer, and no cancer incidence by December 31, 2018, were censored.
- Statistical Analysis
- The general characteristics of study participants with and without MetS were compared using the t-test for continuous variables and the chi-square test for categorical variables. The crude incidence rate (CIR) of CRC per 100 000 person-years was determined across BMI categories. The association between the presence of MetS and the incidence of CRC was analyzed using the Cox proportional hazard regression model adjusted for age, smoking, alcohol consumption, vigorous physical activity, moderate physical activity, walking, age at menarche, age at menopause, parity, breastfeeding, oral contraceptive use, and first-degree family history of cancer. Subgroup analyses according to MetS components were conducted using the same Cox proportional hazards regression model. The proportional hazard assumption of MetS was tested using a log-log survival plot, and the survival distribution function showed parallel lines, indicating that the assumption was satisfied. Hazard ratios (HRs) and 95% confidence intervals (CIs) for the association between MetS and cancer incidence were calculated and stratified by BMI categories. To test heterogeneity across BMI categories, the p-value for heterogeneity was calculated by using the fully adjusted HR and 95% CI with the “metagen” function of the R platform for meta-analysis. Statistical significance was set at p-value <0.05. Statistical analyses were performed using SAS version 9.4 (SAS Institute Inc., Cary, NC, USA) and R version 3.5.0 (R Core Team, Vienna, Austria).
- Ethics Statement
- Before each health examination, informed consent was obtained from the participant that allowed the transfer of results to the national health screening database. The NHIS database was available for research after the study proposal was reviewed and approved by the National Health Insurance Sharing Service (NHISS). The Institutional Review Board (IRB) of Hanyang University College of Medicine approved the study (IRB No. HYI-18-175-1), and we obtained access to the national health screening database of the NHIS based on IRB approval.
METHODS
- Of the 6 142 486 women, 2 668 255 (43.4%) had a BMI <23.0 kg/m2, 1 518 530 (24.7%) had a BMI ranging from 23.0 kg/m2 to 24.9 kg/m2, and 1 954 932 (31.8%) had a BMI ≥25.0 kg/m2. In general, women with MetS were older and less physically active across all BMI categories. Compared to women without MetS, a higher proportion of women with MetS had a late menarche (≥17 years), were menopausal, had given birth, breastfed for more than 6 months, used oral contraceptives, and had a lower baseline proportion of cancer in their family history (Table 1). The pattern of differences between women with and without MetS was similar after stratification by BMI (Supplemental Material 1).
- Table 2 shows the number of incident CRC cases and the CIR per 100 000 person-years across MetS and BMI categories stratified according to cancer site. There were 27 384 cases of colon cancer and 11 103 cases of rectal cancer observed for 53 435 432.1 person-years. Considering both cancer sites, the CIR was higher in women with MetS than in women without MetS. After stratification by BMI, the CIR was still higher in both sites for women with MetS (Table 2).
- Table 3 shows the results of the Cox proportional hazards model. In all models, MetS showed a significant HR for both cancer types. The association between MetS and both cancers was consistently significant after stratification by BMI. In colon cancer, MetS showed an HR of 1.14 for models 1 and 2. After adjusting for reproductive factors (model 3), MetS showed a significant HR of 1.20 (95% CI, 1.16 to 1.23). After stratifying the BMI categories, the association between MetS and colon cancer was still significant across all BMI categories, with an HR range of 1.12–1.16. For rectal cancer, MetS showed a pattern like that of colon cancer in all models. The HR for rectal cancer was still significant after BMI stratification with a range of 1.13–1.16. However, the p-value for the heterogeneity of BMI categories and MetS status was not significant for either cancer type (p=0.587 and p=0.927 for colon and rectal cancers, respectively, Table 3).
- Table 4 shows the association between each MetS component and the risk of CRC. In colon cancer, the association between each MetS component and colon cancer was significant, with an HR range of 1.07–1.18. After stratifying the BMI categories, all components of MetS, except low HDL and high BP, were associated with colon cancer risk. Low HDL levels did not show a significant association with colon cancer risk in people with a BMI <23.0 kg/m2 or a BMI of 23.0–24.9 kg/m2; high BP did not show a significant association with colon cancer risk in people with a BMI of 23.0–24.9 kg/m2. However, heterogeneity in HRs according to BMI category was not observed. An increased risk of rectal cancer was associated with all MetS components except low HDL, with an HR of 1.09–1.14. Based on BMI category, the association between each component of MetS and rectal cancer did not show heterogeneity. However, increased WC in those with a BMI <23.0 kg/m2 or a BMI of 23.0–24.9 kg/m2, and low BP in those with a BMI ≥ 25.0 kg/m2 did not show significant associations with rectal cancer risk.
RESULTS
- This cohort study showed that MetS was associated with an increased risk of both colon and rectal cancer in Korean women. MetS was significantly associated with colon and rectal cancers after adjusting for confounders, including reproductive factors. After stratifying the obesity categories, the associations between MetS and both cancer sites were consistent across all categories. In the subgroup analysis of MetS components, this association was consistent in both colon and rectal cancers, except for low HDL levels in rectal cancer. Although the associations between each MetS component and CRC varied according to subgroup analysis after stratification for obesity level, WC, FPG, and TG were still significant in colon cancer, and FPG and TG were significant in rectal cancer. The heterogeneity of the association of MetS with both cancer sites was not significant in either the main or subgroup analysis.
- In previous meta-analyses [5–7], the association between MetS and obesity differed when comparing men and women. Furthermore, several studies have shown that the association between women reproductive factors and CRC is significant [12–14], and that hormone replacement therapy has a protective effect [20,21]. However, our study results (models 2 and 3) showed that the association between MetS or its components and colon or rectal cancer did not differ after adjustment for reproductive factors. Moreover, oral contraceptive usage did not show a significant association with either cancer: (HR, 0.99; 95% CI, 0.96 to 1.03) for colon cancer and (HR, 0.97; 95% CI, 0.92 to 1.01) for rectal cancer. This suggests that the difference between men and women regarding the association of MetS or obesity with CRC, (i.e., MetS and obesity were consistent risk factors for men but heterogeneous for women) cannot be explained by reproductive factors alone.
- This study showed that all components of MetS were significant risk factors for colon and rectal cancer, with the exception of low HDL levels in rectal cancer. This supports the theory that CRC refers to two types of cancer [22,23]. The colon and rectum have different anatomical characteristics and different clinical presentations of cancer, genetic mutations, and pathways of carcinogenesis [22,23]. For biological evidence of this theory, studies have shown that risk factors such as insulin-like growth factor 1 (IGF-1) [24] and embryological origin [25,26] work differently based on anatomical location. Moreover, Shin et al. [27] found that the risk factors of CRC differ according to the subsites of the colon and rectum in Korean women. A meta-analysis by Tian et al. [28] showed that HDL was not a significant risk factor for CRC, while another meta-analysis showed that high HDL significantly decreased CRC risk [29]. Neither study differentiated CRC as colon or rectal cancer. Further studies are required to confirm the results regarding low HDL levels and rectal cancer or CRC.
- A possible pathophysiological explanation for the associations between MetS, obesity, and CRC incidence is that MetS and obesity are closely associated with insulin resistance, which causes hyperinsulinemia and increases the IGF-1 levels that promote the initiation and progression of cancer [30]. Similarly, Mendelian randomization analyses by Murphy et al. [31] showed that IGF-1’s positive relationship with CRC did not differ by gender or anatomic subsite. Our finding that MetS was significantly associated with both colon and rectal cancer in women in a large cohort study might be explained by the role of IGF-1 in carcinogenesis. However, the heterogeneity test for the association between MetS or its components and colon or rectal cancer risk by BMI categories showed no significant difference, possibly indicating that MetS and obesity were independent of each other and had no effect modification between them or indicating a complex carcinogenesis mechanism other than IGF-1.
- In previous studies of the association between MetS and CRC in women, the differing heterogeneity results were possibly due to different settings, such as whether CRC was differentiated as colon cancer or rectal cancer, whether BMI was a confounder or was in combination with MetS, and whether reproductive factors were confounders. There seems to be a small but significant association between MetS and CRC, even when differentiated as colon cancer or rectal cancer and adjusted for reproductive factors, regardless of obesity status in women. However, the probability of chance results cannot be excluded. The debate on the association between MetS and CRC in women continues; thus, a more precise design is needed, and large observational studies with additional variables, such as dietary patterns, genetic information, interaction effects, and birth cohort effects should be conducted.
- This study had some limitations. First, incident cancer cases 6 months prior to health examination (baseline) were excluded to minimize the possibility of reverse causation. Although some examinees who did not have medical records of cancer 6 months prior to the baseline study date may have had a delayed diagnosis, our sensitivity analysis excluding incident cancer within 1 year of the baseline date showed consistent results, indicating that the effect of this limitation was small. Second, we could not consider changes in MetS status and BMI over the follow-up period. As shown in a previous cohort study [32], transitions in metabolic health status can affect CRC incidence in women. Further research on the transitions in metabolic health should be conducted. Third, some known confounders, such as red meat consumption [33], could not be adjusted due to a lack of information. Therefore, the confounding effect of unaccounted-for variables could have affected our results. Fourth, because our study participants were women who underwent health examinations, their general characteristics may be different from those of non-examinees in the general population. However, the participation rate in the NHIS health examination was approximately 70% of the total population [34]. Thus, the effect of selection bias on this association was minimal.
- In summary, MetS was associated with an increased risk of colon cancer and rectal cancer in Korean women across all BMI categories. Our study results, based on the observations of a cohort study, could play a key role in designing clinical and public health strategies that focus on the metabolic health of women.
DISCUSSION
SUPPLEMENTAL MATERIALS
-
CONFLICT OF INTEREST
The authors have no conflicts of interest associated with the material presented in this paper.
-
FUNDING
This work was supported by a National Research Foundation of Korea grant funded by the Korean government’s Ministry of Science and Information and Communication Technologies (grant No. 2021R1A2C1011958).
Notes
ACKNOWLEDGEMENTS
-
AUTHOR CONTRIBUTIONS
Both authors contributed equally to conceiving the study, analyzing the data, and writing this paper.
Notes

| Site | Presence of MetS | Cox proportional hazard models1 | p for heterogeneity2 | |||||
|---|---|---|---|---|---|---|---|---|
|
|
||||||||
| Unadjusted model | Model 1 | Model 2 | Model 3 | |||||
| Colon | Total | MetS (−) | 1.00 (reference) | 1.00 (reference) | 1.00 (reference) | 1.00 (reference) | ||
| MetS (+) | 1.76 (1.49, 2.08) | 1.14 (1.11, 1.17) | 1.14 (1.11, 1.17) | 1.20 (1.16, 1.23) | ||||
| BMI (kg/m2) | <23.0 | MetS (−) | 1.00 (reference) | 1.00 (reference) | 1.00 (reference) | 1.00 (reference) | 0.587 | |
| MetS (+) | 2.04 (1.94, 2.16) | 1.12 (1.06, 1.18) | 1.12 (1.05, 1.18) | 1.12 (1.06, 1.19) | ||||
| 23.0–24.9 | MetS (−) | 1.00 (reference) | 1.00 (reference) | 1.00 (reference) | 1.00 (reference) | |||
| MetS (+) | 1.76 (1.67, 1.85) | 1.14 (1.08, 1.20) | 1.13 (1.08, 1.19) | 1.14 (1.08, 1.20) | ||||
| ≥25.0 | MetS (−) | 1.00 (reference) | 1.00 (reference) | 1.00 (reference) | 1.00 (reference) | |||
| MetS (+) | 1.52 (1.47, 1.58) | 1.16 (1.12, 1.21) | 1.16 (1.11, 1.20) | 1.16 (1.12, 1.21) | ||||
|
|
||||||||
| Rectum | Total | MetS (−) | 1.00 (reference) | 1.00 (reference) | 1.00 (reference) | 1.00 (reference) | ||
| MetS (+) | 1.67 (1.36, 2.06) | 1.14 (1.10, 1.19) | 1.14 (1.09, 1.19) | 1.15 (1.11, 1.20) | ||||
| BMI (kg/m2) | <23.0 | MetS (−) | 1.00 (reference) | 1.00 (reference) | 1.00 (reference) | 1.00 (reference) | 0.927 | |
| MetS (+) | 2.04 (1.88, 2.22) | 1.16 (1.06, 1.27) | 1.16 (1.06, 1.26) | 1.16 (1.06, 1.26) | ||||
| 23.0–24.9 | MetS (−) | 1.00 (reference) | 1.00 (reference) | 1.00 (reference) | 1.00 (reference) | |||
| MetS (+) | 1.63 (1.51, 1.76) | 1.14 (1.05, 1.24) | 1.14 (1.05, 1.24) | 1.14 (1.05, 1.23) | ||||
| ≥25.0 | MetS (−) | 1.00 (reference) | 1.00 (reference) | 1.00 (reference) | 1.00 (reference) | |||
| MetS (+) | 1.42 (1.33, 1.51) | 1.14 (1.07, 1.21) | 1.13 (1.06, 1.21) | 1.13 (1.06, 1.20) | ||||
Values are presented as hazard ratio (95% confidence interval).
BMI, body mass index; MetS, metabolic syndrome.
1 Model 1: adjusted for age; Model 2: adjusted for age, smoking, drinking, vigorous physical activity, moderate physical activity, walking, and family history of cancer; Model 3: adjusted for the variables in model 2, in addition to age at menarche, age at menopause, parity, breastfeeding duration, and oral contraceptive use.
2 Using hazard ratio of model 3.
| Site | BMI (kg/m2) | Level of component | Cox proportional hazard models1 | p for heterogeneity2 | |||
|---|---|---|---|---|---|---|---|
|
|
|||||||
| Unadjusted model | Model 1 | Model 2 | Model 3 | ||||
| Colon | WC <80 cm | 1.00 (reference) | 1.00 (reference) | 1.00 (reference) | 1.00 (reference) | ||
| Total | WC ≥80 cm | 1.69 (1.58, 1.82) | 1.10 (1.07, 1.14) | 1.10 (1.07, 1.14) | 1.18 (1.15, 1.21) | ||
| <23.0 | WC ≥80 cm | 1.82 (1.72, 1.92) | 1.08 (1.02, 1.14) | 1.08 (1.02, 1.14) | 1.08 (1.02, 1.14) | 0.422 | |
| 23.0–24.9 | WC ≥80 cm | 1.63 (1.56, 1.71) | 1.10 (1.04, 1.15) | 1.09 (1.04, 1.15) | 1.10 (1.04, 1.15) | ||
| ≥25.0 | WC ≥80 cm | 1.63 (1.54, 1.73) | 1.14 (1.08, 1.21) | 1.14 (1.07, 1.21) | 1.14 (1.07, 1.21) | ||
| FPG <100 mg/dL | 1.00 (reference) | 1.00 (reference) | 1.00 (reference) | 1.00 (reference) | |||
| Total | FPG ≥100 mg/dL | 1.40 (1.30, 1.50) | 1.13 (1.10, 1.16) | 1.13 (1.10, 1.16) | 1.15 (1.12, 1.18) | ||
| <23.0 | FPG ≥100 mg/dL | 1.49 (1.42, 1.55) | 1.13 (1.08, 1.18) | 1.12 (1.07, 1.17) | 1.12 (1.07, 1.17) | 0.923 | |
| 23.0–24.9 | FPG ≥100 mg/dL | 1.40 (1.34, 1.48) | 1.14 (1.08, 1.20) | 1.13 (1.08, 1.19) | 1.14 (1.08, 1.19) | ||
| ≥25.0 | FPG ≥100 mg/dL | 1.32 (1.27, 1.37) | 1.14 (1.09, 1.18) | 1.13 (1.09, 1.18) | 1.13 (1.09, 1.18) | ||
| TG <150 mg/dL | 1.00 (reference) | 1.00 (reference) | 1.00 (reference) | 1.00 (reference) | |||
| Total | TG ≥150 mg/dL | 1.45 (1.26, 1.67) | 1.11 (1.08, 1.14) | 1.11 (1.08, 1.14) | 1.13 (1.10, 1.16) | ||
| <23.0 | TG ≥150 mg/dL | 1.64 (1.57, 1.73) | 1.11 (1.05, 1.16) | 1.10 (1.05, 1.16) | 1.10 (1.05, 1.16) | 0.973 | |
| 23.0–24.9 | TG ≥150 mg/dL | 1.44 (1.37, 1.52) | 1.11 (1.06, 1.17) | 1.11 (1.05, 1.17) | 1.11 (1.05, 1.17) | ||
| ≥25.0 | TG ≥150 mg/dL | 1.28 (1.24, 1.33) | 1.11 (1.07, 1.16) | 1.11 (1.07, 1.15) | 1.11 (1.07, 1.15) | ||
| HDL ≥50 mg/dL | 1.00 (reference) | 1.00 (reference) | 1.00 (reference) | 1.00 (reference) | |||
| Total | HDL <50 mg/dL | 1.24 (1.18, 1.30) | 1.05 (1.01, 1.09) | 1.06 (1.02, 1.10) | 1.07 (1.05, 1.10) | ||
| <23.0 | HDL <50 mg/dL | 1.30 (1.24, 1.36) | 1.02 (0.98, 1.07) | 1.03 (0.98, 1.08) | 1.03 (0.98, 1.08) | 0.129 | |
| 23.0–24.9 | HDL <50 mg/dL | 1.23 (1.18, 1.30) | 1.05 (1.00, 1.10) | 1.04 (0.99, 1.10) | 1.05 (1.00, 1.10) | ||
| ≥25.0 | HDL <50 mg/dL | 1.19 (1.15, 1.24) | 1.09 (1.05, 1.13) | 1.09 (1.05, 1.13) | 1.09 (1.05, 1.13) | ||
| Low BP3 | 1.00 (reference) | 1.00 (reference) | 1.00 (reference) | 1.00 (reference) | |||
| Total | High BP3 | 1.53 (1.34, 1.74) | 1.06 (1.03, 1.09) | 1.06 (1.04, 1.09) | 1.09 (1.06, 1.12) | ||
| <23.0 | High BP3 | 1.73 (1.66, 1.81) | 1.07 (1.03, 1.12) | 1.07 (1.03, 1.12) | 1.08 (1.03, 1.13) | 0.737 | |
| 23.0–24.9 | High BP3 | 1.50 (1.43, 1.58) | 1.05 (1.00, 1.10) | 1.05 (1.00, 1.10) | 1.05 (1.00, 1.10) | ||
| ≥25.0 | High BP3 | 1.38 (1.33, 1.43) | 1.06 (1.02, 1.10) | 1.06 (1.02, 1.10) | 1.06 (1.02, 1.10) | ||
|
|
|||||||
| Rectum | WC <80 cm | 1.00 (reference) | 1.00 (reference) | 1.00 (reference) | 1.00 (reference) | ||
| Total | WC ≥80 cm | 1.59 (1.44, 1.76) | 1.10 (1.05, 1.15) | 1.09 (1.04, 1.15) | 1.11 (1.07, 1.15) | ||
| <23.0 | WC ≥80 cm | 1.76 (1.62, 1.91) | 1.08 (0.99, 1.17) | 1.07 (0.98, 1.17) | 1.07 (0.98, 1.17) | 0.591 | |
| 23.0–24.9 | WC ≥80 cm | 1.50 (1.40, 1.62) | 1.09 (1.01, 1.17) | 1.08 (1.00, 1.17) | 1.08 (1.00, 1.16) | ||
| ≥25.0 | WC ≥80 cm | 1.52 (1.39, 1.67) | 1.15 (1.05, 1.26) | 1.14 (1.04, 1.25) | 1.14 (1.04, 1.25) | ||
| FPG <100 mg/dL | 1.00 (reference) | 1.00 (reference) | 1.00 (reference) | 1.00 (reference) | |||
| Total | FPG ≥100 mg/dL | 1.32 (1.21, 1.44) | 1.09 (1.05, 1.14) | 1.09 (1.05, 1.13) | 1.10 (1.06, 1.14) | ||
| <23.0 | FPG ≥100 mg/dL | 1.42 (1.32, 1.52) | 1.09 (1.02, 1.17) | 1.09 (1.02, 1.17) | 1.09 (1.02, 1.17) | 0.879 | |
| 23.0–24.9 | FPG ≥100 mg/dL | 1.33 (1.23, 1.43) | 1.11 (1.03, 1.20) | 1.11 (1.02, 1.19) | 1.11 (1.02, 1.20) | ||
| ≥25.0 | FPG ≥100 mg/dL | 1.22 (1.15, 1.30) | 1.08 (1.02, 1.15) | 1.08 (1.01, 1.15) | 1.08 (1.01, 1.15) | ||
| TG <150 mg/dL | 1.00 (reference) | 1.00 (reference) | 1.00 (reference) | 1.00 (reference) | |||
| Total | TG ≥150 mg/dL | 1.44 (1.23, 1.67) | 1.14 (1.09, 1.18) | 1.13 (1.08, 1.18) | 1.14 (1.10, 1.19) | ||
| <23.0 | TG ≥150 mg/dL | 1.66 (1.54, 1.78) | 1.15 (1.06, 1.24) | 1.14 (1.05, 1.23) | 1.14 (1.05, 1.23) | 0.965 | |
| 23.0–24.9 | TG ≥150 mg/dL | 1.41 (1.30, 1.52) | 1.14 (1.05, 1.23) | 1.13 (1.05, 1.23) | 1.13 (1.04, 1.22) | ||
| ≥25.0 | TG ≥150 mg/dL | 1.27 (1.20, 1.35) | 1.13 (1.06, 1.20) | 1.12 (1.06, 1.20) | 1.12 (1.05, 1.20) | ||
| HDL ≥50 mg/dL | 1.00 (reference) | 1.00 (reference) | 1.00 (reference) | 1.00 (reference) | |||
| Total | HDL <50 mg/dL | 1.17 (1.07, 1.27) | 1.01 (0.97, 1.05) | 1.02 (0.98, 1.06) | 1.03 (0.99, 1.07) | ||
| <23.0 | HDL <50 mg/dL | 1.27 (1.18, 1.36) | 1.02 (0.95, 1.09) | 1.02 (0.95, 1.09) | 1.02 (0.95, 1.09) | 0.728 | |
| 23.0–24.9 | HDL <50 mg/dL | 1.13 (1.04, 1.22) | 0.98 (0.91, 1.06) | 0.99 (0.92, 1.07) | 0.99 (0.92, 1.07) | ||
| ≥25.0 | HDL <50 mg/dL | 1.11 (1.04, 1.18) | 1.03 (0.97, 1.10) | 1.03 (0.97, 1.10) | 1.03 (0.97, 1.10) | ||
| Low BP3 | 1.00 (reference) | 1.00 (reference) | 1.00 (reference) | 1.00 (reference) | |||
| Total | High BP3 | 1.49 (1.28, 1.73) | 1.08 (1.04, 1.12) | 1.08 (1.04, 1.12) | 1.09 (1.05, 1.14) | ||
| <23.0 | High BP3 | 1.70 (1.60, 1.81) | 1.09 (1.02, 1.17) | 1.09 (1.02, 1.16) | 1.09 (1.02, 1.16) | 0.740 | |
| 23.0–24.9 | High BP3 | 1.48 (1.37, 1.59) | 1.10 (1.02, 1.19) | 1.10 (1.02, 1.19) | 1.10 (1.02, 1.19) | ||
| ≥25.0 | High BP3 | 1.31 (1.23, 1.40) | 1.06 (1.00, 1.13) | 1.06 (1.00, 1.13) | 1.06 (0.99, 1.13) | ||
Values are presented as hazard ratio (95% confidence interval).
BMI, body mass index; WC, waist circumference; FPG, fasting plasma glucose; TG, triglyceride; HDL, high-density lipoprotein cholesterol; BP, blood pressure.
1 Model 1: adjusted for age; Model 2: adjusted for age, smoking, drinking, vigorous physical activity, moderate physical activity, walking, and family history of cancer; Model 3: adjusted for the variables in model 2, in addition to age at menarche, age at menopause, parity, breastfeeding duration, and oral contraceptive use.
2 Using hazard ratio of model 3.
3 BP level was defined by following definition: systolic BP ≥130 mmHg or diastolic BP ≥85 mmHg as “high BP” and the others as “low BP”.
- 1. Bellastella G, Scappaticcio L, Esposito K, Giugliano D, Maiorino MI. Metabolic syndrome and cancer: “the common soil hypothesis”. Diabetes Res Clin Pract 2018;143: 389-397ArticlePubMed
- 2. Blüher M. Metabolically healthy obesity. Endocr Rev 2020;41(3):bnaa004PubMedPMC
- 3. Smith GI, Mittendorfer B, Klein S. Metabolically healthy obesity: facts and fantasies. J Clin Invest 2019;129(10):3978-3989ArticlePubMedPMC
- 4. GBD 2019 Colorectal Cancer Collaborators. Global, regional, and national burden of colorectal cancer and its risk factors, 1990–2019: a systematic analysis for the Global Burden of Disease Study 2019. Lancet Gastroenterol Hepatol 2022;7(7):627-647PubMedPMC
- 5. Shen X, Wang Y, Zhao R, Wan Q, Wu Y, Zhao L, et al. Metabolic syndrome and the risk of colorectal cancer: a systematic review and meta-analysis. Int J Colorectal Dis 2021;36(10):2215-2225ArticlePubMedPDF
- 6. Ma Y, Yang Y, Wang F, Zhang P, Shi C, Zou Y, et al. Obesity and risk of colorectal cancer: a systematic review of prospective studies. PLoS One 2013;8(1):e53916ArticlePubMedPMC
- 7. Goodarzi G, Mozaffari H, Raeisi T, Mehravar F, Razi B, Ghazi ML, et al. Metabolic phenotypes and risk of colorectal cancer: a systematic review and meta-analysis of cohort studies. BMC Cancer 2022;22(1):89ArticlePubMedPMCPDF
- 8. Choi YJ, Lee DH, Han KD, Shin CM, Kim N. Abdominal obesity, glucose intolerance and decreased high-density lipoprotein cholesterol as components of the metabolic syndrome are associated with the development of colorectal cancer. Eur J Epidemiol 2018;33(11):1077-1085ArticlePubMedPDF
- 9. Tran TT, Gunathilake M, Lee J, Kim J. Association between metabolic syndrome and its components and incident colorectal cancer in a prospective cohort study. Cancer 2022;128(6):1230-1241ArticlePubMedPDF
- 10. Jin EH, Han K, Lee DH, Shin CM, Lim JH, Choi YJ, et al. Association between metabolic syndrome and the risk of colorectal cancer diagnosed before age 50 years according to tumor location. Gastroenterology 2022;163(3):637-648e2ArticlePubMed
- 11. Ko S, Yoon SJ, Kim D, Kim AR, Kim EJ, Seo HY. Metabolic risk profile and cancer in Korean men and women. J Prev Med Public Health 2016;49(3):143-152ArticlePubMedPMCPDF
- 12. Fuhrman BJ, Moore SC, Byrne C, Makhoul I, Kitahara CM, Berrington de González A, et al. Association of the age at menarche with site-specific cancer risks in pooled data from nine cohorts. Cancer Res 2021;81(8):2246-2255ArticlePubMedPMCPDF
- 13. Lin KJ, Cheung WY, Lai JY, Giovannucci EL. The effect of estrogen vs. combined estrogen-progestogen therapy on the risk of colorectal cancer. Int J Cancer 2012;130(2):419-430ArticlePubMed
- 14. Bosetti C, Bravi F, Negri E, La Vecchia C. Oral contraceptives and colorectal cancer risk: a systematic review and meta-analysis. Hum Reprod Update 2009;15(5):489-498ArticlePubMed
- 15. Lee J, Lee JS, Park SH, Shin SA, Kim K. Cohort profile: the National Health Insurance Service-National Sample Cohort (NHIS-NSC), South Korea. Int J Epidemiol 2017;46(2):e15ArticlePubMed
- 16. Grundy SM, Cleeman JI, Daniels SR, Donato KA, Eckel RH, Franklin BA, et al. Diagnosis and management of the metabolic syndrome. An American Heart Association/National Heart, Lung, and Blood Institute Scientific Statement. Executive summary. Cardiol Rev 2005;13(6):322-327PubMed
- 17. World Health Organization. Regional Office for the Western Pacific. The Asia-Pacific perspective: redefining obesity and its treatment; 2000 [cited 2022 May 27]. Available from: https://apps.who.int/iris/handle/10665/206936
- 18. National Health Insurance Service. 2022 National Health Insurance & long-term care insurance system in Republic of Korea; [cited 2022 Aug 9]. Available from: https://www.nhis.or.kr/english/wbheaa03500m01.do?mode=view&articleNo=10814171&article.offset=0&articleLimit=10
- 19. Yang MS, Park M, Back JH, Lee GH, Shin JH, Kim K, et al. Validation of cancer diagnosis based on the National Health Insurance Service Database versus the National Cancer Registry Database in Korea. Cancer Res Treat 2022;54(2):352-361ArticlePubMedPMCPDF
- 20. Bouras E, Papandreou C, Tzoulaki I, Tsilidis KK. Endogenous sex steroid hormones and colorectal cancer risk: a systematic review and meta-analysis. Discov Oncol 2021;12(1):8ArticlePubMedPMCPDF
- 21. Mørch LS, Lidegaard Ø, Keiding N, Løkkegaard E, Kjær SK. The influence of hormone therapies on colon and rectal cancer. Eur J Epidemiol 2016;31(5):481-489ArticlePubMedPDF
- 22. Iacopetta B. Are there two sides to colorectal cancer? Int J Cancer 2002;101(5):403-408ArticlePubMed
- 23. van der Sijp MP, Bastiaannet E, Mesker WE, van der Geest LG, Breugom AJ, Steup WH, et al. Differences between colon and rectal cancer in complications, short-term survival and recurrences. Int J Colorectal Dis 2016;31(10):1683-1691ArticlePubMedPMCPDF
- 24. de Kort S, Simons CC, van den Brandt PA, Goldbohm RA, Arts IC, de Bruine AP, et al. Diabetes mellitus type 2 and subsite-specific colorectal cancer risk in men and women: results from the Netherlands Cohort Study on diet and cancer. Eur J Gastroenterol Hepatol 2016;28(8):896-903ArticlePubMed
- 25. Murphy G, Devesa SS, Cross AJ, Inskip PD, McGlynn KA, Cook MB. Sex disparities in colorectal cancer incidence by anatomic subsite, race and age. Int J Cancer 2011;128(7):1668-1675ArticlePubMedPMC
- 26. Bufill JA. Colorectal cancer: evidence for distinct genetic categories based on proximal or distal tumor location. Ann Intern Med 1990;113(10):779-788ArticlePubMed
- 27. Shin A, Joo J, Bak J, Yang HR, Kim J, Park S, et al. Site-specific risk factors for colorectal cancer in a Korean population. PLoS One 2011;6(8):e23196ArticlePubMedPMC
- 28. Tian Y, Wang K, Li J, Wang J, Wang Z, Fan Y, et al. The association between serum lipids and colorectal neoplasm: a systemic review and meta-analysis. Public Health Nutr 2015;18(18):3355-3370ArticlePubMedPMC
- 29. Yang Z, Tang H, Lu S, Sun X, Rao B. Relationship between serum lipid level and colorectal cancer: a systemic review and meta-analysis. BMJ Open 2022;12(6):e052373ArticlePubMedPMC
- 30. O’Neill S, O’Driscoll L. Metabolic syndrome: a closer look at the growing epidemic and its associated pathologies. Obes Rev 2015;16(1):1-12ArticlePDF
- 31. Murphy N, Carreras-Torres R, Song M, Chan AT, Martin RM, Papadimitriou N, et al. Circulating levels of insulin-like growth factor 1 and insulin-like growth factor binding protein 3 associate with risk of colorectal cancer based on serologic and mendelian randomization analyses. Gastroenterology 2020;158(5):1300-1312e20PubMed
- 32. Cho YK, Lee J, Kim HS, Park JY, Lee WJ, Kim YJ, et al. Metabolic health is a determining factor for incident colorectal cancer in the obese population: a nationwide population-based cohort study. Cancer Med 2021;10(1):220-229ArticlePubMedPMCPDF
- 33. Farvid MS, Sidahmed E, Spence ND, Mante Angua K, Rosner BA, Barnett JB. Consumption of red meat and processed meat and cancer incidence: a systematic review and meta-analysis of prospective studies. Eur J Epidemiol 2021;36(9):937-951ArticlePubMedPDF
- 34. Seong SC, Kim YY, Khang YH, Park JH, Kang HJ, Lee H, et al. Data resource profile: the National Health Information Database of the National Health Insurance Service in South Korea. Int J Epidemiol 2017;46(3):799-800PubMed
REFERENCES
Figure & Data
References
Citations
- Increased risk of cancer and cancer-related mortality in middle-aged Korean women with prediabetes and diabetes: a population-based study
Thi Xuan Mai Tran, Soyeoun Kim, Huiyeon Song, Boyoung Park
Epidemiology and Health.2023; 45: e2023080. CrossRef
 PubReader
 ePub Link
 Cite
Cite