Articles
- Page Path
- HOME > J Prev Med Public Health > Volume 56(4); 2023 > Article
-
Special Article
Updating Korean Disability Weights for Causes of Disease: Adopting an Add-on Study Method -
Dasom Im1
 , Noor Afif Mahmudah1,2, Seok-Jun Yoon3, Young-Eun Kim4, Don-Hyung Lee5, Yeon-hee Kim5, Yoon-Sun Jung6, Minsu Ock1,7
 -
Journal of Preventive Medicine and Public Health 2023;56(4):291-302.
DOI: https://doi.org/10.3961/jpmph.23.192
Published online: June 26, 2023
1Department of Preventive Medicine, Ulsan University Hospital, University of Ulsan College of Medicine, Ulsan, Korea
2Department of Family and Community Medicine, Faculty of Medicine, Public Health, and Nursing, Universitas Gadjah Mada, Yogyakarta, Indonesia
3Department of Preventive Medicine, Korea University College of Medicine, Seoul, Korea
4Big Data Department, National Health Insurance Service, Wonju, Korea
5Research & Statistics Team, Korean Health Promotion Institute, Seoul, Korea
6Artificial Intelligence and Big-Data Convergence Center, Gil Medical Center, Gachon University College of Medicine, Incheon, Korea
7Department of Preventive Medicine, University of Ulsan College of Medicine, Seoul, Korea
- Corresponding author: Minsu Ock, Department of Preventive Medicine, Ulsan University Hospital, University of Ulsan College of Medicine, 25 Daehagbyeongwon-ro, Dong-gu, Ulsan 44033, Korea, E-mail: ohohoms@naver.com
Copyright © 2023 The Korean Society for Preventive Medicine
This is an Open Access article distributed under the terms of the Creative Commons Attribution Non-Commercial License (https://creativecommons.org/licenses/by-nc/4.0/) which permits unrestricted non-commercial use, distribution, and reproduction in any medium, provided the original work is properly cited.
ABSTRACT
-
Objectives
- Disability weights require regular updates, as they are influenced by both diseases and societal perceptions. Consequently, it is necessary to develop an up-to-date list of the causes of diseases and establish a survey panel for estimating disability weights. Accordingly, this study was conducted to calculate, assess, modify, and validate disability weights suitable for Korea, accounting for its cultural and social characteristics.
-
Methods
- The 380 causes of disease used in the survey were derived from the 2019 Global Burden of Disease Collaborative Network and from 2019 and 2020 Korean studies on disability weights for causes of disease. Disability weights were reanalyzed by integrating the findings of an earlier survey on disability weights in Korea with those of the additional survey conducted in this study. The responses were transformed into paired comparisons and analyzed using probit regression analysis. Coefficients for the causes of disease were converted into predicted probabilities, and disability weights in 2 models (model 1 and 2) were rescaled using a normal distribution and the natural logarithm, respectively.
-
Results
- The mean values for the 380 causes of disease in models 1 and 2 were 0.488 and 0.369, respectively. Both models exhibited the same order of disability weights. The disability weights for the 300 causes of disease present in both the current and 2019 studies demonstrated a Pearson correlation coefficient of 0.994 (p=0.001 for both models). This study presents a detailed add-on approach for calculating disability weights.
-
Conclusions
- This method can be employed in other countries to obtain timely disability weight estimations.
- A disability weight (DW) is a measure that represents the severity of specific health states or causes of disease, in contrast to a utility weight. DW values range from 0, indicating full health, to 1, representing a disability equivalent to death [1]. DW is a critical component in calculating disability-adjusted life years (DALYs) and disability-adjusted life expectancy (DALE), which are used to determine summary measures of population health [2,3]. Therefore, it is essential to ensure the validity of DW, as it impacts the validity of the DALY and DALE calculations. An overestimated DW for a particular disease would lead to an overestimation of the burden of that disease, while the opposite would occur if the DW were underestimated.
- DW validity cannot be guaranteed by a single instance of validity verification. The emergence of new diseases, as well as changes in conditions, treatments, or societal perceptions, may render previously valid DWs inapplicable in the current era. Therefore, it is necessary to assess the validity of past DWs and determine whether modifications are required. The Global Burden of Disease Study has been updating DWs to reflect their current relevance [4–6]. The emergence of coronavirus disease 2019 (COVID-19) has further underscored the importance of revising DWs. While some studies have temporarily replaced COVID-19 with another disease for DW measurement [7,8], COVID-19 should be incorporated into DW evaluations given the disease’s expected persistence.
- Two DW measurement approaches are used according to the DALY calculation method [3]. One is an incidence-based approach involving the cause of disease, while the other is a prevalence-based approach focused on the health state. After determining which strategy to use, it is necessary to categorize the cause of disease or health state in order to construct a survey panel and to modify or create a health state description if needed [1]. Subsequently, a survey must be initiated, taking into account the valuation method and time presentation, as its results will be incorporated into DW calculations and validated. Due to cultural and social differences across countries, care should be taken when applying DWs to other nations. The 2010 Global Burden of Disease Report demonstrated relatively few discrepancies in health state preferences among countries [4]; however, it is challenging to assert that no differences were present in cultural perceptions of health states or diseases, as the 2010 survey exhibited bias in the number of participating countries and cultures. Therefore, DWs must be appropriately measured for the Korea, with their validity evaluated and their calculations adjusted as needed [1].
- In this study, we estimated DWs using an incidence-based approach with an updated list of disease causes. The validity of these DWs was assessed in consideration of Korea’s cultural and social characteristics. In particular, the DW survey results from previous studies employing an incidence-based approach were utilized through an add-on study method to refine the DWs [9,10].
INTRODUCTION
- Study Design and Participants
- A web-based self-administered survey was conducted, drawing from a previous study [10]. The survey took place between August 1, 2022, and August 30, 2022. Eligible participants were restricted to medically licensed physicians in Korea, with nurses and Korean medical doctors excluded due to improper response patterns observed in previous studies [10]. Furthermore, since the survey did not offer detailed descriptions of diseases, medical expertise was necessary to determine the cause of each disease based on its apparent value and severity level. Participants were recruited through advertisements on medical institution-related web boards, word of mouth, and snowball sampling, with participants who had completed the survey recommending other qualified individuals to join the study.
- Valuation Method and Causes of Disease
- The questionnaire consisted of 4 socio-demographic characteristics—age, sex, specialty, and occupation—as well as 20 questions regarding the ranking of causes of disease, in line with methods used in previous studies [9,10]. Of 378 causes of disease (excluding “full health” and “death”), 5 causes of disease were randomly selected for each question. Participants ranked these causes of disease in order of good health based on severity and face value [11]. “Full health” and “death” served as valuation anchor points to ensure the validity of survey responses and the participants’ full comprehension of the survey content. Specifically, “full health” was the first fixed alternative for questions 5, 10, 15, and 20, while “death” was the first fixed alternative for questions 9–12. Questions 9–12 were designed to include at least 1 of the new causes of disease as the second alternative for each question, increasing the likelihood of newly added causes of disease appearing in the questionnaire. An example of a ranking method question can be found in Supplemental Material 1.
- The list of causes of diseases used in the survey required modification, as previously measured DWs needed to be reviewed and validated to ensure their relevance to the current era considering new disease outbreaks such as COVID-19, changes in treatment, and shifts in social judgment regarding specific diseases [4–6]. A total of 380 causes of disease were identified for the study in the following manner. First, the list of causes of disease used in the 2019 Global Burden of Disease Collaborative Network was evaluated to incorporate global DW trends. In total, 281 causes of disease were selected, excluding those that could be further classified by severity. Next, 99 additional causes of disease were included after examining the causes of disease lists from the 2016, 2019, and 2020 Korean DW measurements to reflect the cultural characteristics of Korea [9,10,12]. Specifically, common causes of diseases from those 3 years, such as “hemorrhagic and other non-ischemic strokes” and “Asperger syndrome and other autistic spectrum disorders,” were added. Other common causes of diseases from 2016 and 2019, such as “influenza and intestinal infection,” and from 2019 and 2020, such as “stomach cancer” and “breast cancer stages 1–4,” were also included. From the 2020 list, “unintentional suffocation,” “COVID-19” with severity classification, “ischemic heart disease,” and others were added. The researchers and a DW expert reviewed each selection process and the English-to-Korean translation of disease terminology.
- Statistical Analysis
- During the data cleaning process, incomplete surveys and incorrect anchor-point answer data related to “full health” were removed. To enhance the validity of the results, raw data for measuring DW by the cause of disease from the 2019 [9] and 2020 [10] studies were utilized. Specifically, raw data from 430 participants in the 2019 study [9] and 685 participants in the 2020 study [10] were included after eliminating any data that did not meet the present participation eligibility criteria and any data derived from a set of questions with at least 1 cause of disease that did not overlap with the present list of causes of disease. For instance, in the 2019 study [9], 71 participants who did not complete the survey were initially removed from the data, followed by the exclusion of 175 participants who were either medical students, nurses, or Korean medical doctors; data derived from a set of questions that included 38 causes of diseases were also removed. Additionally, “human immunodeficiency virus disease resulting in mycobacterial infection” and “typhoid and paratyphoid fevers” were excluded, as they did not match the current list and were subdivided into 2 separate entities, respectively. In the 2020 study [10], 95 participants who did not complete the survey were initially removed, and 157 participants who did not meet the eligibility criteria were excluded; data resulting from any questions that included 11 disease causes were also withdrawn. Chronic kidney disease due to diabetes mellitus was excluded due to its subdivision in the current list. Subsequently, the labeling of the extracted data with cause of disease numbers was converted to match the present labeling system.
- First, a descriptive analysis of the participants’ socio-demographic characteristics was conducted using the complete dataset. The 5 alternatively ranked datasets were then transformed into a paired comparison format to adapt a precedent method [9,10]. Specifically, if a participant responded to a ranking questionnaire in the order of C1-C2-C3-C4-C5, this was transformed into C1–C5, C1–C4, C1–C3, C1–C2, C2–C5, C2–C4, C2–C3, C3–C5, C3–C4, and C4–C5. Probit regression analysis was performed using 2 models, in line with previous studies [12,13]. The cause of disease was treated as a dummy variable and set as an independent variable, while preference was set as a dependent variable. The regression coefficient for each cause of disease was then converted to a predicted probability. The value was rescaled based on the estimated DW of “death” (1), with this rescaled value considered the DW. The DWs were rescaled using a normal distribution and natural logarithm in models 1 and 2, respectively.
- Stata version 13.1 (StataCorp., College Station, TX, USA) was utilized for all statistical analyses. A p-value <0.05 was considered to indicate statistical significance.
- Ethics Statement
- The Korea University Institutional Review Board (IRB No. KUIRB-2022-0221-02) granted approval for this study. Prior to the survey, participants were informed about the study’s objectives and procedures. Only those who consented to the terms participated in the study and were given coffee coupons valued at 10 000 Korean won upon completion of the survey.
METHODS
- For this study, 211 participants began and completed the survey. Of these, 205 participants who correctly ranked “full health” first for the anchor point questions 5, 10, 15, and 20 were selected for analysis. As an add-on, 685 and 430 participants were chosen from the 2020 and 2019 studies [9,10], respectively. Table 1 displays the socio-demographic characteristics of the participants across the 3 years. Most participants during this period were male specialists in their 30s. In the current study and the 2019 study, most participants’ specialties were neither medical nor surgical, while participants from the 2020 study primarily specialized in medicine.
- Table 2 displays the DWs for the 2 models. The mean DWs for model 1 and model 2 were 0.488 and 0.369, respectively. Both models identified the same disease as having the highest DW: “trachea, bronchus, and lung cancers (stage 4),” with DWs of 0.922 in model 1 and 0.696 in model 2. Similarly, the lowest DW in both models was attributed to the same disease: “acne vulgaris,” with DWs of 0.055 in model 1 and 0.223 in model 2. The 2 models also shared the same ranking of diseases by DW.
- Following “trachea, bronchus, and lung cancers (stage 4),” the diseases with the highest DWs in descending order were “pancreatic cancer,” “kidney cancer (stage 4),” and “liver cancer secondary to alcohol use (stage 4).” Conversely, the diseases with the lowest DWs in ascending order were “acne vulgaris,” “caries of deciduous teeth,” “allergic rhinitis,” and “urticaria.”
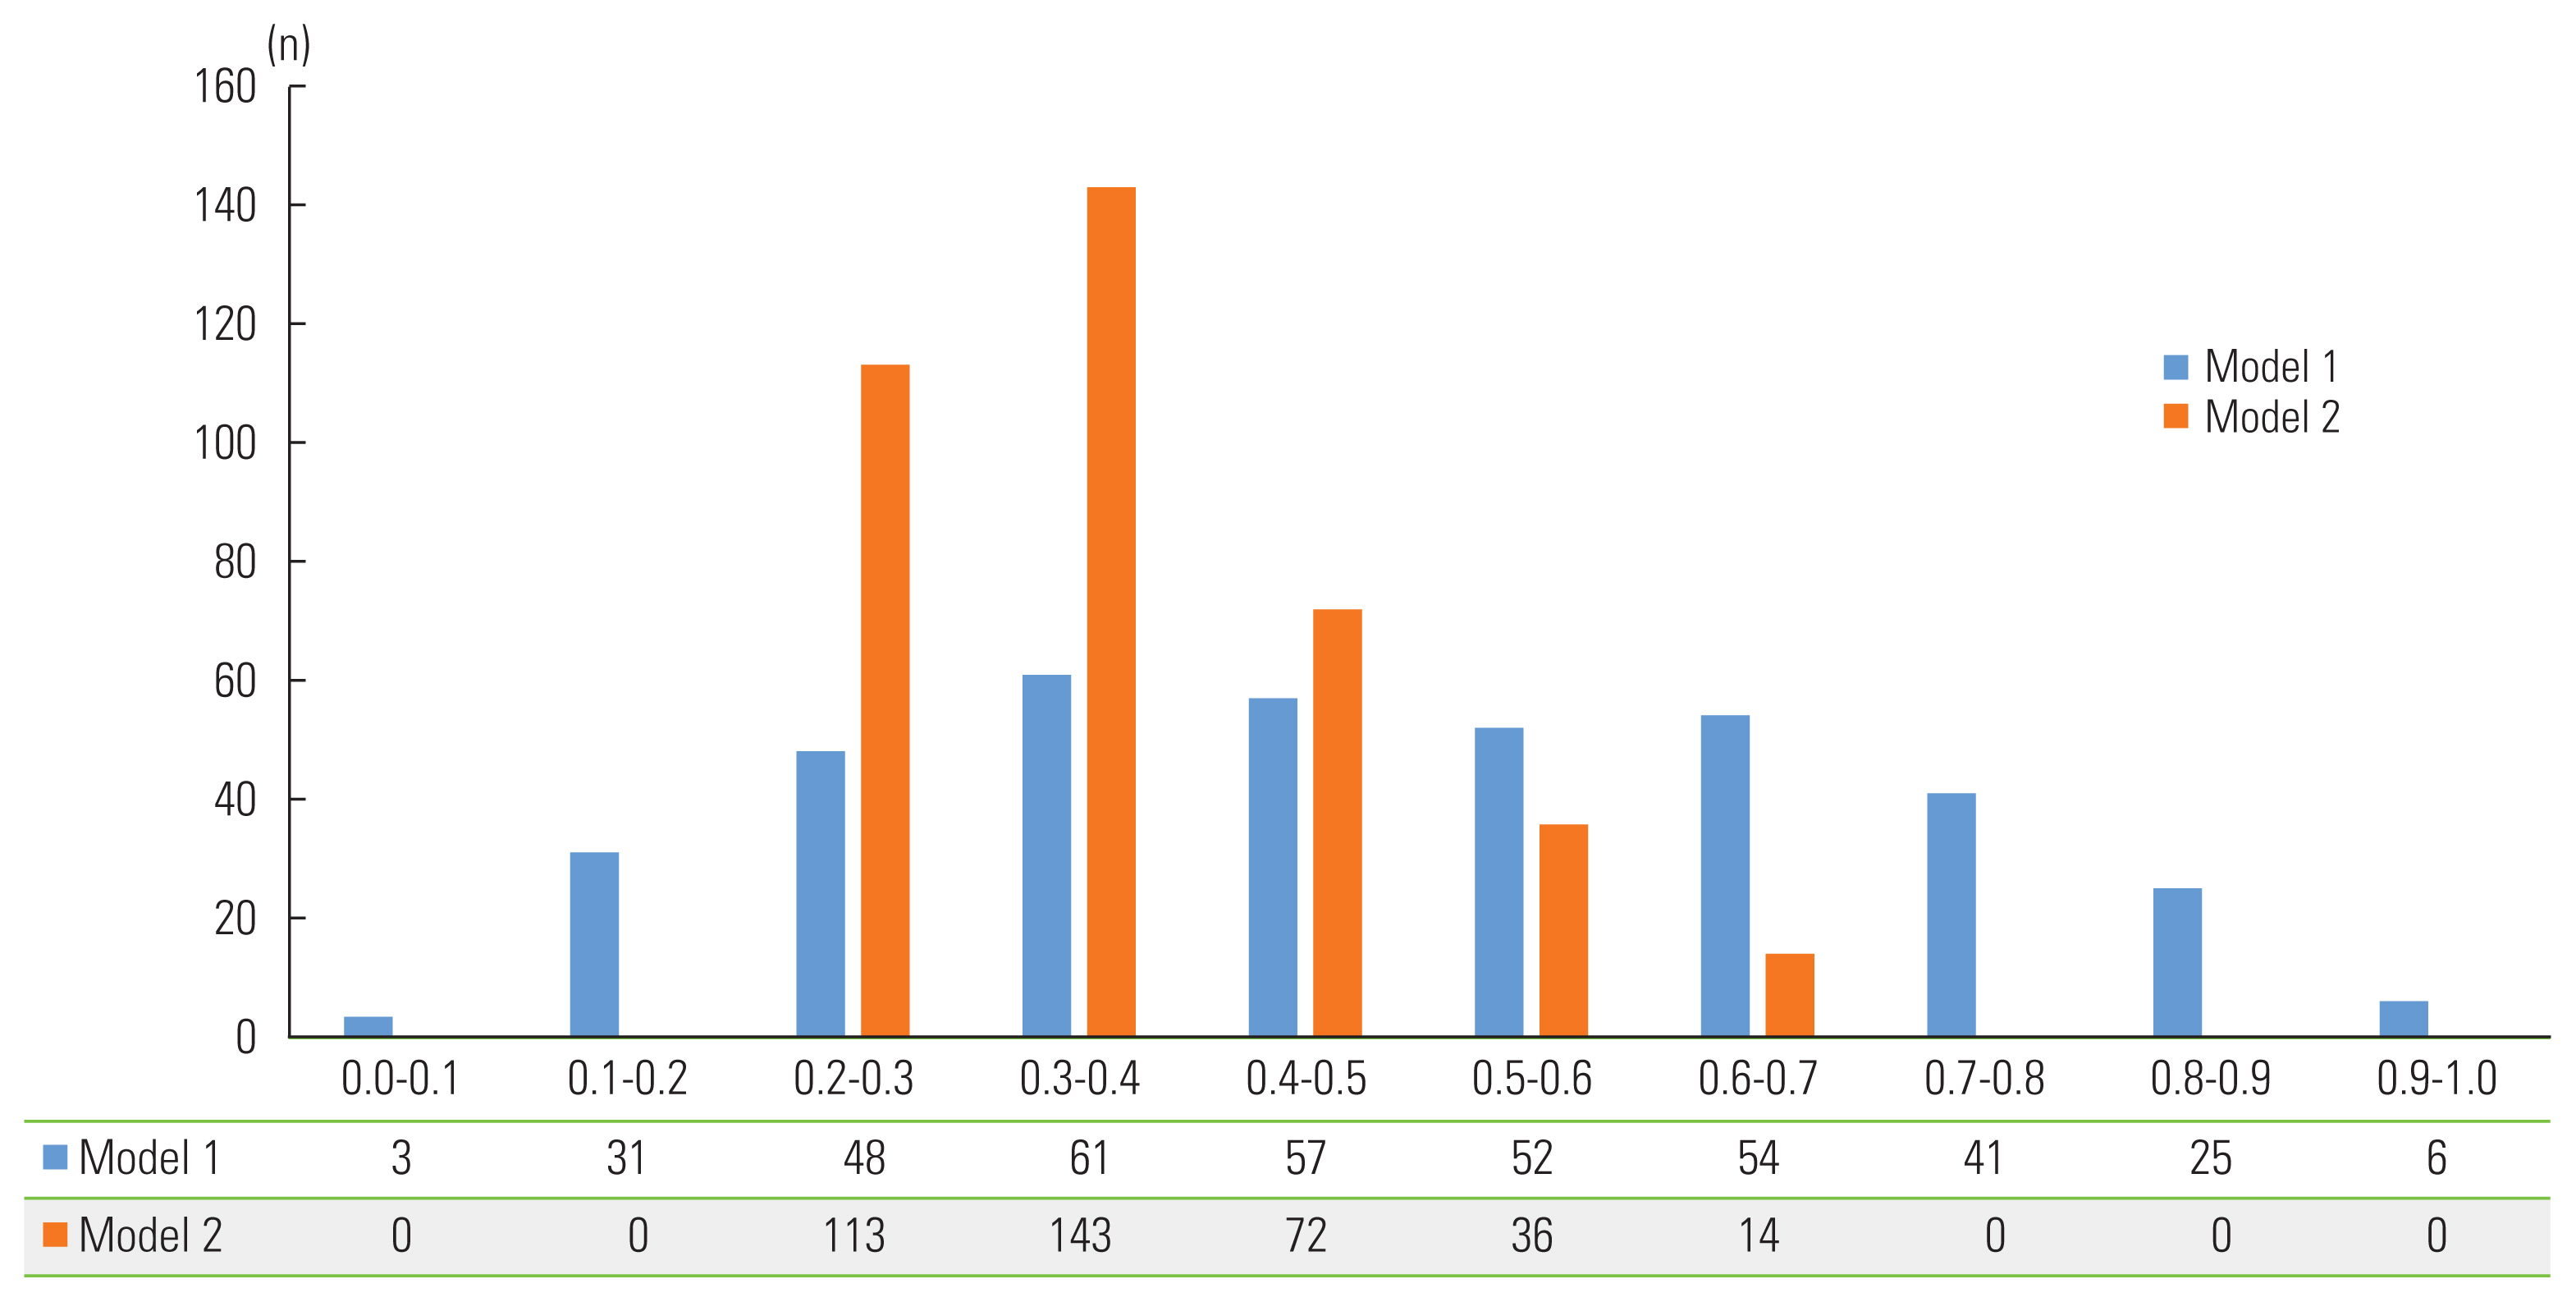
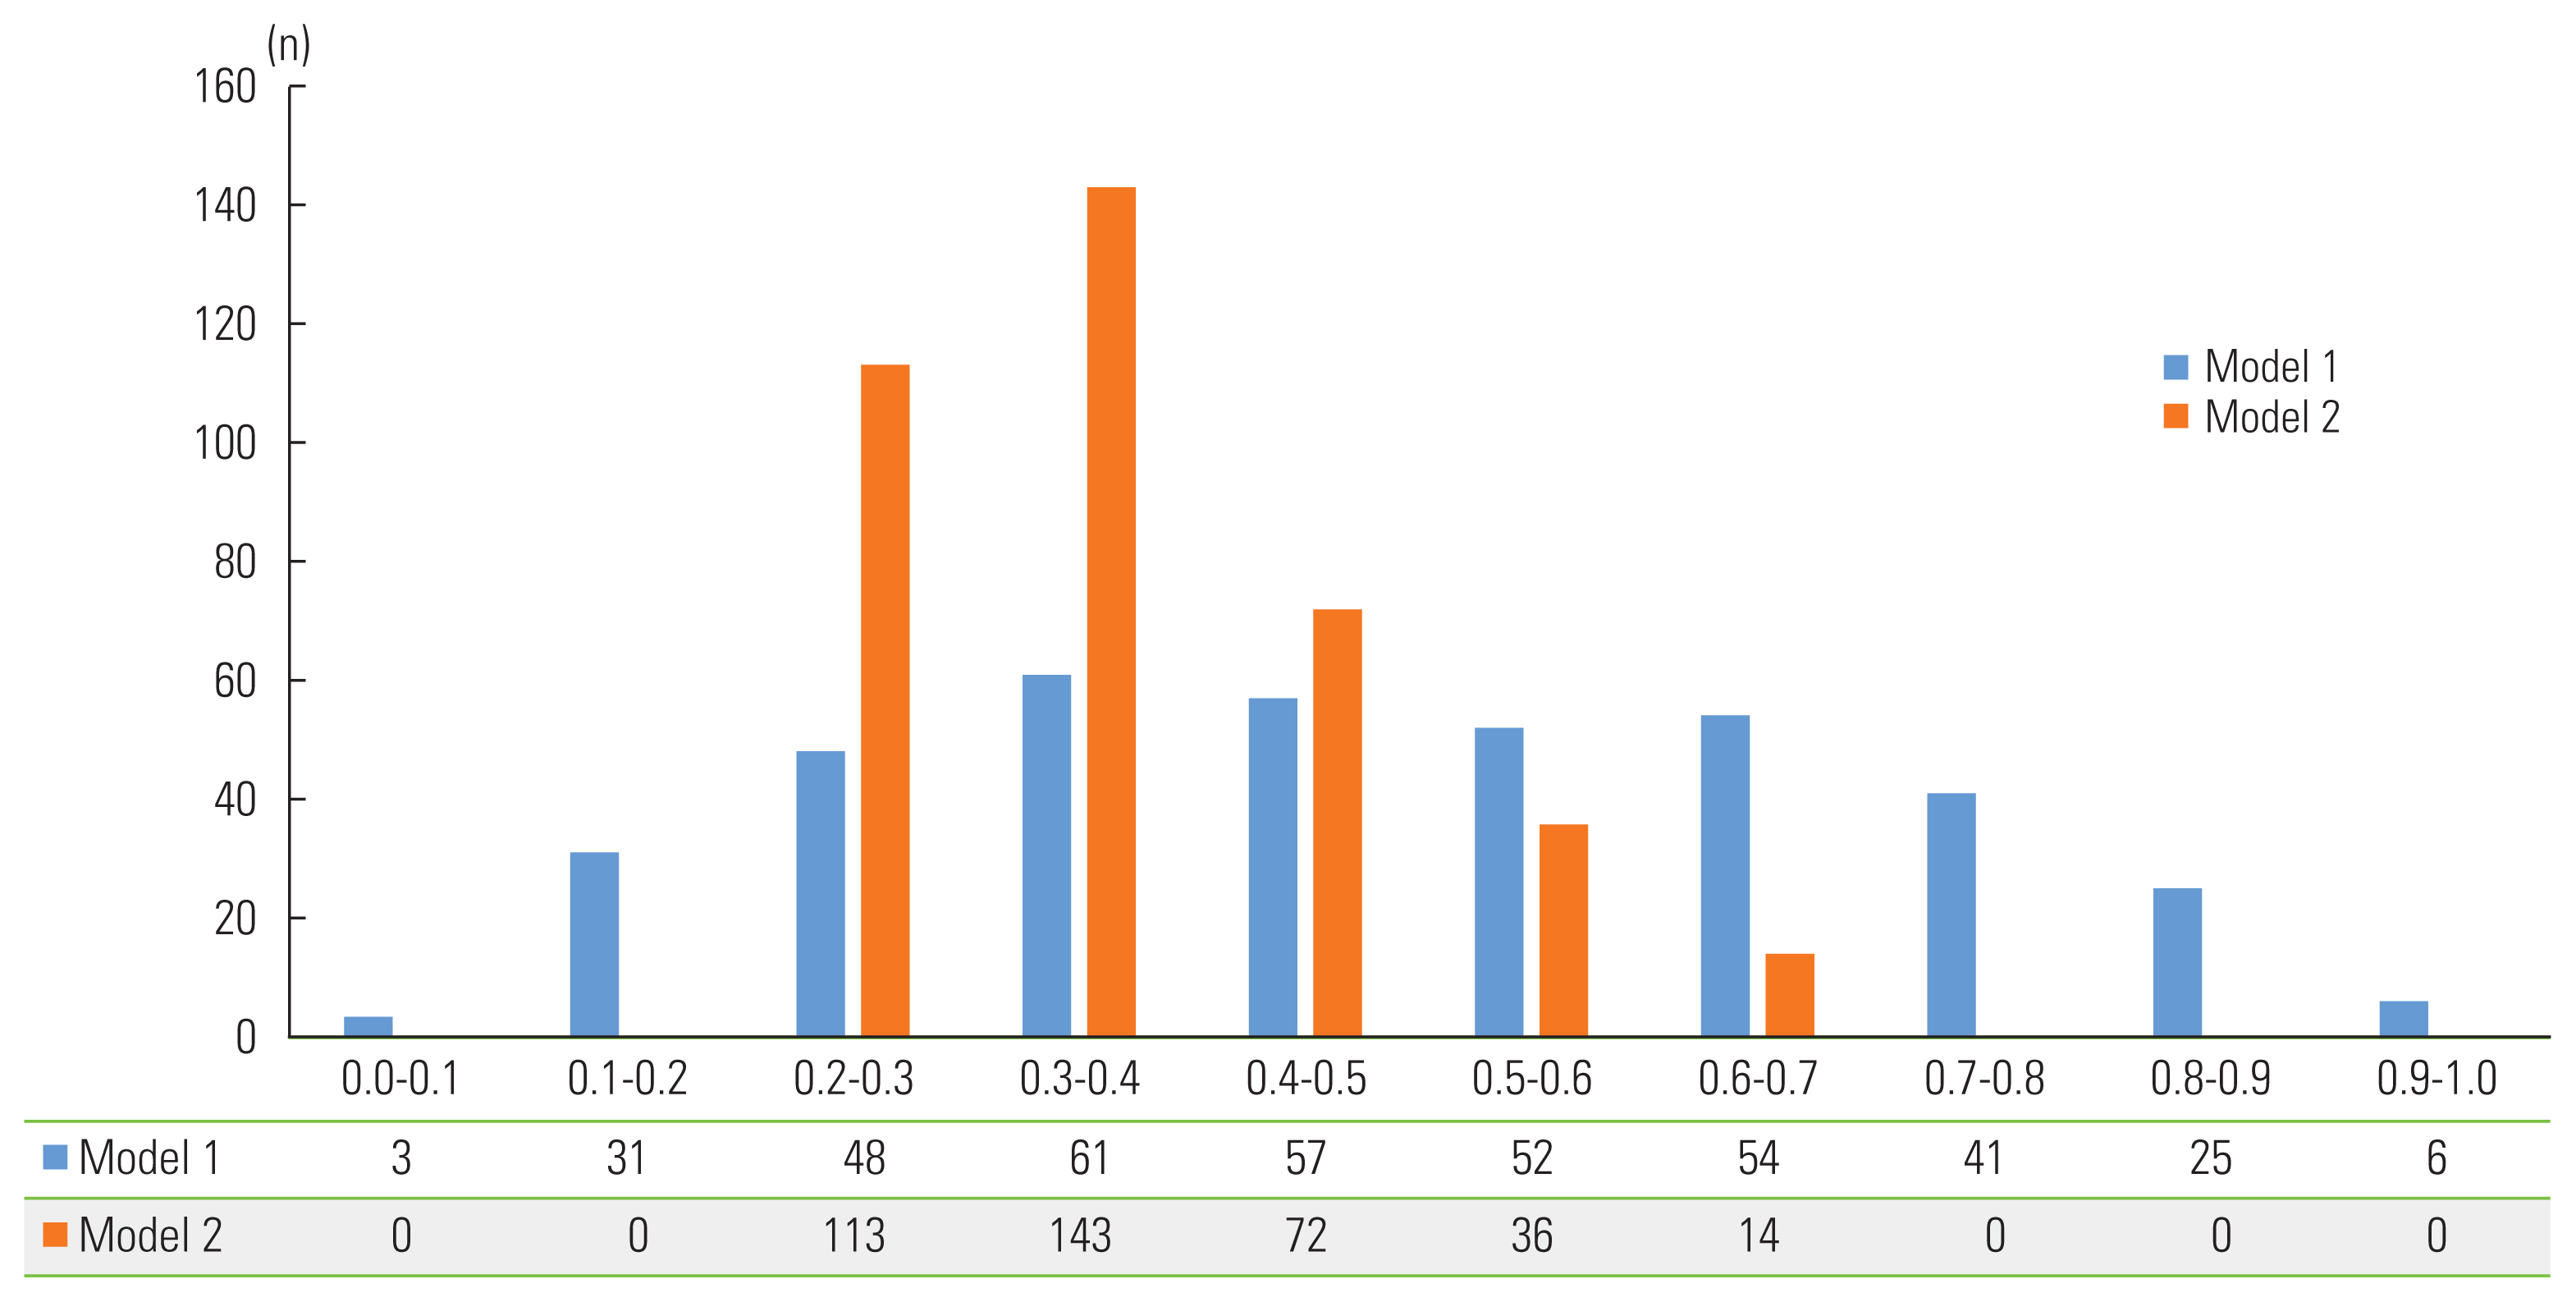
- Figure 1 illustrates the DW distributions for models 1 and 2. Model 1 displays a relatively normal distribution, whereas model 2 exhibits a left-skewed distribution. In model 1, the highest number of causes of disease, 61, was found in the DW range of 0.3 to 0.4. Meanwhile, in model 2, no causes of disease were identified with DW values less than 0.2 or greater than 0.7.
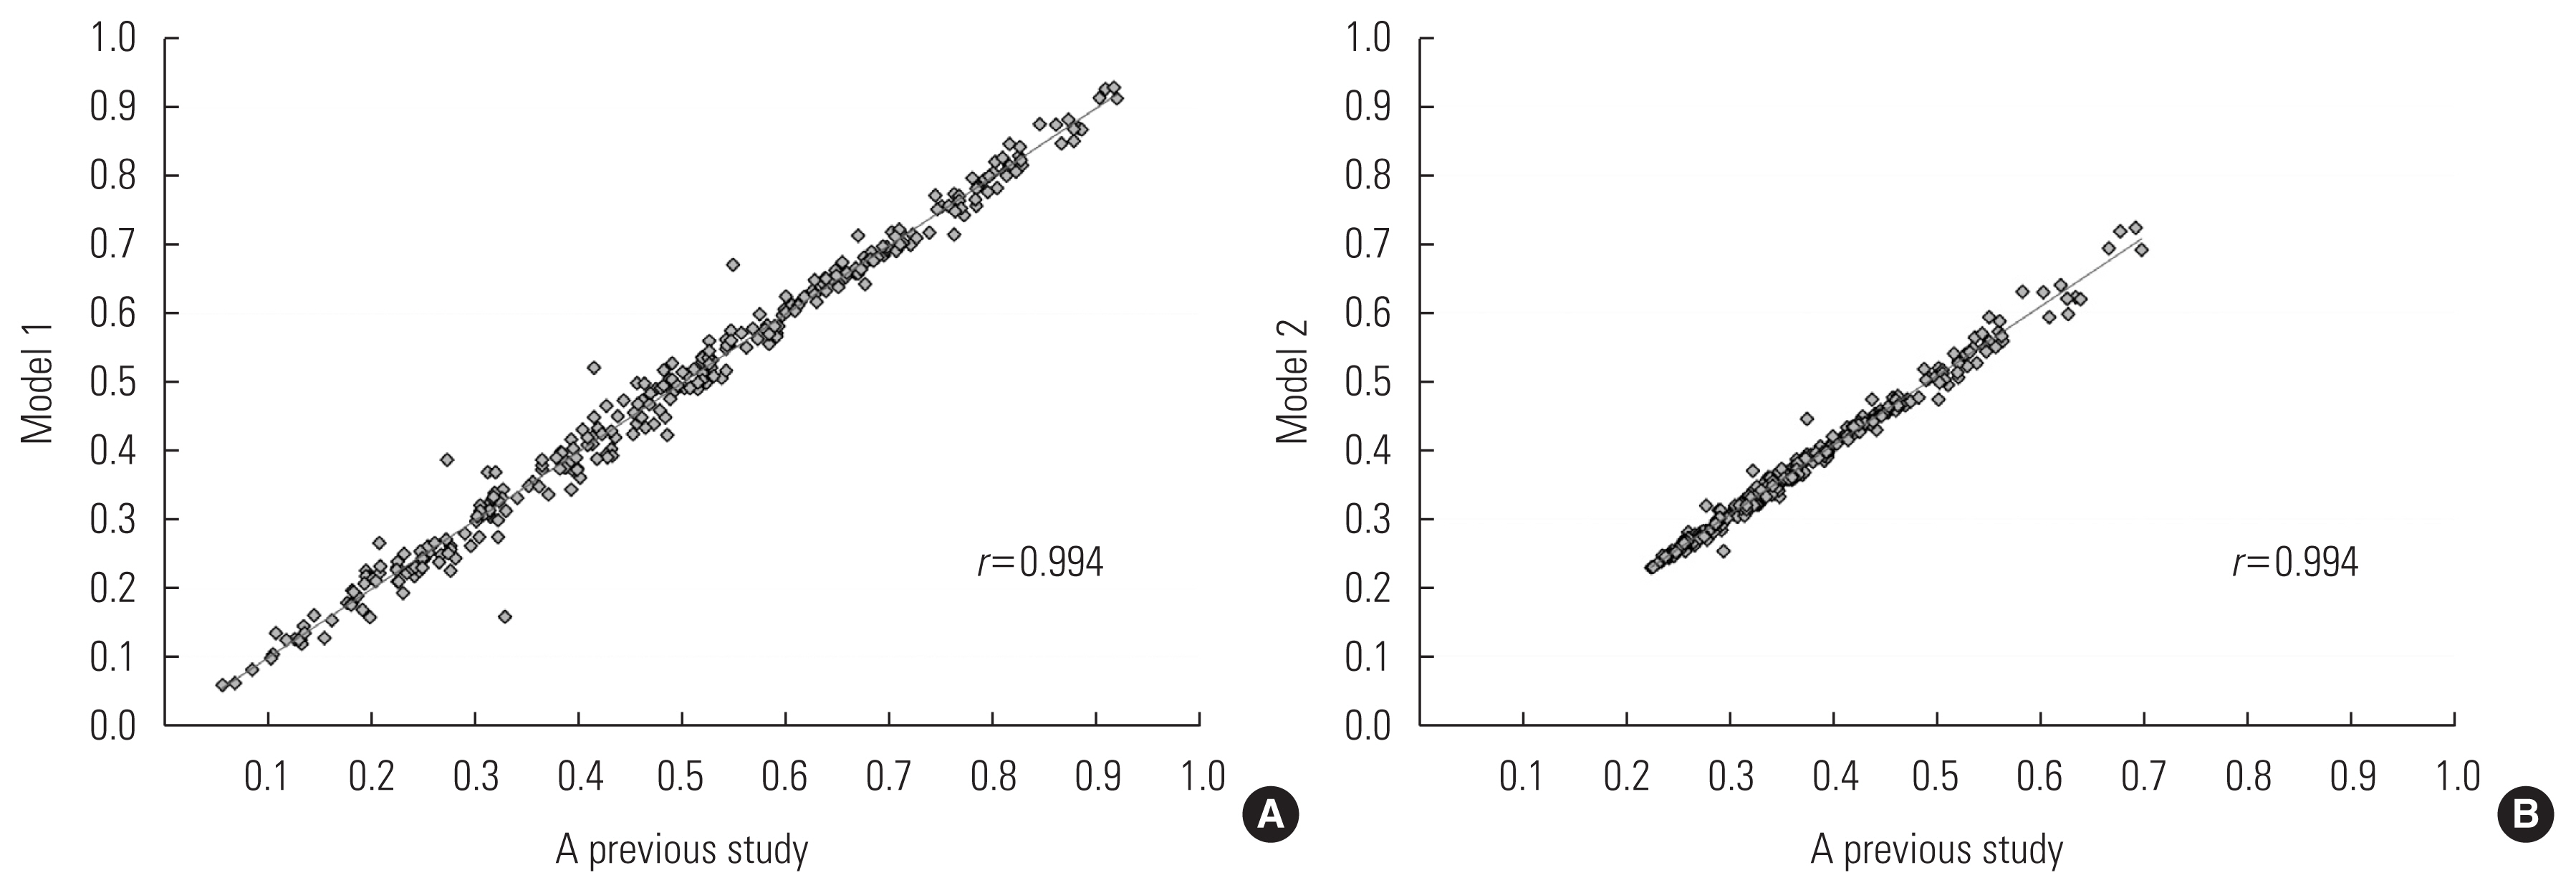
- Figure 2 displays the correlation between the DWs for causes of disease in the current and previous models [10]. The causes of disease from the 2020 study [10] were compared word by word with those in the present study, and 300 causes of disease were selected for correlation analyses. Both model 1 and model 2 had a Pearson correlation coefficient of 0.994 with a p-value of 0.001. Among the 300 overlapping causes of disease, 155 DWs increased in model 1 relative to the DWs in the previous study, while 137 DWs decreased (Supplemental Material 2). Eight DWs remained the same as in the previous study: “other meningitis” (0.583), “liver cancer secondary to alcohol use (stage 1)” (0.598), “asthma” (0.409), “Alzheimer disease and other dementias” (0.660), “conduct disorder” (0.314), “pruritus” (0.104), “other skin and subcutaneous diseases” (0.135), and “drowning” (0.527). In model 2, 145 DWs increased and 148 DWs decreased relative to the DWs in the previous study. Seven DWs remained unchanged: “latent tuberculosis infection” (0.268), “breast cancer (stage 2)” (0.393), “other drug use disorders” (0.291), “glaucoma” (0.315), “age-related and other hearing loss” (0.277), “physical violence by firearms” (0.365), and “physical violence by other means” (0.274).
RESULTS
- This study presents the findings of an add-on study approach for revising DWs. We combined the results of a present DW survey involving approximately 200 physicians with data from previous studies (430 and 685 participants in 2019 and 2020, respectively) to update the DWs for 380 causes of disease. In earlier DW studies, independent surveys were conducted to introduce new causes of disease or refine existing ones, and the outcomes were analyzed to generate DWs. The central importance of this study is its demonstration of the potential to revise DWs using an add-on study method.
- The importance of an add-on study for determining DWs stems from the fact that recent DW studies have primarily employed ordinal methods, such as paired comparison and ranking methods [14]. Estimating the DW is relatively straightforward when using cardinal methods like person trade-off, time trade-off, and standard gamble, as they allow for direct comparison with an anchor point, such as death, and can easily incorporate newly added causes of diseases. However, to calculate DW using ordinal methods, a new cause of disease must be compared to an existing cause. Therefore, if additional causes of disease are introduced without a major reorganization of the disease classification system, it is feasible to use an add-on study method for calculating DWs with ordinal methods. This approach is also applicable to DW studies focusing on health states.
- The strength of the add-on study method also underscores the difficulty in recruiting physicians, who frequently serve as participants for estimating DWs related to causes of disease. Numerous DW estimation studies have been conducted reflecting the preferences of the public [13,15,16]; however, this approach is limited, as this population can only evaluate the DW of health states. Consequently, if DWs are to be calculated based directly on the cause of disease, the opinions of health professionals must be incorporated. It is essential to adapt to the anticipated expertise of these professionals to ensure valid paired comparison results, which ultimately affects the sample size for analysis due to the low number of survey participants. In fact, DW studies involving experts tend to have fewer participants than those involving the public [17]. Therefore, updating DWs by merging the results of existing surveys with data from more recent ones, as in the add-on study method, is a promising approach to enhance the efficiency of the DW estimation process.
- It is not uncommon for DWs to require revision, particularly when a new cause of disease emerges, such as COVID-19, which has recently led to a high global disease burden. The calculation of DWs for this cause of disease is in high demand. However, studies calculating DALYs, including those for COVID-19, have replaced DWs with existing causes of disease or health states rather than adding COVID-19 as a specific new disease [18–20]. In the present study, the severity of COVID-19 was subdivided into mild, moderate, and severe. The respective DWs were calculated as 0.110, 0.642, and 0.755 for model 1 and 0.235, 0.419, and 0.493 for model 2. The DWs for COVID-19 in this study were slightly higher than those in previous studies. However, the DW obtained in this study, derived from analyzing physicians’ responses through the direct comparison of COVID-19 to other diseases, is expected to have higher validity.
- When comparing the revised DWs to those found in previous research, the values and patterns observed were generally similar (Pearson correlation, 0.994). The differences between the 2 values were mainly within 0.02, although some were model-specific. Extreme changes in DW can lead to major alterations in years lived with disability, ultimately compromising the ability to obtain a valid DALE measurement. This add-on study method demonstrated the benefit of utilizing existing survey results to obtain the DWs of new causes of disease without causing abrupt changes in the current cause of disease values during DW revision. This finding suggests that DWs can be fine-tuned based on the collective opinions of multiple health professionals, rather than implementing dramatic DW revisions influenced by the preferences or judgments of a limited number of experts.
- Notably, the revised leading causes of disease in the present study were more likely to have DWs segmented by severity. Previous studies typically utilized 3 or 4 levels of severity for primary diseases such as cancer or chronic obstructive pulmonary disease [11]. In the present study, DWs were measured not only for COVID-19 but also by subdividing the severity of kidney and bladder cancer. For diabetes, DWs were calculated by categorizing the severity of each complication type. Preventing chronic diseases entirely is becoming increasingly difficult. It may be more rational to manage a disease at a lower severity and reduce the burden of a specific cause of disease, such as by preventing the development of complications. The severity-disaggregated DWs and severity distributions from this study can be used to calculate years lived with disability more accurately for specific causes of disease [21]. Additionally, monitoring will enable the evaluation of the effectiveness of interventions aimed at preventing disease complications [22,23].
- The limitations of this study include the inherent challenges of surveying experts and the surveyed physicians’ inability to fully represent the views of all physicians in Korea. This recent survey involved approximately 200 physicians, whose insights may have been particularly valuable in determining the DWs for additional or revised disease causes. It is crucial to involve physicians with diverse expertise in future DW surveys to identify the valid causes of disease-related DWs.
DISCUSSION
- This study presents a detailed add-on methodology for revising the DWs of 380 existing causes of disease and estimating DWs of additional causes. This research approach is applicable in Korea and other countries to generate timely DWs. The DWs obtained in this study can be utilized to determine a reasonable disease burden by choosing an appropriate DALE calculation method. Additionally, these DWs can serve as a fundamental variable in calculating healthy life expectancy.
CONCLUSION
SUPPLEMENTAL MATERIALS
ACKNOWLEDGEMENTS
-
CONFLICT OF INTEREST
The authors have no conflicts of interest associated with the material presented in this paper.
-
FUNDING
This study was supported by funds from the Korean Health Promotion Institute (KHEPI) in 2022.
-
AUTHOR CONTRIBUTIONS
Conceptualization: Im D, Mahmudah NA, Yoon SJ, Kim YE, Jung YS, Ock M, Lee DH, Kim Y. Data curation: Im D, Mahmudah NA, Ock M. Formal analysis: Im D, Ock M. Funding acquisition: Yoon SJ. Methodology: Im D, Ock M. Project administration: Im D, Ock M. Visualization: Im D, Ock M. Writing – original draft: Im D, Ock M. Writing – review & editing: Im D, Mahmudah NA, Yoon SJ, Kim YE, Jung YS, Ock M, Lee DH, Kim Y.
Notes

| Characteristics | Present | 20201 | 20192 |
|---|---|---|---|
| Age (y) | |||
| 19–29 | 17 (8.3) | 100 (14.6) | 52 (12.1) |
| 30–39 | 126 (61.5) | 569 (83.1) | 374 (87.0) |
| ≥40 | 62 (30.2) | 16 (2.3) | 4 (0.9) |
|
|
|||
| Sex | |||
| Male | 143 (69.8) | 540 (78.8) | 401 (93.3) |
| Female | 62 (30.2) | 145 (21.2) | 29 (6.7) |
|
|
|||
| Occupation | |||
| General practitioner | 12 (5.9) | 76 (11.1) | 56 (13.0) |
| Resident | 19 (9.3) | 65 (9.5) | 6 (1.4) |
| Specialist | 169 (82.4) | 527 (76.9) | 358 (83.3) |
| Other | 5 (2.4) | 17 (2.5) | 10 (2.3) |
|
|
|||
| Specialty | |||
| Medical | 71 (34.6) | 259 (37.8) | 153 (35.6) |
| Surgical | 44 (21.5) | 190 (27.7) | 60 (14.0) |
| Other | 90 (43.9) | 236 (34.4) | 217 (50.5) |
| Total | 205 (100.0) | 685 (100.0) | 430 (100.0) |
| No. | Cause of disease | Model 11 | Model 22 |
|---|---|---|---|
| 1 | HIV/AIDS - Drug-susceptible tuberculosis | 0.724 | 0.470 |
| 2 | HIV/AIDS - Multidrug-resistant tuberculosis without extensive drug resistance | 0.787 | 0.519 |
| 3 | HIV/AIDS - Extensively drug-resistant tuberculosis | 0.806 | 0.537 |
| 4 | HIV/AIDS resulting in other diseases | 0.752 | 0.491 |
| 5 | Syphilis | 0.432 | 0.326 |
| 6 | Chlamydial infection | 0.327 | 0.292 |
| 7 | Gonococcal infection | 0.315 | 0.289 |
| 8 | Trichomoniasis | 0.330 | 0.293 |
| 9 | Genital herpes | 0.255 | 0.271 |
| 10 | Other sexually transmitted disease | 0.356 | 0.301 |
| 11 | Latent tuberculosis infection | 0.241 | 0.268 |
| 12 | Drug-susceptible tuberculosis | 0.388 | 0.312 |
| 13 | Multidrug-resistant tuberculosis without extensive drug resistance | 0.657 | 0.427 |
| 14 | Extensively drug-resistant tuberculosis | 0.677 | 0.439 |
| 15 | Upper respiratory infections | 0.207 | 0.259 |
| 16 | Lower respiratory infections | 0.329 | 0.293 |
| 17 | Otitis media | 0.191 | 0.255 |
| 18 | Influenza | 0.220 | 0.262 |
| 19 | Pneumococcal pneumonia | 0.418 | 0.322 |
| 20 | H influenza type B pneumonia | 0.442 | 0.330 |
| 21 | Respiratory syncytial virus pneumonia | 0.331 | 0.293 |
| 22 | COVID-19 (mild) | 0.110 | 0.235 |
| 23 | COVID-19 (moderate) | 0.642 | 0.419 |
| 24 | COVID-19 (severe) | 0.755 | 0.493 |
| 25 | Diarrhoeal diseases | 0.176 | 0.251 |
| 26 | Typhoid fever | 0.315 | 0.289 |
| 27 | Paratyphoid fever | 0.388 | 0.311 |
| 28 | Invasive non-typhoidal Salmonella | 0.389 | 0.312 |
| 29 | Other intestinal infectious diseases | 0.273 | 0.276 |
| 30 | Cholera | 0.415 | 0.321 |
| 31 | Other Salmonella infections | 0.318 | 0.290 |
| 32 | Shigellosis | 0.372 | 0.306 |
| 33 | Enteropathogenic E. coli infection | 0.323 | 0.291 |
| 34 | Enterotoxigenic E. coli infection | 0.306 | 0.286 |
| 35 | Campylobacter enteritis | 0.299 | 0.284 |
| 36 | Amoebiasis | 0.422 | 0.323 |
| 37 | Cryptosporidiosis | 0.531 | 0.365 |
| 38 | Rotaviral enteritis | 0.211 | 0.260 |
| 39 | Intestinal infection | 0.262 | 0.273 |
| 40 | Malaria | 0.436 | 0.328 |
| 41 | Chagas disease | 0.548 | 0.373 |
| 42 | Visceral leishmaniasis | 0.416 | 0.321 |
| 43 | Cutaneous and mucocutaneous leishmaniasis | 0.394 | 0.313 |
| 44 | African trypanosomiasis | 0.475 | 0.342 |
| 45 | Schistosomiasis | 0.391 | 0.313 |
| 46 | Cysticercosis | 0.393 | 0.313 |
| 47 | Cystic echinococcosis | 0.395 | 0.314 |
| 48 | Lymphatic filariasis | 0.480 | 0.344 |
| 49 | Onchocerciasis | 0.322 | 0.291 |
| 50 | Trachoma | 0.387 | 0.311 |
| 51 | Dengue | 0.427 | 0.325 |
| 52 | Yellow fever | 0.505 | 0.354 |
| 53 | Rabies | 0.696 | 0.451 |
| 54 | Ascariasis | 0.225 | 0.263 |
| 55 | Trichuriasis | 0.326 | 0.292 |
| 56 | Hookworm disease | 0.234 | 0.266 |
| 57 | Food-borne trematodiases | 0.313 | 0.288 |
| 58 | Leprosy | 0.601 | 0.398 |
| 59 | Tsutsugamushi fever | 0.450 | 0.333 |
| 60 | Typhus fever | 0.435 | 0.328 |
| 61 | Hantaan virus disease | 0.539 | 0.369 |
| 62 | Ebola virus disease | 0.764 | 0.500 |
| 63 | Zika virus disease | 0.509 | 0.356 |
| 64 | Guinea worm disease | 0.352 | 0.300 |
| 65 | Other neglected tropical diseases | 0.383 | 0.310 |
| 66 | Pneumococcal meningitis | 0.600 | 0.397 |
| 67 | H influenzae type B meningitis | 0.607 | 0.401 |
| 68 | Meningococcal infection | 0.546 | 0.372 |
| 69 | Other meningitis | 0.583 | 0.389 |
| 70 | Encephalitis | 0.699 | 0.453 |
| 71 | Diphtheria | 0.362 | 0.303 |
| 72 | Whooping cough | 0.319 | 0.290 |
| 73 | Tetanus | 0.539 | 0.369 |
| 74 | Measles | 0.305 | 0.286 |
| 75 | Varicella and herpes zoster | 0.276 | 0.277 |
| 76 | Legionnaire disease | 0.366 | 0.304 |
| 77 | Leptospirosis | 0.424 | 0.324 |
| 78 | Rubella | 0.362 | 0.303 |
| 79 | Mumps | 0.245 | 0.269 |
| 80 | Acute hepatitis A | 0.365 | 0.304 |
| 81 | Acute hepatitis B | 0.433 | 0.327 |
| 82 | Acute hepatitis C | 0.529 | 0.364 |
| 83 | Acute hepatitis E | 0.501 | 0.353 |
| 84 | Other unspecified infectious diseases | 0.267 | 0.275 |
| 85 | Maternal hemorrhage | 0.576 | 0.386 |
| 86 | Maternal sepsis and other maternal infections | 0.678 | 0.440 |
| 87 | Maternal hypertensive disorders | 0.414 | 0.320 |
| 88 | Maternal obstructed labor and uterine rupture | 0.654 | 0.426 |
| 89 | Maternal abortion and miscarriage | 0.365 | 0.304 |
| 90 | Ectopic pregnancy | 0.395 | 0.314 |
| 91 | Indirect maternal deaths | 0.780 | 0.513 |
| 92 | Late maternal deaths | 0.834 | 0.566 |
| 93 | Maternal deaths aggravated by HIV/AIDS | 0.904 | 0.663 |
| 94 | Other maternal disorders | 0.365 | 0.304 |
| 95 | Neonatal preterm birth complications | 0.581 | 0.388 |
| 96 | Neonatal encephalopathy due to birth asphyxia and trauma | 0.818 | 0.549 |
| 97 | Neonatal sepsis and other neonatal infections | 0.708 | 0.459 |
| 98 | Hemolytic disease and other neonatal jaundice | 0.491 | 0.349 |
| 99 | Other neonatal disorders | 0.520 | 0.360 |
| 100 | Protein-energy malnutrition | 0.421 | 0.323 |
| 101 | Iodine deficiency | 0.225 | 0.263 |
| 102 | Vitamin A deficiency | 0.194 | 0.255 |
| 103 | Iron-deficiency anemia | 0.181 | 0.252 |
| 104 | Other nutritional deficiencies | 0.225 | 0.263 |
| 105 | Lip and oral cavity cancer | 0.774 | 0.509 |
| 106 | Nasopharynx cancer | 0.818 | 0.549 |
| 107 | Other pharynx cancer | 0.797 | 0.528 |
| 108 | Esophageal cancer | 0.885 | 0.632 |
| 109 | Stomach cancer (stage 1) | 0.457 | 0.336 |
| 110 | Stomach cancer (stage 2) | 0.615 | 0.405 |
| 111 | Stomach cancer (stage 3) | 0.794 | 0.526 |
| 112 | Stomach cancer (stage 4) | 0.905 | 0.664 |
| 113 | Colon and rectum cancers (stage 1) | 0.489 | 0.348 |
| 114 | Colon and rectum cancers (stage 2) | 0.646 | 0.421 |
| 115 | Colon and rectum cancers (stage 3) | 0.814 | 0.545 |
| 116 | Colon and rectum cancers (stage 4) | 0.888 | 0.637 |
| 117 | Liver cancer secondary to hepatitis B | 0.759 | 0.496 |
| 118 | Liver cancer secondary to hepatitis C | 0.786 | 0.519 |
| 119 | Liver cancer secondary to alcohol use (stage 1) | 0.598 | 0.396 |
| 120 | Liver cancer secondary to alcohol use (stage 2) | 0.722 | 0.468 |
| 121 | Liver cancer secondary to alcohol use (stage 3) | 0.815 | 0.546 |
| 122 | Liver cancer secondary to alcohol use (stage 4) | 0.911 | 0.675 |
| 123 | Liver cancer due to NASH | 0.774 | 0.508 |
| 124 | Liver cancer due to other causes | 0.786 | 0.519 |
| 125 | Gallbladder and biliary tract cancer | 0.830 | 0.562 |
| 126 | Pancreatic cancer | 0.919 | 0.690 |
| 127 | Larynx cancer | 0.868 | 0.607 |
| 128 | Trachea, bronchus and lung cancers (stage 1) | 0.585 | 0.390 |
| 129 | Trachea, bronchus and lung cancers (stage 2) | 0.715 | 0.464 |
| 130 | Trachea, bronchus and lung cancers (stage 3) | 0.847 | 0.581 |
| 131 | Trachea, bronchus and lung cancers (stage 4) | 0.922 | 0.696 |
| 132 | Malignant skin melanoma | 0.824 | 0.555 |
| 133 | Non-melanoma skin cancer (squamous-cell carcinoma) | 0.636 | 0.416 |
| 134 | Non-melanoma skin cancer (basal cell carcinoma) | 0.656 | 0.427 |
| 135 | Breast cancer (stage 1) | 0.459 | 0.336 |
| 136 | Breast cancer (stage 2) | 0.592 | 0.393 |
| 137 | Breast cancer (stage 3) | 0.769 | 0.504 |
| 138 | Breast cancer (stage 4) | 0.880 | 0.625 |
| 139 | Cervical cancer (stage 1) | 0.419 | 0.322 |
| 140 | Cervical cancer (stage 2) | 0.592 | 0.393 |
| 141 | Cervical cancer (stage 3) | 0.764 | 0.500 |
| 142 | Cervical cancer (stage 4) | 0.880 | 0.624 |
| 143 | Uterine cancer | 0.704 | 0.456 |
| 144 | Ovarian cancer | 0.804 | 0.535 |
| 145 | Prostate cancer (stage 1) | 0.473 | 0.342 |
| 146 | Prostate cancer (stage 2) | 0.601 | 0.397 |
| 147 | Prostate cancer (stage 3) | 0.728 | 0.473 |
| 148 | Prostate cancer (stage 4) | 0.863 | 0.601 |
| 149 | Testicular cancer | 0.746 | 0.486 |
| 150 | Kidney cancer (stage 1) | 0.539 | 0.369 |
| 151 | Kidney cancer (stage 2) | 0.729 | 0.473 |
| 152 | Kidney cancer (stage 3) | 0.854 | 0.589 |
| 153 | Kidney cancer (stage 4) | 0.916 | 0.684 |
| 154 | Bladder cancer (stage 1) | 0.534 | 0.366 |
| 155 | Bladder cancer (stage 2) | 0.630 | 0.412 |
| 156 | Bladder cancer (stage 3) | 0.790 | 0.522 |
| 157 | Bladder cancer (stage 4) | 0.863 | 0.600 |
| 158 | Other urinary organ cancers | 0.737 | 0.479 |
| 159 | Brain and nervous system cancer | 0.875 | 0.618 |
| 160 | Thyroid cancer (stage 1) | 0.276 | 0.277 |
| 161 | Thyroid cancer (stage 2) | 0.467 | 0.339 |
| 162 | Thyroid cancer (stage 3) | 0.619 | 0.407 |
| 163 | Thyroid cancer (stage 4) | 0.802 | 0.533 |
| 164 | Mesothelioma | 0.785 | 0.518 |
| 165 | Hodgkin lymphoma | 0.712 | 0.462 |
| 166 | Non-Hodgkin lymphoma | 0.711 | 0.461 |
| 167 | Multiple myeloma | 0.740 | 0.481 |
| 168 | Acute lymphoid leukemia | 0.811 | 0.542 |
| 169 | Chronic lymphoid leukemia | 0.748 | 0.488 |
| 170 | Acute myeloid leukemia | 0.827 | 0.558 |
| 171 | Chronic myeloid leukemia | 0.769 | 0.504 |
| 172 | Other leukemia | 0.829 | 0.561 |
| 173 | Bone and connective tissue cancer | 0.768 | 0.503 |
| 174 | Benign neoplasm of brain and other parts of central nervous system | 0.507 | 0.355 |
| 175 | Other malignant neoplasms | 0.778 | 0.512 |
| 176 | Myelodysplastic, myeloproliferative, and other hematopoietic neoplasms | 0.751 | 0.490 |
| 177 | Benign and in situ intestinal neoplasms | 0.279 | 0.278 |
| 178 | Benign and in situ cervical and uterine neoplasms | 0.366 | 0.304 |
| 179 | Other benign and in situ neoplasms | 0.216 | 0.261 |
| 180 | Rheumatic heart disease | 0.627 | 0.411 |
| 181 | Stable ischemic heart disease | 0.521 | 0.361 |
| 182 | Unstable angina | 0.630 | 0.412 |
| 183 | Ischemic stroke (mild) | 0.527 | 0.363 |
| 184 | Ischemic stroke (moderate) | 0.782 | 0.515 |
| 185 | Ischemic stroke (severe) | 0.828 | 0.559 |
| 186 | Hemorrhagic and other non-ischemic stroke | 0.798 | 0.530 |
| 187 | Hypertensive heart disease | 0.462 | 0.338 |
| 188 | Non-rheumatic calcific aortic valvular heart disease | 0.652 | 0.425 |
| 189 | Non-rheumatic degenerative mitral valvular heart disease | 0.605 | 0.399 |
| 190 | Other non-rheumatic valvular heart diseases | 0.637 | 0.416 |
| 191 | Myocarditis | 0.649 | 0.423 |
| 192 | Alcoholic cardiomyopathy | 0.629 | 0.412 |
| 193 | Other cardiomyopathy | 0.671 | 0.436 |
| 194 | Atrial fibrillation and flutter | 0.543 | 0.370 |
| 195 | Aortic aneurysm | 0.728 | 0.472 |
| 196 | Peripheral vascular disease | 0.415 | 0.321 |
| 197 | Endocarditis | 0.684 | 0.444 |
| 198 | Other cardiovascular and circulatory diseases | 0.543 | 0.371 |
| 199 | Hemorrhoid | 0.132 | 0.240 |
| 200 | Varicose veins of lower extremities | 0.143 | 0.243 |
| 201 | Chronic obstructive pulmonary disease (mild) | 0.444 | 0.331 |
| 202 | Chronic obstructive pulmonary disease (moderate) | 0.669 | 0.434 |
| 203 | Chronic obstructive pulmonary disease (severe) | 0.771 | 0.506 |
| 204 | Silicosis | 0.669 | 0.435 |
| 205 | Asbestosis | 0.659 | 0.429 |
| 206 | Coal workers’ pneumoconiosis | 0.671 | 0.435 |
| 207 | Other pneumoconiosis | 0.594 | 0.394 |
| 208 | Asthma | 0.409 | 0.318 |
| 209 | Interstitial lung disease and pulmonary sarcoidosis | 0.707 | 0.459 |
| 210 | Other chronic respiratory diseases | 0.503 | 0.354 |
| 211 | Cirrhosis and other chronic liver diseases due to hepatitis B | 0.674 | 0.437 |
| 212 | Cirrhosis and other chronic liver diseases due to hepatitis C | 0.680 | 0.441 |
| 213 | Cirrhosis and other chronic liver diseases due to alcohol use (mild) | 0.512 | 0.357 |
| 214 | Cirrhosis and other chronic liver diseases due to alcohol use (moderate) | 0.640 | 0.418 |
| 215 | Cirrhosis and other chronic liver diseases due to alcohol use (severe) | 0.683 | 0.443 |
| 216 | Cirrhosis and other chronic liver diseases due to NAFLD | 0.540 | 0.369 |
| 217 | Cirrhosis and other chronic liver diseases due to other causes | 0.629 | 0.412 |
| 218 | Peptic ulcer disease | 0.247 | 0.269 |
| 219 | Gastritis and duodenitis | 0.144 | 0.243 |
| 220 | Gastroesophageal reflux disease | 0.126 | 0.239 |
| 221 | Appendicitis | 0.246 | 0.269 |
| 222 | Paralytic ileus and intestinal obstruction | 0.427 | 0.325 |
| 223 | Inguinal, femoral, and abdominal hernia | 0.254 | 0.271 |
| 224 | Inflammatory bowel disease | 0.461 | 0.337 |
| 225 | Vascular intestinal disorders | 0.524 | 0.362 |
| 226 | Gallbladder and biliary diseases | 0.432 | 0.327 |
| 227 | Pancreatitis | 0.454 | 0.335 |
| 228 | Other digestive diseases | 0.198 | 0.256 |
| 229 | Alzheimer disease and other dementias | 0.660 | 0.429 |
| 230 | Parkinson disease | 0.699 | 0.453 |
| 231 | Idiopathic epilepsy | 0.613 | 0.403 |
| 232 | Multiple sclerosis | 0.674 | 0.437 |
| 233 | Motor neuron disease | 0.712 | 0.461 |
| 234 | Migraine | 0.186 | 0.253 |
| 235 | Tension-type headache | 0.180 | 0.252 |
| 236 | Other neurological disorders | 0.483 | 0.346 |
| 237 | Schizophrenia | 0.695 | 0.451 |
| 238 | Major depressive disorder (mild) | 0.312 | 0.288 |
| 239 | Major depressive disorder (moderate) | 0.544 | 0.371 |
| 240 | Major depressive disorder (severe) | 0.585 | 0.390 |
| 241 | Dysthymia | 0.239 | 0.267 |
| 242 | Bipolar disorder | 0.457 | 0.336 |
| 243 | Anxiety disorders | 0.309 | 0.287 |
| 244 | Panic disorder | 0.384 | 0.310 |
| 245 | Obsessive-compulsive disorder | 0.320 | 0.290 |
| 246 | Post-traumatic stress disorder | 0.392 | 0.313 |
| 247 | Anorexia nervosa | 0.402 | 0.316 |
| 248 | Bulimia nervosa | 0.371 | 0.306 |
| 249 | Autism spectrum disorders | 0.520 | 0.361 |
| 250 | Asperger syndrome and other autistic spectrum disorders | 0.488 | 0.348 |
| 251 | Attention-deficit/hyperactivity disorder | 0.230 | 0.265 |
| 252 | Conduct disorder | 0.314 | 0.288 |
| 253 | Idiopathic developmental intellectual disability | 0.458 | 0.336 |
| 254 | Borderline personality disorder | 0.433 | 0.327 |
| 255 | Other mental disorders | 0.486 | 0.347 |
| 256 | Alcohol use disorders | 0.428 | 0.325 |
| 257 | Opioid use disorders | 0.491 | 0.349 |
| 258 | Cocaine use disorders | 0.516 | 0.359 |
| 259 | Amphetamine use disorders | 0.483 | 0.346 |
| 260 | Cannabis use disorders | 0.384 | 0.310 |
| 261 | Other drug use disorders | 0.322 | 0.291 |
| 262 | Diabetes mellitus type 1 without complications | 0.394 | 0.314 |
| 263 | Diabetes mellitus type 1 with complications | 0.632 | 0.413 |
| 264 | Diabetes mellitus type 2 without complications | 0.322 | 0.291 |
| 265 | Diabetes mellitus type 2 with complications | 0.665 | 0.432 |
| 266 | Metabolic syndrome | 0.272 | 0.276 |
| 267 | Chronic kidney disease due to diabetes mellitus type 1 | 0.692 | 0.448 |
| 268 | Chronic kidney disease due to diabetes mellitus type 2 | 0.660 | 0.429 |
| 269 | Chronic kidney disease due to hypertension | 0.610 | 0.402 |
| 270 | Chronic kidney disease due to glomerulonephritis | 0.639 | 0.417 |
| 271 | Chronic kidney disease due to other and unspecified causes | 0.631 | 0.413 |
| 272 | Acute glomerulonephritis | 0.464 | 0.338 |
| 273 | Eczema | 0.134 | 0.241 |
| 274 | Atopic dermatitis | 0.224 | 0.263 |
| 275 | Contact dermatitis | 0.109 | 0.235 |
| 276 | Seborrheic dermatitis | 0.122 | 0.238 |
| 277 | Psoriasis | 0.242 | 0.268 |
| 278 | Cellulitis | 0.231 | 0.265 |
| 279 | Pyoderma | 0.320 | 0.290 |
| 280 | Scabies | 0.181 | 0.252 |
| 281 | Fungal skin diseases | 0.226 | 0.264 |
| 282 | Viral skin diseases | 0.197 | 0.256 |
| 283 | Acne vulgaris | 0.055 | 0.223 |
| 284 | Alopecia areata | 0.131 | 0.240 |
| 285 | Pruritus | 0.104 | 0.234 |
| 286 | Urticaria | 0.102 | 0.233 |
| 287 | Decubitus ulcer | 0.494 | 0.350 |
| 288 | Other skin and subcutaneous diseases | 0.135 | 0.241 |
| 289 | Glaucoma | 0.399 | 0.315 |
| 290 | Cataract | 0.281 | 0.279 |
| 291 | Age-related macular degeneration | 0.404 | 0.317 |
| 292 | Refraction and accommodation disorders | 0.207 | 0.259 |
| 293 | Near vision loss | 0.279 | 0.278 |
| 294 | Other vision loss | 0.601 | 0.398 |
| 295 | Age-related and other hearing loss | 0.274 | 0.277 |
| 296 | Allergic rhinitis | 0.084 | 0.229 |
| 297 | Other sense organ diseases | 0.323 | 0.291 |
| 298 | Rheumatoid arthritis | 0.423 | 0.323 |
| 299 | Osteoarthritis, hip | 0.353 | 0.300 |
| 300 | Osteoarthritis, knee | 0.277 | 0.277 |
| 301 | Osteoarthritis, hand | 0.242 | 0.268 |
| 302 | Osteoarthritis, other | 0.282 | 0.279 |
| 303 | Low back pain (mild) | 0.132 | 0.240 |
| 304 | Low back pain (moderate) | 0.304 | 0.285 |
| 305 | Low back pain (severe) | 0.393 | 0.313 |
| 306 | Neck pain | 0.125 | 0.238 |
| 307 | Gout | 0.341 | 0.296 |
| 308 | Other musculoskeletal disorders | 0.194 | 0.255 |
| 309 | Systemic lupus erythematosus | 0.619 | 0.407 |
| 310 | Neural tube defects | 0.765 | 0.501 |
| 311 | Congenital heart anomalies | 0.690 | 0.447 |
| 312 | Orofacial clefts | 0.491 | 0.349 |
| 313 | Down syndrome | 0.652 | 0.424 |
| 314 | Turner syndrome | 0.563 | 0.379 |
| 315 | Klinefelter syndrome | 0.558 | 0.377 |
| 316 | Other chromosomal abnormalities | 0.650 | 0.423 |
| 317 | Congenital musculoskeletal and limb anomalies | 0.640 | 0.418 |
| 318 | Urogenital congenital anomalies | 0.520 | 0.360 |
| 319 | Digestive congenital anomalies | 0.530 | 0.365 |
| 320 | Other congenital anomalies | 0.590 | 0.392 |
| 321 | Interstitial nephritis and urinary tract infections | 0.409 | 0.319 |
| 322 | Urolithiasis | 0.261 | 0.273 |
| 323 | Benign prostatic hyperplasia | 0.208 | 0.259 |
| 324 | Male infertility | 0.296 | 0.283 |
| 325 | Urinary incontinence | 0.233 | 0.265 |
| 326 | Other urinary diseases | 0.182 | 0.252 |
| 327 | Uterine fibroids | 0.201 | 0.257 |
| 328 | Polycystic ovarian syndrome | 0.382 | 0.310 |
| 329 | Female infertility | 0.305 | 0.286 |
| 330 | Endometriosis | 0.317 | 0.289 |
| 331 | Genital prolapse | 0.379 | 0.308 |
| 332 | Premenstrual syndrome | 0.154 | 0.245 |
| 333 | Other gynecological diseases | 0.251 | 0.270 |
| 334 | Thalassemias | 0.484 | 0.346 |
| 335 | Thalassemia trait | 0.479 | 0.344 |
| 336 | Sickle cell disorders | 0.543 | 0.371 |
| 337 | Sickle cell trait | 0.496 | 0.351 |
| 338 | G6PD deficiency | 0.520 | 0.360 |
| 339 | G6PD trait | 0.526 | 0.363 |
| 340 | Other hemoglobinopathies and hemolytic anemias | 0.470 | 0.340 |
| 341 | Endocrine, metabolic, blood, and immune disorders | 0.438 | 0.329 |
| 342 | Caries of deciduous teeth | 0.067 | 0.225 |
| 343 | Caries of permanent teeth | 0.129 | 0.239 |
| 344 | Periodontal disease | 0.204 | 0.258 |
| 345 | Edentulism and severe tooth loss | 0.465 | 0.339 |
| 346 | Other oral disorders | 0.193 | 0.255 |
| 347 | Sudden infant death syndrome | 0.865 | 0.604 |
| 348 | Pedestrian road injuries | 0.453 | 0.334 |
| 349 | Cyclist road injuries | 0.290 | 0.281 |
| 350 | Motorcyclist road injuries | 0.527 | 0.364 |
| 351 | Motor vehicle road injuries | 0.508 | 0.356 |
| 352 | Other road injuries | 0.318 | 0.289 |
| 353 | Other transport injuries | 0.418 | 0.322 |
| 354 | Falls | 0.415 | 0.321 |
| 355 | Drowning | 0.527 | 0.363 |
| 356 | Fire, heat, and hot substances | 0.399 | 0.315 |
| 357 | Poisoning by carbon monoxide | 0.776 | 0.510 |
| 358 | Poisoning by other means | 0.655 | 0.426 |
| 359 | Unintentional firearm injuries | 0.469 | 0.340 |
| 360 | Unintentional suffocation | 0.686 | 0.445 |
| 361 | Other exposure to mechanical forces | 0.301 | 0.285 |
| 362 | Adverse effects of medical treatment | 0.302 | 0.285 |
| 363 | Venomous animal contact | 0.398 | 0.315 |
| 364 | Non-venomous animal contact | 0.107 | 0.234 |
| 365 | Pulmonary aspiration and foreign body in airway | 0.569 | 0.382 |
| 366 | Foreign body in eyes | 0.117 | 0.237 |
| 367 | Foreign body in other body part | 0.161 | 0.247 |
| 368 | Environmental heat and cold exposure | 0.247 | 0.269 |
| 369 | Exposure to forces of nature | 0.249 | 0.270 |
| 370 | Other unintentional injury | 0.249 | 0.270 |
| 371 | Self-harm by firearm | 0.574 | 0.384 |
| 372 | Self-harm by other specified means | 0.548 | 0.372 |
| 373 | Physical violence by firearm | 0.531 | 0.365 |
| 374 | Physical violence by sharp object | 0.276 | 0.277 |
| 375 | Sexual violence | 0.520 | 0.360 |
| 376 | Physical violence by other means | 0.265 | 0.274 |
| 377 | Conflict and terrorism | 0.516 | 0.359 |
| 378 | Police conflict or execution | 0.550 | 0.373 |
| Mean | 0.488 | 0.369 |
HIV/AIDS, human immunodeficiency virus/acquired immune deficiency syndrome; COVID-19, coronavirus disease 2019; NASH, nonalcoholic fatty liver disease; NAFLD, nonalcoholic fatty liver disease; G6PD, glucose 6-phosphate dehydrogenase.
1 Based on a normal distribution.
2 Based on the natural logarithm.
- 1. Ock M, Ko S, Lee HJ, Jo MW. Review of issues for disability weight studies. Health Policy Manag 2016;26(4):352-358. (Korean)Article
- 2. Kim YE, Jung YS, Ock M, Yoon SJ. A review of the types and characteristics of healthy life expectancy and methodological issues. J Prev Med Public Health 2022;55(1):1-9ArticlePubMedPMCPDF
- 3. Kim YE, Jung YS, Ock M, Yoon SJ. DALY estimation approaches: understanding and using the incidence-based approach and the prevalence-based approach. J Prev Med Public Health 2022;55(1):10-18ArticlePubMedPMCPDF
- 4. Salomon JA, Vos T, Hogan DR, Gagnon M, Naghavi M, Mokdad A, et al. Common values in assessing health outcomes from disease and injury: disability weights measurement study for the Global Burden of Disease Study 2010. Lancet 2012;380(9859):2129-2143PubMedPMC
- 5. Salomon JA, Haagsma JA, Davis A, de Noordhout CM, Polinder S, Havelaar AH, et al. Disability weights for the Global Burden of Disease 2013 study. Lancet Glob Health 2015;3(11):e712-e723ArticlePubMed
- 6. GBD 2019 Diseases and Injuries Collaborators. Global burden of 369 diseases and injuries in 204 countries and territories, 1990–2019: a systematic analysis for the Global Burden of Disease Study 2019. Lancet 2020;396(10258):1204-1222PubMedPMC
- 7. Oh IH, Ock M, Jang SY, Go DS, Kim YE, Jung YS, et al. Years of life lost attributable to COVID-19 in high-incidence countries. J Korean Med Sci 2020;35(32):e300ArticlePubMedPMCPDF
- 8. Jo MW, Go DS, Kim R, Lee SW, Ock M, Kim YE, et al. The burden of disease due to COVID-19 in Korea using disability-adjusted life years. J Korean Med Sci 2020;35(21):e199ArticlePubMedPMCPDF
- 9. Ock M, Park B, Park H, Oh IH, Yoon SJ, Cho B, et al. Disability weights measurement for 289 causes of disease considering disease severity in Korea. J Korean Med Sci 2019;34(Suppl 1):e60ArticlePubMedPMCPDF
- 10. Kim YE, Jo MW, Park H, Oh IH, Yoon SJ, Pyo J, et al. Updating disability weights for measurement of healthy life expectancy and disability-adjusted life year in Korea. J Korean Med Sci 2020;35(27):e219ArticlePubMedPMCPDF
- 11. Ock M, Yi N, Ahn J, Jo MW. How many alternatives can be ranked? A comparison of the paired comparison and ranking methods. Value Health 2016;19(5):655-660ArticlePubMed
- 12. Ock M, Lee JY, Oh IH, Park H, Yoon SJ, Jo MW. Disability weights measurement for 228 causes of disease in the Korean Burden of Disease Study 2012. J Korean Med Sci 2016;31(Suppl 2):S129-S138ArticlePubMedPMCPDF
- 13. Ock M, Ahn J, Yoon SJ, Jo MW. Estimation of disability weights in the general population of South Korea using a paired comparison. PLoS One 2016;11(9):e0162478ArticlePubMedPMC
- 14. Ali S, Ronaldson S. Ordinal preference elicitation methods in health economics and health services research: using discrete choice experiments and ranking methods. Br Med Bull 2012;103(1):21-44ArticlePubMed
- 15. Nomura S, Yamamoto Y, Yoneoka D, Haagsma JA, Salomon JA, Ueda P, et al. How do Japanese rate the severity of different diseases and injuries?-an assessment of disability weights for 231 health states by 37,318 Japanese respondents. Popul Health Metr 2021;19(1):21ArticlePubMedPMCPDF
- 16. Haagsma JA, Maertens de Noordhout C, Polinder S, Vos T, Havelaar AH, Cassini A, et al. Assessing disability weights based on the responses of 30,660 people from four European countries. Popul Health Metr 2015;13: 10ArticlePubMedPMCPDF
- 17. Charalampous P, Polinder S, Wothge J, von der Lippe E, Haagsma JA. A systematic literature review of disability weights measurement studies: evolution of methodological choices. Arch Public Health 2022;80(1):91ArticlePubMedPMCPDF
- 18. Fan CY, Fann JC, Yang MC, Lin TY, Chen HH, Liu JT, et al. Estimating global burden of COVID-19 with disability-adjusted life years and value of statistical life metrics. J Formos Med Assoc 2021;120(Suppl 1):S106-S117ArticlePubMedPMC
- 19. Cuschieri S, Calleja N, Devleesschauwer B, Wyper GM. Estimating the direct Covid-19 disability-adjusted life years impact on the Malta population for the first full year. BMC Public Health 2021;21(1):1827ArticlePubMedPMCPDF
- 20. Haneef R, Fayad M, Fouillet A, Sommen C, Bonaldi C, Wyper GM, et al. Direct impact of COVID-19 by estimating disability-adjusted life years at national level in France in 2020. PLoS One 2023;18(1):e0280990ArticlePubMedPMC
- 21. Ock M, Jo MW, Gong YH, Lee HJ, Lee J, Sim CS. Estimating the severity distribution of disease in South Korea using EQ-5D-3L: a cross-sectional study. BMC Public Health 2016;16: 234ArticlePubMedPMC
- 22. Lee SA, Park H, Kim W, Song SO, Lim H, Chun SY. The effect of chronic disease management program on the risk of complications in patients with hypertension in Korea. J Korean Med Sci 2022;37(31):e243ArticlePubMedPMCPDF
- 23. Ahmed S, Ware P, Visca R, Bareil C, Chouinard MC, Desforges J, et al. The prevention and management of chronic disease in primary care: recommendations from a knowledge translation meeting. BMC Res Notes 2015;8: 571ArticlePubMedPMC
REFERENCES
Figure & Data
References
Citations
- Trends in Healthy Life Expectancy (HALE) and Disparities by Income and Region in Korea (2008–2020): Analysis of a Nationwide Claims Database
Yoon-Sun Jung, Young-Eun Kim, Minsu Ock, Seok-Jun Yoon
Journal of Korean Medical Science.2024;[Epub] CrossRef - Measuring the Burden of Disease in Korea Using Disability-Adjusted Life Years (2008–2020)
Yoon-Sun Jung, Young-Eun Kim, Minsu Ock, Seok-Jun Yoon
Journal of Korean Medical Science.2024;[Epub] CrossRef
 PubReader
 ePub Link
 Cite
Cite