
Articles
- Page Path
- HOME > J Prev Med Public Health > Volume 56(4); 2023 > Article
-
Original Article
Analysis of the Incidence of Macrosomia in Japan by Parental Nationalities at 5-year Intervals From 1995 to 2020 -
Tasuku Okui

-
Journal of Preventive Medicine and Public Health 2023;56(4):348-356.
DOI: https://doi.org/10.3961/jpmph.23.133
Published online: July 3, 2023
Medical Information Center, Kyushu University Hospital, Fukuoka, Japan
- Corresponding author: Tasuku Okui, Medical Information Center, Kyushu University Hospital, 3-1-1 Maidashi, Higashi-ku, Fukuoka 812-8582, Japan, E-mail: task10300@gmail.com
• Received: March 14, 2023 • Accepted: June 26, 2023
Copyright © 2023 The Korean Society for Preventive Medicine
This is an Open Access article distributed under the terms of the Creative Commons Attribution Non-Commercial License (https://creativecommons.org/licenses/by-nc/4.0/) which permits unrestricted non-commercial use, distribution, and reproduction in any medium, provided the original work is properly cited.
ABSTRACT
-
Objectives
- We investigated trends in the incidence rate of macrosomia and its association with parental nationalities using Vital Statistics data in Japan.
-
Methods
- We used singleton birth data every 5 years from 1995 to 2020. The incidence rate of macrosomia was calculated according to specific attributes (maternal age, infant’s sex, parental nationalities, parity, and household occupation) over time (years). In addition, a log-binomial model was used to investigate the relationship between the incidence of macrosomia and the attributes. This study compared Korea, China, the Philippines, Brazil, and other countries with Japan in terms of parental nationalities. “Other countries” indicates countries except for Japan, Korea, China, the Philippines, and Brazil.
-
Results
- The study included 6 180 787 births. The rate of macrosomia in Japan decreased from 1.43% in 1995 to 0.88% in 2020, and the decrease was observed across all parental nationalities. The rates for Japanese parents were the lowest values among parental nationalities during the timespan investigated. Multivariate regression analysis showed that mothers from Korea, China, the Philippines, Brazil, and other countries had a significantly higher risk of macrosomia than those from Japan (risk ratio, 1.91, 2.82, 1.59, 1.74, and 1.64, respectively). Furthermore, fathers from China, the Philippines, Brazil, and other countries had a significantly higher risk of macrosomia than those from Japan (risk ratio, 1.66, 1.38, 1.88, and 3.02, respectively).
-
Conclusions
- The rate of macrosomia decreased from 1995 to 2020 in Japan for parents of all nationalities, and the risk of macrosomia incidence was associated with parental nationality.
- Macrosomia is an adverse birth outcome, and it is associated with maternal health issues, such as cesarean section, postpartum hemorrhage, and the incidence of type 2 diabetes [1,2]. Furthermore, it is known that macrosomic infants have a higher risk of birth trauma, sepsis, and neonatal or infant mortality [3–5], and they tend to become overweight or obese early in childhood [6]. Therefore, it is important to understand the incidence rate and associated risk factors.
- Some studies in Japan [7–9] have investigated characteristics associated with macrosomia and identified several risk factors, such as a male fetus, multiparity, pre-pregnancy body mass index (BMI), and weight gain during pregnancy. In addition, the incidence rate of macrosomia from 1969 to 1981 was investigated using Vital Statistics data [10]. However, a study surveying the incidence of macrosomia and its attributes using national data has not been conducted in recent years. In addition, an association of macrosomia with parental nationality has not been studied yet. In Japan, it is known that the rate of preterm birth or infant mortality varies depending on maternal nationality [11,12], and the rate of macrosomia may vary depending on parental nationality. Studies in other countries have demonstrated that immigrant mothers have a higher risk of bearing macrosomic infants [13,14]. Moreover, trends in the incidence rate of macrosomia have not been examined in recent years in Japan, and these trends may differ depending on the attributes of infants and parents.
- In this study, we investigated the incidence of macrosomia over time and its association with parental nationalities using Vital Statistics data from Japan.
INTRODUCTION
- We used birth data from Vital Statistics every 5 years from 1995 to 2020. Data were provided by the Ministry of Health, Labor, and Welfare on September 14, 2022 on the basis of Article 33 of the Statistics Act in Japan. We used data on the infant’s sex, whether the infant was a single birth or one of multiple births, the infant’s gestational age, and its birthweight; data on the mother’s age, parity, and nationality; and data on household occupation, paternal age, and paternal nationality. Macrosomia was defined as newborns weighing 4000 g or more at birth. Parity was categorized into primiparous and multiparous. Household occupation consisted of farmer, self-employed, full-time worker 1 (worker in a company with 99 or fewer employees), full-time worker 2 (worker in a company with 100 or more employees), and other occupations. As parental nationalities, Japan, Korea, China, the Philippines, Thailand, the United States, the United Kingdom, Brazil, Peru, and other countries were available. We grouped Thailand, the United States, the United Kingdom, and Peru into the category of “other countries” because the number of births was relatively small. We classified maternal and paternal ages as <20 years, 20–24 years, 25–29 years, 30–34 years, 35–39 years, and 40 years or more.
- We tallied the number of births by each attribute for each of the analyzed years. The rate of macrosomia was calculated according to these attributes and years. Moreover, the parental age-adjusted incidence rate of macrosomia was calculated for each maternal and paternal nationality by the direct standardization method, using total births in 2020 as the standard population. Maternal and paternal ages were used for calculating the age-adjusted rates of maternal and paternal nationalities, respectively. In the calculation of paternal age-adjusted rate, a combined group “≤24 years” was used instead of “<20 years” and “20–24 years” because the “<20 years” group had zero births for some nationalities in 1995. Furthermore, the log-binomial model was used to evaluate a link between the incidence of macrosomia and the attributes. The statistical model of the log-binomial model is as follows:
- pi indicates the incidence rate of macrosomia for birth i; β0, intercept; J, number of explanatory variables; Kj, number of categories for jth explanatory variable; xijk, dummy variable for kth category of jth explanatory variable for birth i; and βjk, regression coefficient for kth category of jth explanatory variable. βjk is zero for the reference category in each of the explanatory variables. The risk ratio (RR) for the kth category of the jth explanatory variable can be expressed as exp (βjk ) in the model. The explanatory variables included the year, infant’s sex, maternal age group, paternal age group, parity, maternal nationality, paternal nationality, and household occupation. The respective reference values were “1995,” “female,” “30–34 years,” “30–34 years,” “primiparous,” “Japan,” “Japan,” and “full-time worker 2.” Each attribute’s RR, 95% confidence interval (CI), and p-value were calculated. A p-value <0.05 was defined as statistically significant.
- We restricted the study population to singleton births. Furthermore, because we considered paternal nationality, we only included infants born within a marriage. Complete-case analysis was conducted for dealing with missing data. In addition, the multiple imputation method was adapted for sensitivity analysis using mice [15], and variables with missing values (household occupation, birthweight, maternal age group, and paternal age group) were imputed. Predictive mean matching was an imputation method in the multiple imputation, and 10 imputed datasets were generated in the analysis. Statistical analyses were conducted using R version 4.1.3 (R Foundation for Statistical Computing, Vienna, Austria). The statistics shown in this study were prepared by the author using the Vital Statistics data; these are not the statistics published by the Ministry of Health, Labor, and Welfare.
- Ethics Statement
- This study was conducted in accordance with the Statistics Act with the permission of the Ministry of Health, Labor, and Welfare and was approved by the ethical committee of our institution (No. 22221-01). In addition, informed consent was not required because we used the official statistics data that were provided from the government on the basis of the Statistics Act.
METHODS
- Figure 1 shows the flowchart for selecting the study population. In total, 6 180 787 births were used in the analysis.
- Table 1 shows the number of births by the infants’ characteristics and the year. The majority of births were from households with a full-time worker 1 or a full-time worker 2, and with Japanese fathers or mothers. The number of births from Korean fathers and mothers decreased over the years, whereas the number of births from Chinese fathers and mothers increased.
- Table 2 shows the rate of macrosomia (%) by the infants’ characteristics and the year. The rate of macrosomia in Japan decreased from 1.43% in 1995 to 0.88% in 2020, and the decrease was identified in all attributes. They fell between 1995 and 2015; an obvious decline was observed from 1995 to 2010. The rate of macrosomia was high among male infants and mothers with multiple pregnancies or of older age, and among household types, it was highest for farmer or unemployed households across the years studied. The rates of macrosomia in Japanese mothers and fathers were smaller than 1% in recent years and was the lowest over time among parental nationalities. The rates in mothers and fathers from China and other countries tended to be the highest, larger than 3% in most cases.
- Table 3 presents the results of the macrosomia incidence rate by maternal and paternal nationalities, adjusted for parental age; the adjusted and crude rates were similar. The incidence rate of macrosomia was the lowest in Japanese mothers and fathers when considering parental nationalities over time, and a decreasing trend from 1995 to 2020 was observed regardless of nationality.
- Table 4 depicts a multivariate regression analysis for investigating factors linked with macrosomia. Older maternal and paternal ages, male infants, and multiparity were statistically significantly associated with macrosomia. Households with a full-time worker 2 had a significantly lower risk compared with the other households. In addition, mothers from Korea, China, the Philippines, Brazil, and other countries had a significantly higher risk of macrosomia than those from Japan (RR, 1.91, 2.82, 1.59, 1.74, and 1.64, respectively). Furthermore, fathers from China, the Philippines, Brazil, and other countries had a significantly higher risk of macrosomia than those from Japan (RR, 1.66, 1.38, 1.88, and 3.02, respectively).
- Supplemental Material 1 shows the number of births and the percentage for each category of household occupation, birthweight, maternal age group, and paternal age group for the imputed datasets used in the sensitivity analysis. The imputed data were similar to the unimputed data because the percentages of missing data were low for those variables.
- Supplemental Material 2 shows the results of multivariate regression analysis using multiple imputations to investigate factors associated with macrosomia. The result was similar to that of the complete-case analysis.
RESULTS
- We investigated the epidemiology of macrosomia incidence in Japan, and an association between parental nationality and macrosomia was discovered for the first time in Japan. In this section, we link the results of this research with previous studies.
- It was demonstrated that the rate of macrosomia decreased from 1995 to 2020 regardless of maternal nationalities, and a decreasing trend was identified particularly from 1995 to 2010 in Japanese mothers. It is known that the mean birthweight in Japan decreased from 3152 g in 1979 to 3018 g in 2010 [16]. Furthermore, it is known that the low birthweight rate increased until around 2010 and then decreased [17]. As a result, it is likely that the change in mean birthweight in Japan affected the rate of macrosomia. An increase in the proportion of females with low BMI among the young population and more emphasis on weight control during pregnancy may have decreased the mean birthweight in Japan from 1980 to 2010 [16,18]. Low gestational weight gain was noted as a factor for the temporal variation in the rate of macrosomia in Korea as well [19]. Moreover, the shortening of gestational periods due to an increase in cases of cesarean section was pointed out as another factor for the trend in birthweight in Japan [18]. These tendencies might also have been true for non-Japanese females in Japan. In contrast, there was a subtle increase in the rate of macrosomia from 2015 to 2020; in this study, the incidence rate of macrosomia increased among younger mothers and fathers from 2010 to 2020. It is possible that a change in physical characteristics, such as BMI, among younger individuals was associated with the result. Regarding the trend in rate of macrosomia for each parent by their nationality, it is considered that the trend for each maternal nationality is related to that of the mother’s homeland. In Korea, it is known that the mean birthweight decreased from 3360 g in 1993 to 3200 g in 2016 [20], and the rate of macrosomia decreased from 3.7% in 2000 to 2.5% in 2020 [19]. In China, a decrease in the rate of macrosomia was found from 4.0% in 2005 to 2.5% in 2017 in one region [21], whereas an increase in the rate was observed from 6.00% in 1994 to 7.83% in 2005 in another region [22]. In Brazil, the incidence rate of macrosomia decreased from 5.6% in 2001 to 5.1% in 2010 [23]. No data were available for the Philippines.
- In addition, we found that the risk of macrosomia for non-Japanese mothers was higher than that for Japanese mothers, whose rate was smaller than 1% in recent years. It is well known that among Asian countries, the rate of macrosomia in Japan was low, smaller than 1% in many studies, while the rate in China was high, higher than 6% in many studies [24]. This tendency was consistent with our study’s findings. It was shown in a previous study that the incidence rate of low birthweight is higher for Japanese mothers than for non-Japanese mothers in Japan [12], and the tendency for low birth weight in Japanese mothers is considered to be a reason. Japanese mothers’ babies have lower birth weights than babies with mothers of other Asian nationalities in the United States [25], and factors such as pre-pregnancy weight and gestational weight gain were considered as possible causes. Maternal BMI is a major factor affecting the trend of birthweight in Japan [16], and low BMI among mothers may be a reason for the decrease in birthweight in Japan. In addition, gestational diabetes is a risk factor for macrosomia [26]. In the United States, it was shown that Japanese mothers had a low rate of gestational diabetes compared with foreign-born mothers of other nationalities [27], and it is possible that the risk of gestational diabetes may differ by nationality in Japan as well. Moreover, genetic factors in mothers and infants have been associated with variations in infant birthweight [28,29], and it is possible that differences by maternal nationality in genetic factors related to diseases or BMI affected birthweight within our study’s scope. Regarding a link with paternal nationality, the risk for macrosomia for fathers from China, the Philippines, Brazil, and other countries was higher compared with those from Japan. Because paternal BMI and height are known to positively affect birthweight [30,31], they are potential causes. The height of Japanese males is relatively low among worldwide countries [32], and it is known that the average BMI for Japanese males is not high when considered worldwide [33].
- Other factors may confound the relationship between parental nationality and macrosomia in Japan. Difficulties for immigrant females in Japan during the perinatal period [34] include a lack of access to services, lack of support, and difficulties in Japanese communication. Lesser access to medical care or lack of support might lead to insufficient management of blood glucose levels or gestational bodyweight gain among non-Japanese mothers. Prenatal visits were shown to be effective for glycemic control in pregnant females with type 2 or gestational diabetes in the United States [35]. Low economic status has been noted as another difficulty for immigrant females in Japan [34]. Lower socioeconomic status was suggested as a possible factor for a higher risk of macrosomia among immigrant mothers in Italy [13], and a higher educational level among pregnant females was associated with a lower risk of gestational diabetes in China [36].
- An association between macrosomia and other attributes also merits discussion. Male infants, multiparity, and older maternal and paternal ages were associated with a higher rate of macrosomia. Male infants and multiparity are known to be risk factors for macrosomia in Japan [7], and older maternal and paternal ages are also known to be risk factors [37]. Regarding household occupation, the rate of macrosomia in unemployed households tended to be high in recent years, probably because of low socioeconomic status. In contrast, households with farmers had the highest risk in the regression analysis. It is known that the mean birthweight is high among farmer households in Japan, and its family structure is pointed out as a factor [38].
- It was discovered that the risk of macrosomia differed depending primarily on maternal nationality, and glycemic control or governance of gestational weight gain might be more important for non-Japanese mothers [8,39]. Improving access to medical care or support for non-Japanese mothers may help to alleviate disparities. In addition, it is important to compare the physical and socioeconomic characteristics of mothers by nationality to understand the reasons for the difference in the future. It is also true that some macrosomia prevention measures are required for non-Japanese males.
- There are some limitations in this study. We used data from Japan’s Vital Statistics, and data on several factors associated with macrosomia, such as BMI, smoking status, and pregnancy complications, were unavailable. Epidemiological studies are needed to take into account these factors. In addition, we used data on household occupation, but data on parental educational level or income were not available. In the future, it will be useful to use a wider range of socioeconomic factors in order to verify the association between parental nationality and socioeconomic status among birth data.
DISCUSSION
SUPPLEMENTAL MATERIALS
ACKNOWLEDGEMENTS
-
CONFLICT OF INTEREST
The author has no conflicts of interest associated with the material presented in this paper.
-
AUTHOR CONTRIBUTIONS
All work was done by TO.
-
FUNDING
This study was supported by JSPS KAKENHI Grant No. JP22 K17372.
Notes
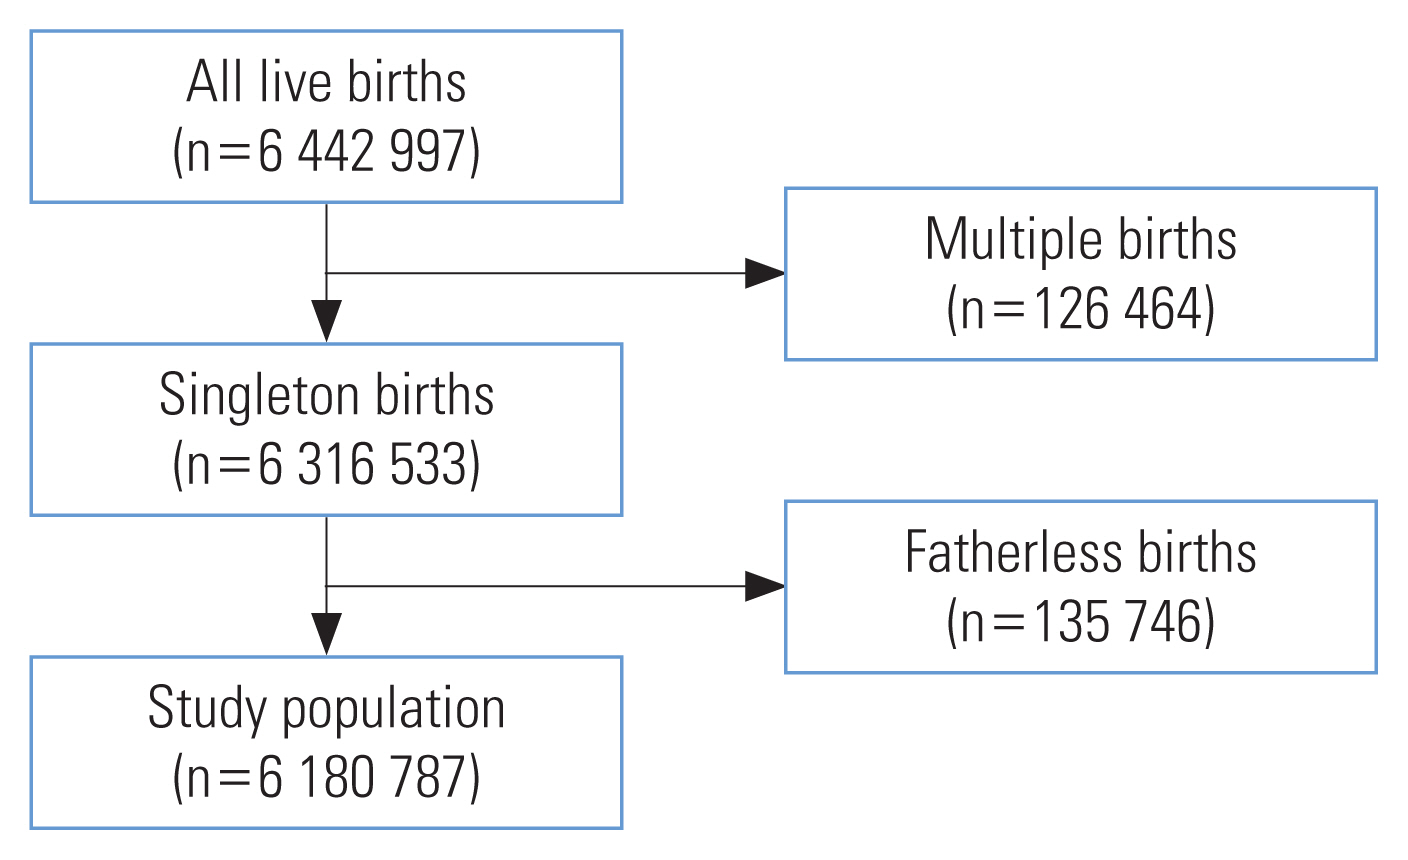
Table 1Number of births (%) by the infants’ characteristics and years
Table 2Rate of macrosomia (%) by the infants’ characteristics and year
Table 3Parental age-adjusted rate of macrosomia by maternal and paternal nationalities
Table 4Multivariate regression analysis for investigating factors associated with macrosomia
- 1. Miller C, Lim E. The risk of diabetes after giving birth to a macrosomic infant: data from the NHANES cohort. Matern Health Neonatol Perinatol 2021;7(1):12ArticlePubMedPMCPDF
- 2. Beta J, Khan N, Fiolna M, Khalil A, Ramadan G, Akolekar R. Maternal and neonatal complications of fetal macrosomia: cohort study. Ultrasound Obstet Gynecol 2019;54(3):319-325ArticlePubMedPDF
- 3. Said AS, Manji KP. Risk factors and outcomes of fetal macrosomia in a tertiary centre in Tanzania: a case-control study. BMC Pregnancy Childbirth 2016;16(1):243ArticlePubMedPMCPDF
- 4. Cheng YK, Lao TT. Fetal and maternal complications in macrosomic pregnancies. Res Rep Neonatol 2014;4: 65-70
- 5. Cho KH, Yoon SJ, Lim J, Eun H, Park MS, Park KI, et al. Epidemiology of macrosomia in Korea: growth and development. J Korean Med Sci 2021;36(47):e320ArticlePubMedPMCPDF
- 6. Gu S, An X, Fang L, Zhang X, Zhang C, Wang J, et al. Risk factors and long-term health consequences of macrosomia: a prospective study in Jiangsu Province, China. J Biomed Res 2012;26(4):235-240ArticlePubMedPMC
- 7. Morikawa M, Cho K, Yamada T, Yamada T, Sato S, Minakami H. Fetal macrosomia in Japanese women. J Obstet Gynaecol Res 2013;39(5):960-965ArticlePubMed
- 8. Uchinuma H, Tsuchiya K, Sekine T, Horiuchi S, Kushima M, Otawa S, et al. Gestational body weight gain and risk of low birth weight or macrosomia in women of Japan: a nationwide cohort study. Int J Obes (Lond) 2021;45(12):2666-2674ArticlePubMedPMCPDF
- 9. Enomoto K, Aoki S, Toma R, Fujiwara K, Sakamaki K, Hirahara F. Pregnancy outcomes based on pre-pregnancy body mass index in Japanese women. PLoS One 2016;11(6):e0157081ArticlePubMedPMC
- 10. Makino S, Omori M, Aoyama M, Miyata S. Changes in the distribution of live birth weight in Japan. Nihon Eiseigaku Zasshi 1985;40(4):756-762. (Japanese)ArticlePubMed
- 11. Yamaoka Y, Morisaki N, Noguchi H, Takahashi H, Tamiya N. Comprehensive assessment of risk factors of cause-specific infant deaths in Japan. J Epidemiol 2018;28(6):307-314ArticlePubMedPMC
- 12. Okui T, Sato Y, Morokuma S, Nakashima N. Association of maternal nationality with preterm birth and low birth weight rates: analysis of nationwide data in Japan from 2016 to 2020. Matern Health Neonatol Perinatol 2023;9(1):3ArticlePubMedPMCPDF
- 13. De Curtis M, Villani L, Polo A. High risk of macrosomia in newborns of immigrant mothers. Ital J Pediatr 2020;46(1):8ArticlePubMedPMCPDF
- 14. Lee JE, Yoon HJ, Jang YR, Ko HS. Term low birth weight or macrosomia among immigrant mothers in Korea. Perinatology 2020;31(4):179-185ArticlePDF
- 15. Van Buuren S, Groothuis-Oudshoorn K. Mice: multivariate imputation by chained equations in R. J Stat Softw 2013;45(3):1-67
- 16. Takemoto Y, Ota E, Yoneoka D, Mori R, Takeda S. Japanese secular trends in birthweight and the prevalence of low birthweight infants during the last three decades: a population-based study. Sci Rep 2016;6: 31396ArticlePubMedPMCPDF
- 17. Mine T, Tsuboi S, Fukushima F. Twenty-year trends of low birth weight in Japan: a joinpoint regression analysis of data from 2000 to 2019. Front Reprod Health 2021;3: 772575ArticlePubMedPMC
- 18. Yoshida H. Current trends in low birth weight infants in Japan. J Natl Inst Public Health 2014;63(1):216. (Japanese)
- 19. Hur YM. Secular trends of birth weight in twins and singletons in South Korea from 2000 to 2020. Twin Res Hum Genet 2023: 1-6Article
- 20. Kim HE, Song IG, Chung SH, Choi YS, Bae CW. Trends in birth weight and the incidence of low birth weight and advanced maternal age in Korea between 1993 and 2016. J Korean Med Sci 2019;34(4):e34ArticlePubMedPMCPDF
- 21. Rao J, Fan D, Wu S, Lin D, Zhang H, Ye S, et al. Trend and risk factors of low birth weight and macrosomia in south China, 2005–2017: a retrospective observational study. Sci Rep 2018;8(1):3393ArticlePubMedPMCPDF
- 22. Lu Y, Zhang J, Lu X, Xi W, Li Z. Secular trends of macrosomia in southeast China, 1994–2005. BMC Public Health 2011;11: 818ArticlePubMedPMCPDF
- 23. Nascimento MI, Pereira DF, Lopata C, Oliveira CL, Moura AA, Mattos MJ, et al. Trends in the prevalence of live macrosomic newborns according to gestational age strata, in Brazil, 2001–2010, and 2012–2014. Rev Bras Ginecol Obstet 2017;39(8):376-383ArticlePubMedPMC
- 24. Harvey L, van Elburg R, van der Beek EM. Macrosomia and large for gestational age in Asia: one size does not fit all. J Obstet Gynaecol Res 2021;47(6):1929-1945ArticlePubMedPDF
- 25. Morisaki N, Kawachi I, Oken E, Fujiwara T. Parental characteristics can explain why Japanese women give birth to the smallest infants in the United States. Paediatr Perinat Epidemiol 2016;30(5):473-478ArticlePubMedPMC
- 26. Kc K, Shakya S, Zhang H. Gestational diabetes mellitus and macrosomia: a literature review. Ann Nutr Metab 2015;66(Suppl 2):14-20ArticlePDF
- 27. Hedderson MM, Darbinian JA, Ferrara A. Disparities in the risk of gestational diabetes by race-ethnicity and country of birth. Paediatr Perinat Epidemiol 2010;24(5):441-448ArticlePubMedPMC
- 28. Lunde A, Melve KK, Gjessing HK, Skjaerven R, Irgens LM. Genetic and environmental influences on birth weight, birth length, head circumference, and gestational age by use of population-based parent-offspring data. Am J Epidemiol 2007;165(7):734-741ArticlePubMed
- 29. Hur YM. Genetic and environmental influences on birthweight in a sample of Korean twins. J Korean Med Sci 2005;20(3):355-360ArticlePubMedPMC
- 30. Derraik JG, Pasupathy D, McCowan LM, Poston L, Taylor RS, Simpson NA, et al. Paternal contributions to large-for-gestational-age term babies: findings from a multicenter prospective cohort study. J Dev Orig Health Dis 2019;10(5):529-535ArticlePubMed
- 31. Takagi K, Iwama N, Metoki H, Uchikura Y, Matsubara Y, Matsubara K, et al. Paternal height has an impact on birth weight of their offspring in a Japanese population: the Japan Environment and Children’s Study. J Dev Orig Health Dis 2019;10(5):542-554ArticlePubMed
- 32. Wardle J, Haase AM, Steptoe A. Body image and weight control in young adults: international comparisons in university students from 22 countries. Int J Obes (Lond) 2006;30(4):644-651ArticlePubMedPDF
- 33. NCD Risk Factor Collaboration (NCD-RisC). Trends in adult body-mass index in 200 countries from 1975 to 2014: a pooled analysis of 1698 population-based measurement studies with 19·2 million participants. Lancet 2016;387(10026):1377-1396ArticlePubMedPMC
- 34. Kita S, Minatani M, Hikita N, Matsuzaki M, Shiraishi M, Haruna M. A systematic review of the physical, mental, social, and economic problems of immigrant women in the perinatal period in Japan. J Immigr Minor Health 2015;17(6):1863-1881ArticlePubMedPDF
- 35. Carter EB, Tuuli MG, Odibo AO, Macones GA, Cahill AG. Prenatal visit utilization and outcomes in pregnant women with type II and gestational diabetes. J Perinatol 2017;37(2):122-126ArticlePubMedPDF
- 36. Song L, Shen L, Li H, Liu B, Zheng X, Zhang L, et al. Socio-economic status and risk of gestational diabetes mellitus among Chinese women. Diabet Med 2017;34(10):1421-1427ArticlePubMedPDF
- 37. Chung YH, Hwang IS, Jung G, Ko HS. Advanced parental age is an independent risk factor for term low birth weight and macrosomia. Medicine (Baltimore) 2022;101(26):e29846ArticlePubMedPMC
- 38. Furuta M, Hirosige Y, Doi T, Sone T, Matsuda S, Kahyo H. Main household occupation and mean birth weight in Japan 1984. J UOEH 1994;16(1):43-52. (Japanese)ArticlePubMed
- 39. Page RC, Kirk BA, Fay T, Wilcox M, Hosking DJ, Jeffcoate WJ. Is macrosomia associated with poor glycaemic control in diabetic pregnancy? Diabet Med 1996;13(2):170-174ArticlePubMed
REFERENCES
Figure & Data
References
Citations
Citations to this article as recorded by 
- Comparisons of the Rates of Large-for-Gestational-Age Newborns between Women with Diet-Controlled Gestational Diabetes Mellitus and Those with Non-Gestational Diabetes Mellitus
Sirida Pittyanont, Narongwat Suriya, Sirinart Sirilert, Theera Tongsong
Clinics and Practice.2024; 14(2): 536. CrossRef
 PubReader
 ePub Link
 Cite
Cite

