
Articles
- Page Path
- HOME > J Prev Med Public Health > Volume 56(5); 2023 > Article
-
Original Article
The Association Between PM2.5 Exposure and Diabetes Mellitus Among Thai Army Personnel -
Apisorn Laorattapong1,2
 , Sarun Poobunjirdkul1,2, Thanapoom Rattananupong2, Wiroj Jiamjarasrangsi2
 -
Journal of Preventive Medicine and Public Health 2023;56(5):449-457.
DOI: https://doi.org/10.3961/jpmph.23.292
Published online: September 26, 2023
1Division of Occupational Medicine, Department of Outpatient Service, Phramongkutklao Hospital, Bangkok, Thailand
2Department of Preventive and Social Medicine, Faculty of Medicine, Chulalongkorn University, Bangkok, Thailand
- Corresponding author: Wiroj Jiamjarasrangsi, Department of Preventive and Social Medicine, Faculty of Medicine, Chulalongkorn University, 1873 Rama 4 Road, Pathumwan, Bangkok 10330, Thailand, E-mail: wjiamja@gmail.com
Copyright © 2023 The Korean Society for Preventive Medicine
This is an Open Access article distributed under the terms of the Creative Commons Attribution Non-Commercial License (https://creativecommons.org/licenses/by-nc/4.0/) which permits unrestricted non-commercial use, distribution, and reproduction in any medium, provided the original work is properly cited.
ABSTRACT
-
Objectives
- This study investigated the association between baseline exposures to particulate matter with a diameter <2.5 microns (PM2.5) and subsequent temporal changes in PM2.5 exposure with the incidence of type 2 diabetes among Royal Thai Army personnel.
-
Methods
- A retrospective cohort study was conducted using nationwide health check-up data from 21 325 Thai Army personnel between 2018 and 2021. Multilevel mixed-effects parametric survival statistics were utilized to analyze the relationship between baseline (i.e., PM2.5-baseline) and subsequent changes (i.e., PM2.5-change) in PM2.5 exposure and the occurrence of type 2 diabetes. Hazard ratios (HRs) and 95% confidence intervals (CIs) were employed to assess this association while considering covariates.
-
Results
- There was a significant association between both PM2.5 baseline and PM2.5-change and the incidence of type 2 diabetes in a dose-response manner. Compared to quartile 1, the HRs for quartiles 2 to 4 of PM2.5-baseline were 1.11 (95% CI, 0.74 to 1.65), 1.51 (95% CI, 1.00 to 2.28), and 1.77 (95% CI, 1.07 to 2.93), respectively. Similarly, the HRs for quartiles 2 to 4 of PM2.5-change were 1.41 (95% CI, 1.14 to 1.75), 1.43 (95% CI, 1.13 to 1.81) and 2.40 (95% CI, 1.84 to 3.14), respectively.
-
Conclusions
- Our findings contribute to existing evidence regarding the association between short-term and long-term exposure to PM2.5 and the incidence of diabetes among personnel in the Royal Thai Army.
- Among the many environmental issues that have a negative impact on human health, air pollution is a significant concern. According to the World Health Organization (WHO), air pollution causes more than 7 million deaths per year, with over 90% of these fatalities occurring in low-income to middle-income countries, particularly in East Asia, South Asia, and the Western Pacific region [1]. Among the various air pollutants, particulate matter with a diameter <2.5 microns (PM2.5) is considered the most harmful to human health. Evidence from both human and animal studies has suggested that PM2.5 is a significant risk factor for type 2 diabetes [2–4], a chronic disease with a significant public health burden worldwide and a rising trend in Thailand [5,6].
- Several studies have shown that an increase in PM2.5 has a significant impact on the global burden of diabetes. According to the Global Burden of Disease (GBD) 2017 report, 2.94 million deaths were attributed to particulate matter exposure [7]. In 2019, a fifth of the global burden of type 2 diabetes was attributable to PM2.5 exposure, with an estimated 3.78 deaths per 100 000 population and 167 disability-adjusted life-years (DALYs) per 100 000 population [8]. However, the exposure-response curve in the GBD does not provide reliable estimates at the upper end of the global ambient air pollution exposure range due to a scarcity of studies in highly polluted areas. In addition, the exposure measurements in these studies were heterogeneous. Specifically, the exposure range over which risks were assessed varied, and the adjustments for potential confounders varied [8].
- Most research on the relationship between PM2.5 exposure, blood sugar levels, and incident diabetes mellitus has been conducted in developed countries such as Hong Kong [9], Japan [10], Canada [11], Denmark [12], and the United States [13]. Studies from developing countries like India [14], China [15], and Indonesia [16] are relatively scarce, with China contributing most of the available research. Because most of these studies were cross-sectional, results that shed light on causation are limited.
- This study investigated the association between ambient PM2.5 exposure and type 2 diabetes risk in Thailand. Army personnel were of particular interest due to their outdoor work and regular engagement in combat drills. A longitudinal design was utilized. Both baseline and subsequent PM2.5 exposure were assessed, and various potential confounders were considered. Specifically, the study objective was to determine the association of both baseline PM2.5 exposures and subsequent temporal changes in PM2.5 exposure with the incidence of type 2 diabetes among the Royal Thai Army personnel, considering potential confounders at the individual as well as area level.
INTRODUCTION
- Study Population
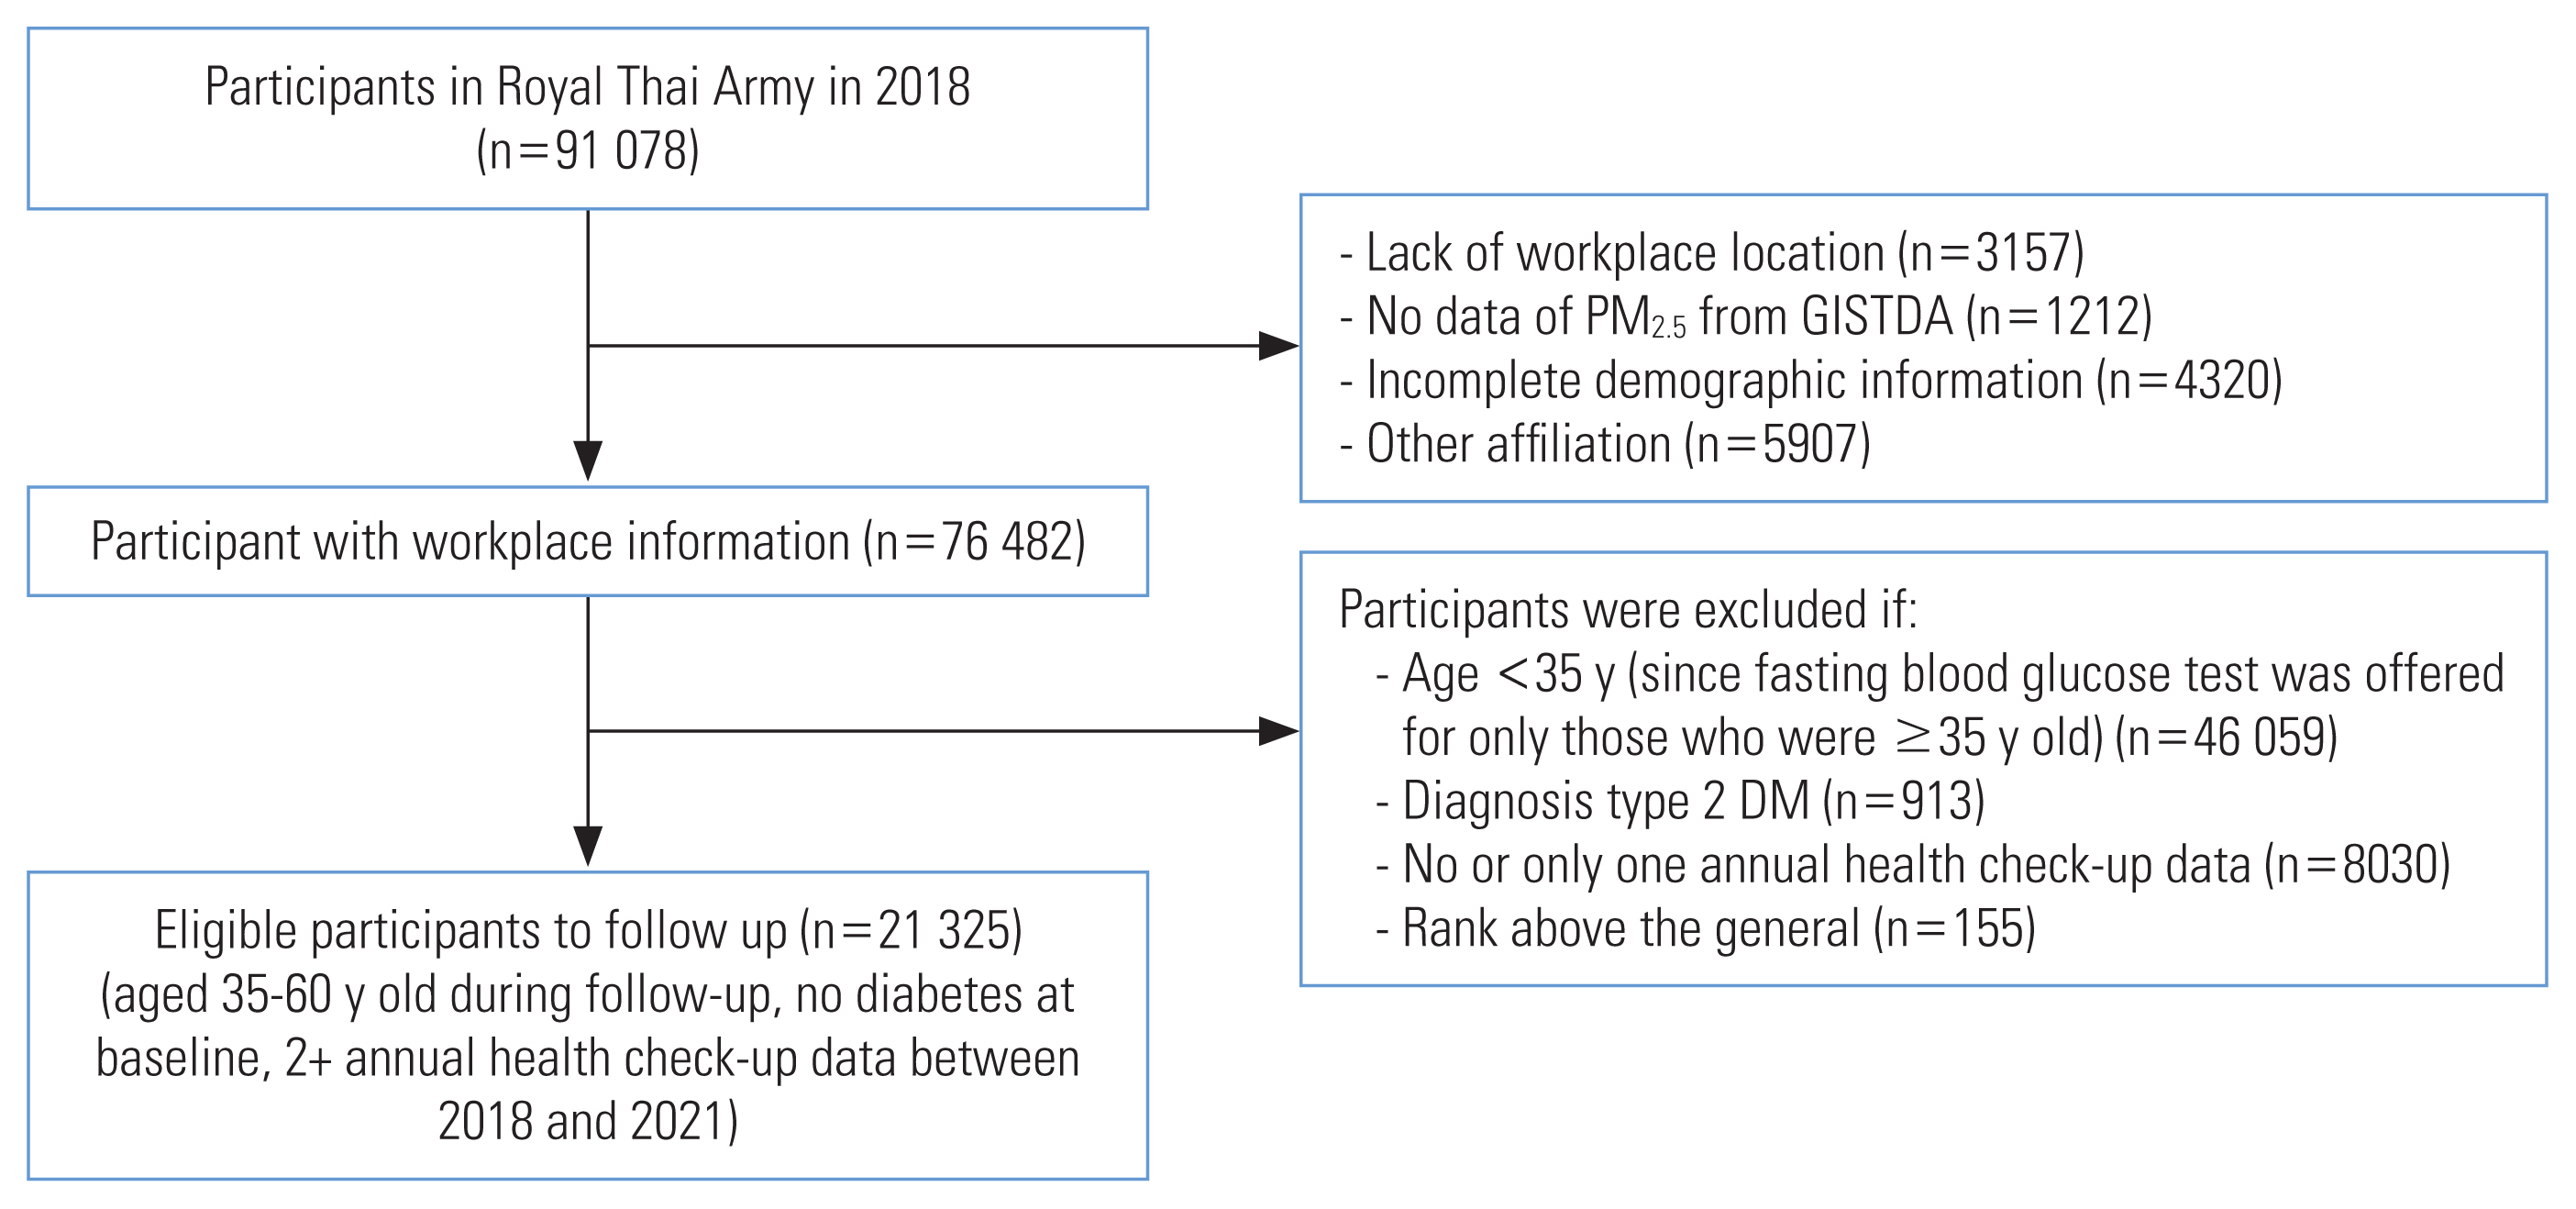
- This retrospective cohort study was conducted within the Royal Thai Army. The study population consisted of 91 078 individuals who underwent health check-ups in 461 army units across Thailand in 2018 (Figure 1). Participants were excluded who had missing data for workplace locations (n=3157), no data for PM2.5 exposure from the Geo-Informatics and Space Technology Development Agency (GISTDA; n=1212), incomplete demographic information (n=4320), and other affiliations (n=5907). Officers with a rank of general and above were also excluded from the study (n=155). The study included individuals who were stationed in active duty positions, were aged 35–60 years, had at least 2 annual health checks between 2018 and 2021, and had not been diagnosed with diabetes before 2018. The study ultimately included 21 325 eligible participants.
- The required sample size for this study was determined using the formula for comparing 2 incidence rates [17], with a 5% alpha error and 80% statistical power, a follow-up time of 3 years, and postulated type 2 diabetes incidence rates of 8.1 and 11.4 per 1000 person-years for those in the quintile I and quintile V exposure levels, respectively [13]. The calculated number of participants needed was 18 276. Thus, our actual number of participants was deemed sufficient to achieve adequate statistical power to address the research questions in this study.
- The follow-up period between 2018 and 2021 was calculated in person-years from the date of study enrollment (2018) to the date of the participant’s last interview, or any date within the study period that the participant reached 60 years of age, died, or developed diabetes. The onset of diabetes was considered the outcome event, and the other conditions were considered censored events. The numbers of participants with 1, 2, and 3 follow-up years were 3084 (14.5%); 12 018 (56.4%); and 6223 (29.2%).
- Assessment of Diabetes
- The diagnosis of diabetes or treatment for diabetes was based on the diagnostic criteria provided by the American Diabetes Association [18], which included a fasting plasma glucose (FPG) level ≥ 126 mg/dL (7.0 mmol/L) or a medical record of diabetes mellitus.
- Exposure Assessment
- The data for PM2.5 were obtained from the GISTDA of Thailand. GISTDA uses satellite data to monitor particulate matter concentrations. The agency provides an approximate average of PM2.5 coverage across the entire country, using the Aerosol Optical Depth parameter obtained from satellites equipped with the Moderate Resolution Imaging Spectroradiometer. PM2.5 levels were forecast and monitored at a resolution of approximately 3×3 km2, with subsequent averaging at the sub-district level. Daily PM2.5 data were used to calculate the annual average. PM2.5 exposure was summarized in 2 parameters: (1) PM2.5-baseline, which used the average PM2.5 exposure from 2015 to 2017 to assess the effects of long-term exposure, and (2) PM2.5-change, which calculated the difference between PM2.5-baseline and the PM2.5 levels in lag years 1–3 before an outcome event or censorship. These 2 parameters were used respectively to assess the impact of spatial (i.e., inter-cluster) and temporal (i.e., intra-cluster) variations in PM2.5 exposure on type 2 diabetes risk. Other weather data, including rainfall, relative humidity, average wind speed, and average temperature were obtained from the Pollution Control Department, Ministry of Natural Resources and Environment. Data on other air pollutants such as sulfur dioxide (SO2), nitrogen dioxide (NO2), ozone (O3), and carbon monoxide (CO) were obtained from the Meteorological Department and the Pollution Control Department’s application named Air4Thai [19]. The data used for this analysis covered the period between 2015 and 2017.
- Covariate Data
- Covariates included in the analysis were age, sex, height, weight, smoking status (never smoked, ex-smoker, non-regular smoker, regular smoker, not specified), alcohol consumption (never, ex-drinker, non-regular drinker, regular drinker, not specified), and physical activity (never, <150, >150 min/wk, not specified). Overweight was defined as having a body mass index (BMI) between 23.0 kg/m2 and 24.9 kg/m2, and obesity was defined as having a BMI ≥25.0 kg/m2 [20]. These covariates were obtained from the Army Health Examination data. An answer of “not specified” in the questionnaire was considered missing information and the participant was excluded.
- Statistical Analysis
- In the descriptive analysis, participants were categorized into 4 groups according to the baseline PM2.5 exposure level. Qualitative data, including sex, smoking status, alcohol consumption, and physical activity were presented using frequency and percentage. Quantitative data (e.g., age; BMI; annual average PM2.5 exposure; and FPG, SO2, NO2, CO, and O3 levels) were presented using mean and standard deviation (SD) or median and interquartile range, depending on the distribution of data. Differences in demographic characteristics and confounding factors among the participant groups were determined by the chi-square test for qualitative data, and by the one-way analysis of variance or Kruskal-Wallis tests for quantitative data, depending on the distribution of the data. The incidence of diabetes was calculated by dividing the number of new-onset diabetes cases by the total time at risk of diabetes in person-years and presented as an incidence rate per 1000 person-years.
- Inferential analysis was conducted using multilevel mixed-effects parametric survival analysis (Weibull distribution) to analyze the relationships of PM2.5-baseline and PM2.5-change with the incidence of diabetes [21]. The level 1 variables included individual-level factors such as age, sex, BMI, blood sugar level, smoking status, alcohol consumption, and exercise status. The level 2 variables were area-level (or army-unit) factors, including PM2.5 exposure level, rainfall amount, relative humidity, average wind speed, and average temperature, as well as SO2, NO2, CO, and O3 levels. Hazard ratios (HRs) and the corresponding 95% confidence intervals (CIs) were calculated and presented as the measure of association.
- The exposure-outcome associations were analyzed with 4 models. In the first 3 models, either PM2.5-baseline or PM2.5-change parameters were analyzed separately as a sole predictor while, in the fourth model, both PM2.5-baseline and PM2.5-change parameters were simultaneously included as the predictors. PM2.5 was divided into 4 quartiles and the first quartile was used as a reference value. Model I was the crude model where either PM2.5-baseline or PM2.5-change parameters were included as the sole predictor. In model II, the individual-level covariates, including age, sex, BMI, baseline plasma glucose level, smoking status, alcohol consumption, and physical activity level were added to model I. In model III, area-level covariates such as relative humidity, wind speed, and rainfall were added to model II. Model IV was similar to model III except that both PM2.5-baseline and PM2.5-change parameters were included as the 2 main predictors. Multicollinearity was solved by including independent variables with a pairwise correlation <70% the statistical models [22].
- The statistical analysis was conducted using Stata version 17.0 (StataCorp., College Station, TX, USA), and a 2-tailed p-value <0.05 indicated statistical significance.
- Ethics Statement
- The study was approved by the Research Ethics Review Committee, Faculty of Medicine, Chulalongkorn University (IRB reference No. 0882/65) and the Institutional Review Board of the Royal Thai Army Medical Department (IRB reference No. 0954/ 2566).
METHODS
- Participant Characteristics
- The participants ranged in age from 35 years to 60 years, with a mean±SD age of 46.2±7.3 years. The number of male participants was 17 994 (84.4%). The mean±SD BMI was 24.57±3.44 kg/m2. Most participants never smoked (57.5%), were non-regular drinkers (53.5%), and engaged in physical activity for more than 150 min/wk (59.0%). When categorizing the participants into PM2.5-baseline quartiles (Table 1), significant group differences were observed in the composition of age, sex, smoking status, alcohol consumption, and exercise status. However, no significant group differences were observed in BMI.
- Particulate Matter With a Diameter <2.5 Microns Exposure
- The average annual PM2.5 exposure from 2015 to 2017 (PM2.5-baseline) for the 461 army units across Thailand ranged from 14.64 μg/m3 to 25.16 μg/m3, with a median of 21.64 μg/m3 (quartiles 1–3, 19.17–24.38). The temporal change of PM2.5 levels in the lag years 1–3 (PM2.5-change) from 2018 to 2020 ranged from −5.86 μg/m3 to 6.06 μg/m3, with a mean±SD of 0.22±1.41 μg/m3. The distributions of PM2.5-baseline and PM2.5-change, according to their quartiles, are shown in Supplemental Material 1A and B, respectively.
- Association Between Particulate Matter With a Diameter <2.5 Microns Exposure and the Incidence of Type 2 Diabetes
- The incidence rate of diabetes mellitus tended to fluctuate in relation to increasing PM2.5 concentrations: the incidence rates in PM2.5 quartiles 1–4 were 21.87, 25.47, 23.07, and 18.13 per 1000 person-years, respectively (Table 2).
- This study analyzed the relationship between the spatial and temporal variations in PM2.5 exposure (in terms of PM2.5-baseline and PM2.5-change) with the incidence of type 2 diabetes. A significant association between PM2.5-baseline and the increased incidence of type 2 diabetes was observed only in the fully adjusted models (models III and IV). For model IV, the HR (95% CI) for quartiles 2–4 compared to quartile 1 of PM2.5-baseline were 1.11 (95% CI, 0.74 to 1.65), 1.51 (95% CI, 1.00 to 2.38), and 1.77 (95% CI, 1.07 to 2.93), respectively. In contrast, PM2.5-change was found to be significantly associated with the disease risk with a consistent dose-response pattern all the way from the crude (model I) to the fully adjusted model (model IV), though the magnitudes of association were generally reduced. The HRs (95% CI) for quartiles 2–4 compared to quartile 1 of PM2.5-change were 1.36 (95% CI, 1.11 to 1.65), 1.97 (95% CI, 1.61 to 2.42), and 3.67 (95% CI, 2.99 to 4.51) for model I and 1.41 (95% CI, 1.14 to 1.75), 1.43 (95% CI, 1.13 to 1.81), and 2.40 (95% CI, 1.84 to 3.14) for model IV, respectively (Table 3).
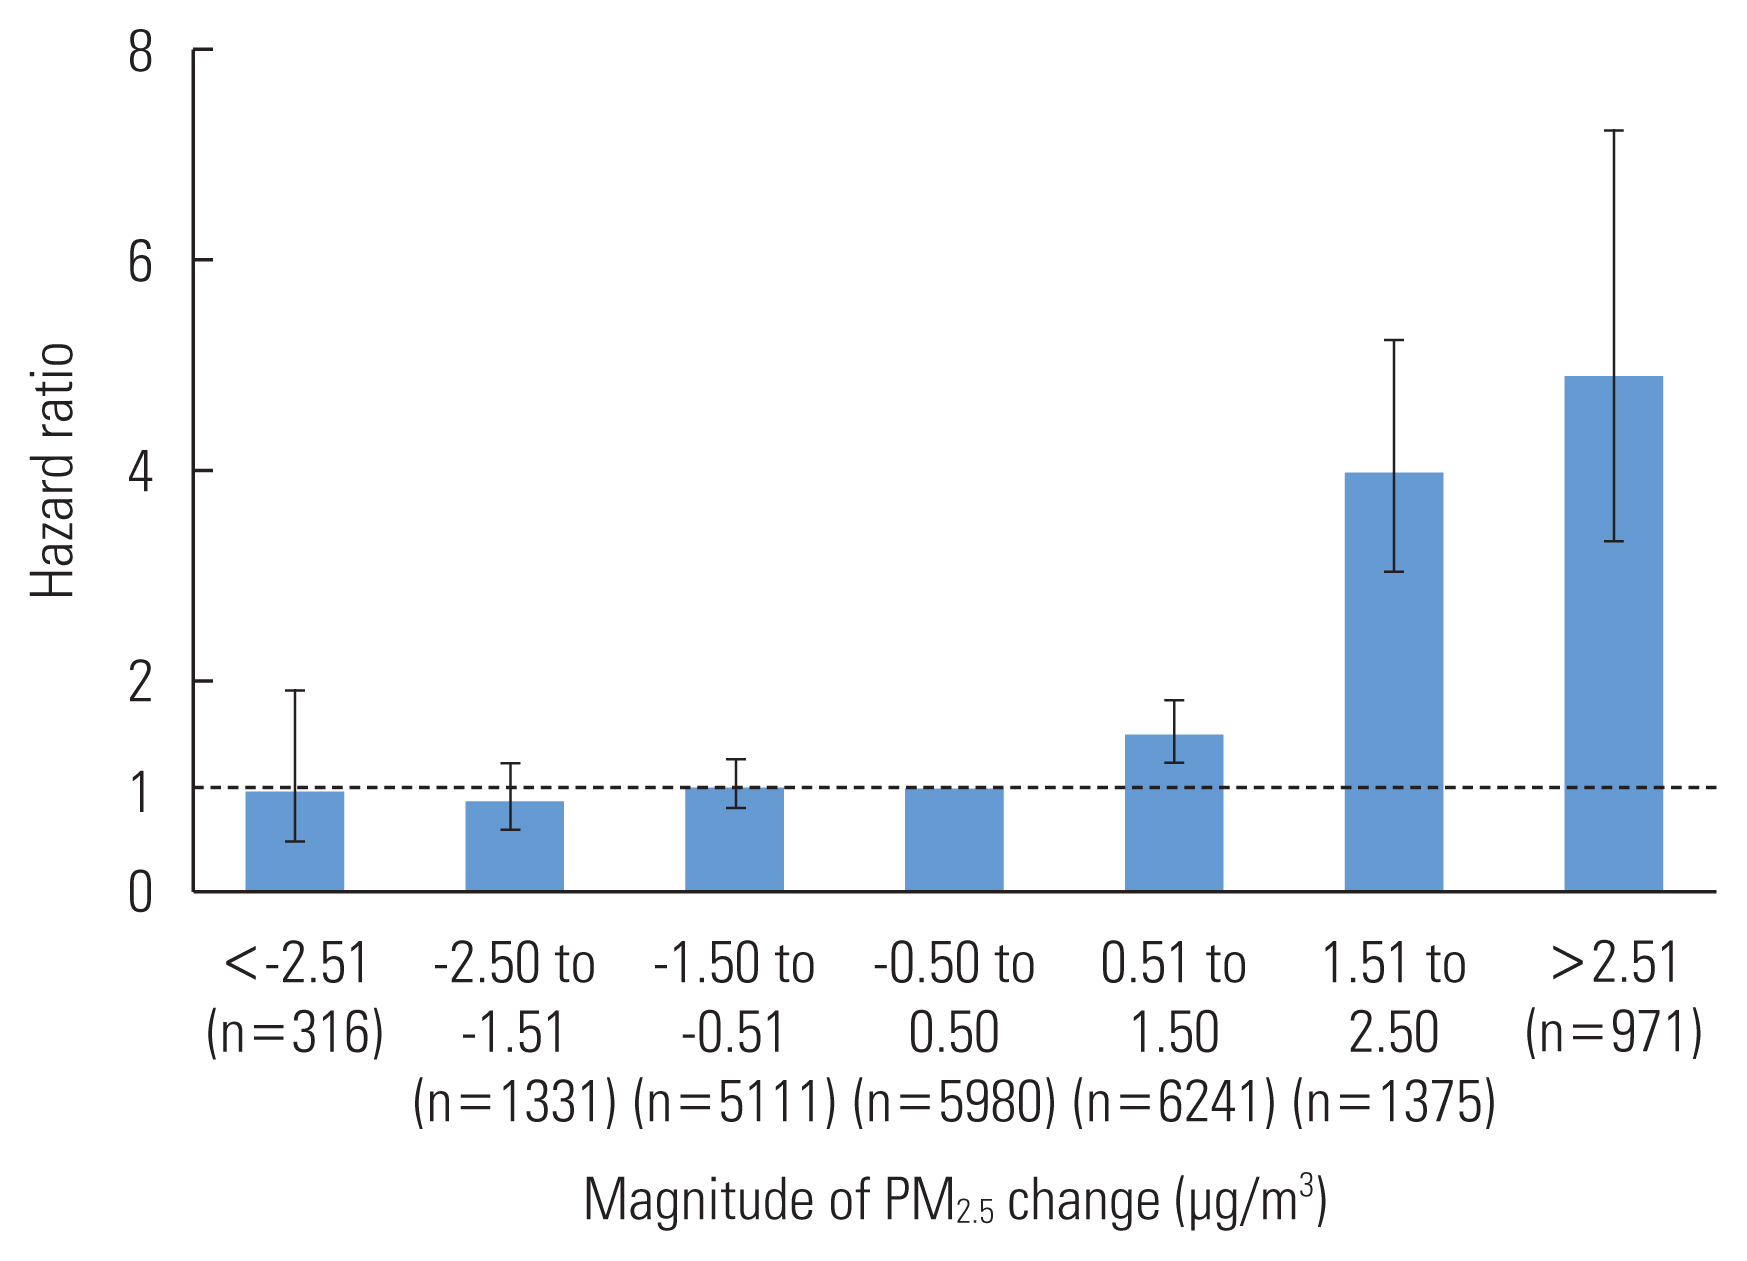
- Since the PM2.5-change category was difficult to interpret, we reclassified it into 7 categories and reanalyzed model IV by designating the middle category (with a temporal change magnitude between −0.5 and 0.5 μg/m3) as the reference category; these results are shown in Figure 2. The increasing categories of PM2.5-change were significantly associated with an increased incidence of type 2 diabetes in a progressive manner. For the PM2.5-change categories of 0.51 μg/m3 to 1.50 μg/m3, 1.51 μg/m3 to 2.50 μg/m3, and greater than 2.50 μg/m3, the HRs (95% CIs) were: 1.51 (95% CI, 1.24 to 1.84), 3.99 (95% CI, 3.04 to 5.25), and 4.91 (95% CI, 3.33 to 7.23), respectively. In contrast, decreasing categories of PM2.5-change were not significantly associated with a decrease in the incidence of type 2 diabetes.
RESULTS
- In this study, we investigated the relationship of spatial and temporal variations in PM2.5 exposure (based on PM2.5-baseline and PM2.5-change) with the incidence of type 2 diabetes among Thai Army personnel from 2018 to 2021. While both PM2.5 parameters were significantly associated with type 2 diabetes incidence, those for temporal variation in PM2.5 exposure were more robust than those for spatial variation. While the temporal increase in PM2.5 exposure was significantly and progressively associated with type 2 diabetes risk, a decrease in PM2.5 exposure did not decrease disease risk.
- We found that higher exposures to PM2.5 were associated with an increased risk of diabetes, and the strength of association was proportional to the amount of PM2.5. These results are consistent with previous studies, such as those conducted by Liu et al. [15], Li et al. [23] in China and Lee et al. [10] in Japan. However, 2 studies by Curto et al. [14] in India and Coogan et al. [13] in the United States did not find such a relationship. The variation in findings could be attributed to several factors, including the heterogeneity of population characteristics, opportunities for exposure, toxicological properties of PM2.5, or other factors related to diabetes such as the eating habits in different study areas.
- Furthermore, our finding that the temporal change had a more pronounced impact than the spatial difference of PM2.5 exposure on type 2 diabetes risk may reflect the shorter time frame between the increased PM2.5 exposure and changes in FPG. The findings of Zhan et al. [24] and Cai et al. [25] indicated that short-term and medium-term exposure to ambient PM2.5 was associated with higher FPG levels. These consistent results across studies suggest that short-term and medium-term exposure to PM2.5 may contribute to increased FPG levels. However, other alternative explanations are also possible. More studies are therefore needed.
- The magnitudes of association between PM2.5 exposure and diabetes risk reported in our study were noteworthy and generally stronger than those reported previously. When the HR for PM2.5-change and diabetes incidence in Table 3 was reanalyzed per 1 μg/m3 increase rather than by quartile comparison, the HR (95% CI) was 1.38 (95% CI, 1.27 to 1.50), as compared to the hazard, risk, or odds ratios of 0.95 to 1.25 in previous reports [10,26,27]. This might be because the individuals in our study population had military occupations that primarily involved outdoor duties, thus were exposed to higher levels of PM2.5 than the general population. In addition, we observed variations between the PM2.5 data collected from satellites (maximum 25.53, minimum 13.59, and average 20.77 μg/m3) and the PM2.5 data obtained from field stations (maximum 33.30, minimum 14.52, and average 22.76 μg/m3) (results not shown). Notably, the range of PM2.5 values from the field stations was broader than the range observed from satellite data, which suggests that the HR values in this study may be overestimated.
- The strengths of our study included the use of a cohort design to investigate the relationship between PM2.5 exposure and diabetes. We also considered various potential confounders, both at individual and sub-district levels. Our study also analyzed both the temporal variation and spatial variation associated with PM2.5. However, limitations of the study included a lack of individual data on eating behaviors [28] and family history [29] related to diabetes. In addition, we did not conduct hemoglobin A1c tests, which are commonly used for the diagnosis of diabetes. Our participants were soldiers, who may have different eating habits, exercise routines, and exposure levels to PM2.5 compared to the general population. Furthermore, the overlap of the coronavirus disease 2019 (COVID-19) pandemic with our study period, with its resultant disruption in social, economic, and physical environments as well as individual daily life behaviors [30,31], might have confounded our study findings. During our study period, we observed that the pandemic had an impact on PM2.5 levels from transportation-related sources. However, these sources were approximately 13% of all PM2.5 sources [32,33]. Meanwhile, there were other significant sources of PM2.5, such as open burning and manufacturing industries that continued their operations by implementing “bubble and seal” control policies [34]. The impact of the pandemic on individuals’ daily-life behaviors, such as wearing masks and decreasing outdoor physical activity [35], might have resulted in less exposure to PM2.5 than our exposure assessments (based on the ambient PM2.5 monitoring data) reflect. However, this exposure measurement error was most likely either non-differential or differential toward the areas and periods with poorer air quality (i.e., air pollution levels relate positively with mask-wearing [36] and inversely with outdoor physical activity levels [37]). This would result in weakening rather than overestimating the magnitude of the exposure-outcome association [38]. Nevertheless, the impact of the COVID-19 pandemic was extensive and could not be considered completely; further studies during a normal period are needed to confirm or refute our findings.
DISCUSSION
SUPPLEMENTAL MATERIALS
-
CONFLICT OF INTEREST
The authors have no conflicts of interest associated with the material presented in this paper.
-
FUNDING
None.
-
AUTHOR CONTRIBUTIONS
Conceptualization: Jiamjarasrangsi W. Data curation: Laorattapong A. Formal analysis: Laorattapong A, Poobunjirdkul S, Rattananupong T. Funding acquisition: None. Methodology: Jiamjarasrangsi W, aorattapong A, Rattananupong T. Project administration: Laorattapong A. Visualization: Laorattapong A. Writing – original draft: Laorattapong A, Jiamjarasrangsi W. Writing – review & editing: Laorattapong A, Poobunjirdkul S, Rattananupong T, Jiamjarasrangsi W.
Notes
ACKNOWLEDGEMENTS
| Characteristics | PM2.5-baseline (μg/m3)1 | |||
|---|---|---|---|---|
|
|
||||
| Quartile 1 (14.64–19.17) | Quartile 2 (19.18–21.64) | Quartile 3 (21.65–24.37) | Quartile 4 (24.38–25.16) | |
| Age (y) | ||||
| <45 | 2642 (49.5) | 2531 (45.9)2 | 2912 (45.3)2 | 1652 (40.9)2,3,4 |
| ≥45 | 2691 (50.5) | 2989 (54.1) | 3517 (54.7) | 2391 (59.1) |
|
|
||||
| Sex | ||||
| Male | 5032 (94.4) | 4911 (89.0)2 | 4984 (77.5)2,3 | 3067 (75.9)2,3 |
| Female | 301 (5.6) | 609 (11.0) | 1445 (22.5) | 976 (24.1) |
|
|
||||
| BMI (kg/m2) | ||||
| Underweight | 77 (1.4) | 92 (1.7) | 115 (1.8)2 | 94 (2.3) |
| Normal | 3034 (56.9) | 3261 (59.1) | 3781 (58.8) | 2300 (56.9) |
| Overweight | 1882 (35.3) | 1812 (32.8) | 2177 (33.9) | 1367 (33.8) |
| Obesity | 340 (6.4) | 355 (6.4) | 356 (5.5) | 282 (7.0) |
|
|
||||
| Smoking status | ||||
| Never | 2788 (52.3) | 3338 (60.5)2 | 3564 (55.4)2 | 2574 (63.7)2,3,4 |
| Ex-Smoker | 873 (16.4) | 873 (15.8) | 1305 (20.3) | 648 (16.0) |
| Non-regular smoker | 566 (10.6) | 561 (10.2) | 785 (12.2) | 399 (9.9) |
| Regular smoker | 1106 (20.7) | 748 (13.5) | 775 (12.1) | 422 (10.4) |
|
|
||||
| Alcohol consumption | ||||
| Never | 1234 (23.1) | 1768 (32.0)2 | 1774 (27.6)2,3 | 1337 (33.1)2,4 |
| Ex-drinker | 851 (16.0) | 514 (9.3) | 734 (11.4) | 377 (9.3) |
| Non-regular drinker | 2438 (45.7) | 3059 (55.5) | 3710 (57.7) | 2208 (54.6) |
| Regular drinker | 810 (15.2) | 179 (3.2) | 211 (3.3) | 121 (3.0) |
|
|
||||
| Exercise level (min/wk) | ||||
| No exercise | 349 (6.5) | 893 (16.2)2 | 559 (8.7)3 | 178 (4.4)2,3,4 |
| ≤150 | 1716 (32.2) | 1911 (34.6) | 1866 (29.0) | 1268 (31.4) |
| >150 | 3268 (61.3) | 2716 (49.2) | 4004 (62.3) | 2597 (64.2) |
| PM2.5-baseline (μg/m3)1 | Participants (person) | Person-years | New case | Incidence rate | 95% CI | |
|---|---|---|---|---|---|---|
| LL | UL | |||||
| Total | 21 325 | 81 736 | 1834 | 22.44 | 21.43 | 23.49 |
| Quartile 1 (14.64–19.17) | 5333 | 20 534 | 449 | 21.87 | 19.93 | 23.99 |
| Quartile 2 (19.18–21.64) | 5520 | 21 045 | 536 | 25.47 | 23.40 | 27.72 |
| Quartile 3 (21.65–24.37) | 6429 | 24 492 | 565 | 23.07 | 21.24 | 25.05 |
| Quartile 4 (24.38–25.16) | 4043 | 15 665 | 284 | 18.13 | 16.14 | 20.37 |
| PM2.5 parameter (Min. Max, μg/m3) | Model I | Model II | Model III | Model IV |
|---|---|---|---|---|
| PM2.5-baseline2 | ||||
| Quartile 1 (14.64, 19.17) | 1.00 (reference) | 1.00 (reference) | 1.00 (reference) | 1.00 (reference) |
| Quartile 2 (19.18, 21.64) | 1.16 (0.86, 1.58) | 1.17 (0.87, 1.56) | 1.16 (0.79, 1.70) | 1.11 (0.74, 1.65) |
| Quartile 3 (21.65, 24.37) | 1.24 (0.89, 1.70) | 1.24 (0.91, 1.69) | 1.37 (0.92, 2.03) | 1.51 (1.00, 2.28)* |
| Quartile 4 (24.38, 25.16) | 0.85 (0.55, 1.19) | 0.85 (0.59, 1.23) | 2.01 (1.23, 3.27)** | 1.77 (1.07, 2.93)* |
|
|
||||
| PM2.5-change3 | ||||
| Quartile 1 (−5.86, −0.65) | 1.00 (reference) | 1.00 (reference) | 1.00 (reference) | 1.00 (reference) |
| Quartile 2 (−0.64, −0.30) | 1.36 (1.11, 1.65)** | 1.30 (1.07, 1.58)** | 1.39 (1.12, 1.71)** | 1.41 (1.14, 1.75)** |
| Quartile 3 (0.31, 1.02) | 1.97 (1.61, 2.42)*** | 1.92 (1.57, 2.36)*** | 1.44 (1.14, 1.81)** | 1.43 (1.13, 1.81)** |
| Quartile 4 (1.03, 6.06) | 3.67 (2.99, 4.51)*** | 3.48 (2.83, 4.29)*** | 2.40 (1.84, 3.13)*** | 2.40 (1.84, 3.14)*** |
Values are presented as hazard ratio (95% confidence interval).
PM2.5, particulate matter with a diameter <2.5 microns; Min, minimum; Max, maximum.
1 Model I: only PM2.5-baseline or PM2.5-change was included as a predictor; Model II: Model I plus individual-level covariates (such as age, sex, BMI, baseline plasma glucose level, smoking status, alcohol consumption, and physical activity); Model III: Model II plus area-level covariates (such as relative humidity, wind speed, and rainfall); Model IV: both PM2.5-baseline and PM2.5-change were simultaneously included as the predictors, plus individual-level and area-level covariates.
2 The average of the annual PM2.5 exposure from 2015 to 2017 (baseline).
3 The difference between the baseline PM2.5 and the PM2.5 levels in lag years 1–3 before the outcome event or censorship.
* p<0.05,
** p<0.01,
*** p<0.001.
- 1. Climate and Clean Air Coalition. World Health Organization releases new global air pollution data; [cited 2022 Jun 11]. Available from: https://www.ccacoalition.org/news/world-health-organization-releases-new-global-air-pollution-data
- 2. Balti EV, Echouffo-Tcheugui JB, Yako YY, Kengne AP. Air pollution and risk of type 2 diabetes mellitus: a systematic review and meta-analysis. Diabetes Res Clin Pract 2014;106(2):161-172ArticlePubMed
- 3. Esposito K, Petrizzo M, Maiorino MI, Bellastella G, Giugliano D. Particulate matter pollutants and risk of type 2 diabetes: a time for concern? Endocrine 2016;51(1):32-37ArticlePubMedPDF
- 4. He D, Wu S, Zhao H, Qiu H, Fu Y, Li X, et al. Association between particulate matter 2.5 and diabetes mellitus: a meta-analysis of cohort studies. J Diabetes Investig 2017;8(5):687-696ArticlePubMedPMCPDF
- 5. Guariguata L, Whiting DR, Hambleton I, Beagley J, Linnenkamp U, Shaw JE. Global estimates of diabetes prevalence for 2013 and projections for 2035. Diabetes Res Clin Pract 2014;103(2):137-149ArticlePubMed
- 6. Beagley J, Guariguata L, Weil C, Motala AA. Global estimates of undiagnosed diabetes in adults. Diabetes Res Clin Pract 2014;103(2):150-160ArticlePubMed
- 7. GBD 2017 Risk Factor Collaborators. Global, regional, and national comparative risk assessment of 84 behavioural, environmental and occupational, and metabolic risks or clusters of risks for 195 countries and territories, 1990–2017: a systematic analysis for the Global Burden of Disease Study 2017. Lancet 2018;392(10159):1923-1994PubMedPMC
- 8. GBD 2019 Diabetes and Air Pollution Collaborators. Estimates, trends, and drivers of the global burden of type 2 diabetes attributable to PM2·5 air pollution, 1990–2019: an analysis of data from the Global Burden of Disease Study 2019. Lancet Planet Health 2022;6(7):e586-e600PubMedPMC
- 9. Qiu H, Schooling CM, Sun S, Tsang H, Yang Y, Lee RS, et al. Long-term exposure to fine particulate matter air pollution and type 2 diabetes mellitus in elderly: a cohort study in Hong Kong. Environ Int 2018;113: 350-356ArticlePubMed
- 10. Lee M, Ohde S. PM2.5 and diabetes in the Japanese population. Int J Environ Res Public Health 2021;18(12):6653ArticlePubMedPMC
- 11. Chen H, Burnett RT, Kwong JC, Villeneuve PJ, Goldberg MS, Brook RD, et al. Risk of incident diabetes in relation to long-term exposure to fine particulate matter in Ontario, Canada. Environ Health Perspect 2013;121(7):804-810ArticlePubMedPMC
- 12. Hansen AB, Ravnskjær L, Loft S, Andersen KK, Bräuner EV, Baastrup R, et al. Long-term exposure to fine particulate matter and incidence of diabetes in the Danish Nurse Cohort. Environ Int 2016;91: 243-250ArticlePubMed
- 13. Coogan PF, White LF, Yu J, Burnett RT, Seto E, Brook RD, et al. PM2.5 and diabetes and hypertension incidence in the Black Women’s Health Study. Epidemiology 2016;27(2):202-210ArticlePubMedPMC
- 14. Curto A, Ranzani O, Milà C, Sanchez M, Marshall JD, Kulkarni B, et al. Lack of association between particulate air pollution and blood glucose levels and diabetic status in peri-urban India. Environ Int 2019;131: 105033ArticlePubMedPMC
- 15. Liu C, Yang C, Zhao Y, Ma Z, Bi J, Liu Y, et al. Associations between long-term exposure to ambient particulate air pollution and type 2 diabetes prevalence, blood glucose and glycosylated hemoglobin levels in China. Environ Int 2016;92–93: 416-421ArticlePubMedPMC
- 16. Suryadhi MA, Suryadhi PA, Abudureyimu K, Ruma IM, Calliope AS, Wirawan DN, et al. Exposure to particulate matter (PM2.5) and prevalence of diabetes mellitus in Indonesia. Environ Int 2020;140: 105603ArticlePubMed
- 17. Lwanga SK, Lemeshow S; World Health Organization. Sample size determination in health studies: a practical manual; 1991 [cited 2023 Jun 11]. Available from: https://apps.who.int/iris/handle/10665/40062
- 18. American Diabetes Association Professional Practice Committee. 2. Classification and diagnosis of diabetes: standards of medical care in diabetes—2022. Diabetes Care 2022;45(Suppl_1):S17-S38ArticlePubMedPDF
- 19. Air4Thai. Regional air quality and situation reports; [cited 2023 Jun 11]. Available from: http://air4thai.pcd.go.th/webV3/#/Home
- 20. World Health Organization. The Asia-Pacific perspective: redefining obesity and its treatment; 2000 [cited 2023 Jun 11]. Available from: https://apps.who.int/iris/handle/10665/206936
- 21. StataCorp LLC. mestreg — multilevel mixed-effects parametric survival models; [cited 2023 Jun 11]. Available from: https://www.stata.com/manuals/memestreg.pdf
- 22. Leiby BD, Ahner DK. Multicollinearity applied stepwise stochastic imputation: a large dataset imputation through correlation-based regression. J Big Data 2023;10(1):1-20ArticlePubMedPMCPDF
- 23. Li CY, Wu CD, Pan WC, Chen YC, Su HJ. Association between long-term exposure to PM2.5 and incidence of type 2 diabetes in Taiwan: a national retrospective cohort study. Epidemiology 2019;30(Suppl 1):S67-S75PubMed
- 24. Zhan M, Li Z, Li X, Tao B, Zhang Q, Wang J. Effect of short-term ambient PM2.5 exposure on fasting blood glucose levels: a longitudinal study among 47,471 people in eastern China. Environ Pollut 2021;290: 117983ArticlePubMed
- 25. Cai L, Wang S, Gao P, Shen X, Jalaludin B, Bloom MS, et al. Effects of ambient particulate matter on fasting blood glucose among primary school children in Guangzhou, China. Environ Res 2019;176: 108541ArticlePubMed
- 26. Chilian-Herrera OL, Tamayo-Ortiz M, Texcalac-Sangrador JL, Rothenberg SJ, López-Ridaura R, Romero-Martínez M, et al. PM2.5 exposure as a risk factor for type 2 diabetes mellitus in the Mexico City metropolitan area. BMC Public Health 2021;21(1):2087ArticlePubMedPMCPDF
- 27. Weinmayr G, Hennig F, Fuks K, Nonnemacher M, Jakobs H, Möhlenkamp S, et al. Long-term exposure to fine particulate matter and incidence of type 2 diabetes mellitus in a cohort study: effects of total and traffic-specific air pollution. Environ Health 2015;14: 53ArticlePubMedPMCPDF
- 28. Ueno S, Aung MN, Yuasa M, Ishtiaq A, Khin ET, Latt TS, et al. Association between dietary habits and type 2 diabetes mellitus in Yangon, Myanmar: a case-control study. Int J Environ Res Public Health 2021;18(21):11056ArticlePubMedPMC
- 29. InterAct Consortium, Scott RA, Langenberg C, Sharp SJ, Franks PW, Rolandsson O, et al. The link between family history and risk of type 2 diabetes is not explained by anthropometric, lifestyle or genetic risk factors: the EPIC-InterAct study. Diabetologia 2013;56(1):60-69ArticlePubMedPMCPDF
- 30. Onyeaka H, Anumudu CK, Al-Sharify ZT, Egele-Godswill E, Mbaegbu P. COVID-19 pandemic: a review of the global lockdown and its far-reaching effects. Sci Prog 2021;104(2):368504211019854ArticlePubMedPMCPDF
- 31. Miyah Y, Benjelloun M, Lairini S, Lahrichi A. COVID-19 impact on public health, environment, human psychology, global socioeconomy, and education. ScientificWorldJournal 2022;2022: 5578284ArticlePubMedPMCPDF
- 32. Greenpeace. Greenpeace’s city rankings for PM2.5 in Thailand; [cited 2023 Sep 2]. Available from: https://greenpeace.or.th/s/right-to-clean-air/PM2.5CityRankingsREV.pdf
- 33. Nuchdang S, Kingkam W, Tippawan U, Sriwiang W, Fungklin R, Rattanaphra D. Metal composition and source identification of PM2.5 and PM10 at a suburban site in Pathum Thani, Thailand. Atmosphere 2023;14(4):659Article
- 34. Department of Disease Control. Manual for the disease prevention and control in specific area (bubble and seal) for workplace; 2021 [cited 2023 Sep 2]. Available from: https://ddc.moph.go.th/uploads/publish/1183620211001030623.pdf (Thai)
- 35. Park AH, Zhong S, Yang H, Jeong J, Lee C. Impact of COVID-19 on physical activity: a rapid review. J Glob Health 2022;12: 05003ArticlePubMedPMC
- 36. Yang Q, Wu S. Air pollution in China: health information seeking and protective behaviors. Health Promot Int 2020;35(6):1495-1506ArticlePubMedPDF
- 37. Tainio M, Jovanovic Andersen Z, Nieuwenhuijsen MJ, Hu L, de Nazelle A, An R, et al. Air pollution, physical activity and health: a mapping review of the evidence. Environ Int 2021;147: 105954ArticlePubMedPMC
REFERENCES
Figure & Data
References
Citations
- Influence of Air Pollution Exposures on Cardiometabolic Risk Factors: a Review
Li-Hao Guo, Mohammed Zeeshan, Guo-Feng Huang, Duo-Hong Chen, Min Xie, Jun Liu, Guang-Hui Dong
Current Environmental Health Reports.2023; 10(4): 501. CrossRef
 PubReader
 ePub Link
 Cite
Cite


