Articles
- Page Path
- HOME > J Prev Med Public Health > Volume 45(5); 2012 > Article
-
Brief Report
Trends in Ischemic Heart Disease Mortality in Korea, 1985-2009: An Age-period-cohort Analysis - Hye Ah Lee, Hyesook Park
-
Journal of Preventive Medicine and Public Health 2012;45(5):323-328.
DOI: https://doi.org/10.3961/jpmph.2012.45.5.323
Published online: September 28, 2012
Department of Preventive Medicine, Ewha Womans University School of Medicine, Seoul, Korea.
- Corresponding author: Hyesook Park, MD, PhD. 1071 Anyangcheon-ro, Yangcheon-gu, Seoul 158-710, Korea. Tel: +82-2-2650-5756, Fax: +82-2-2652-8325, hpark@ewha.ac.kr
• Received: January 4, 2012 • Accepted: May 30, 2012
Copyright © 2012 The Korean Society for Preventive Medicine
This is an Open Access article distributed under the terms of the Creative Commons Attribution Non-Commercial License (http://creativecommons.org/licenses/by-nc/3.0/) which permits unrestricted non-commercial use, distribution, and reproduction in any medium, provided the original work is properly cited.
ABSTRACT
-
Objectives
- Economic growth and development of medical technology help to improve the average life expectancy, but the western diet and rapid conversions to poor lifestyles lead an increasing risk of major chronic diseases. Coronary heart disease mortality in Korea has been on the increase, while showing a steady decline in the other industrialized countries. An age-period-cohort analysis can help understand the trends in mortality and predict the near future.
-
Methods
- We analyzed the time trends of ischemic heart disease mortality, which is on the increase, from 1985 to 2009 using an age-period-cohort model to characterize the effects of ischemic heart disease on changes in the mortality rate over time.
-
Results
- All three effects on total ischemic heart disease mortality were statistically significant. Regarding the period effect, the mortality rate was decreased slightly in 2000 to 2004, after it had continuously increased since the late 1980s that trend was similar in both sexes. The expected age effect was noticeable, starting from the mid-60's. In addition, the age effect in women was more remarkable than that in men. Women born from the early 1900s to 1925 observed an increase in ischemic heart mortality. That cohort effect showed significance only in women.
-
Conclusions
- The future cohort effect might have a lasting impact on the risk of ischemic heart disease in women with the increasing elderly population, and a national prevention policy is need to establish management of high risk by considering the age-period-cohort effect.
- Cancers, cerebrovascular diseases, and cardiovascular diseases which are the three major causes of death in Korea are typical of chronic diseases. These comprised 47.8% of the total mortality rate in 2009. Compared to the results from 1999, the mortality rate from cancer had increased to 23.1% by 2009, but the trend by cancer types showed differences. Cerebrovascular diseases had decreased to 28.6% in 2009 compared to the 1999 result. Meanwhile, ischemic heart disease, which is one of the causes of death by heart disease, showed a sharply increased (by 40.9%) crude death rate from 18.4% in 1999 to 26.0% in 2009 [1].
- The mortality rate by coronary heart disease (CHD) and ischemic heart disease had continuously decreased in developed countries [2,3]. However, the mortality rate by cardiovascular diseases has consistently increased in Korea. In addition, it was pointed out that the epidemic of CHD broke out in Korea in the comparison study on the trend of the mortality rate by cardiac disorders in World Health Organization (WHO) member countries [2]. Although the trends in CHD and stroke have decreased in some developed countries, these diseases remain the main cause of death worldwide. Furthermore, the WHO predicted that CHD would be the top ranked cause of death in 2020 [4].
- Although many studies on disease-specific risk factors have been actively performed to prevent major chronic diseases [5,6], it has been difficult to determine the causal relationship because complex causes affected the incidence of diseases. The main cause affecting the mortality rate is age, though it is suggested that the year of birth could affect the prevalence and mortality rates, confirming that the exposure to risk factors in critical periods affects diseases by emphasizing a life-course approach to explaining the mechanism for the occurrence of the diseases [7].
- Although it is easy to calculate the mortality rate, detailed information on the trends could be missed in the averaging process. Hence, the analysis of the mortality rate from specific diseases by time should provide a clue to understanding the disease because each disease has its own trend in the mortality rate [8].
- It has been suggested that an age-period-cohort (APC) analysis for the disease-specific mortality rates is necessary [8,9], however, only a few such studies have been performed in Korea. Therefore, using mortality data from 1985 to 2009, this study analyzed the APC effect on ischemic heart disease.
INTRODUCTION
- Data Collection
- Using the mortality data of Statistics Korea on the number of deaths and the mortality rate, the data were collected using code I20-I25 of the WHO-recommended International Classification of Diseases and Causes of Death from 1985 to 2009. The mortality data was classified into 5 categories in 5-year periods.
- To exclude the effect of hereditary diseases on death, the data for those aged 40 to 79 at death were used in the analysis. The data for those aged 80 and older at death was excluded because their data were difficult to calculate in 5-year periods from 1985 to 1997. The ages were divided into 8 categories, each of which was a 5-year period.
- Data Analysis
- To compare mortality rates, a direct adjustment for age was applied. After calculating the crude mortality rates by age, the direct age adjusted mortality rate was produced from the standardized male and female population, considered separately. The standardized population was calculated by summation of the mid-year population of subjects according to the resident registration of males and females in each year from 1985 to 2009.
- To analyze the mortality rate in an APC model, the intrinsic estimator (IE) method, applying the principal component regression analysis of the APC analysis method, was developed by Yang [8,10]. Thus, this study investigated the APC effect on the total mortality rate by ischemic heart disease using the IE model. In addition, this study analyzed the effect by gender. STATA software version 11.0 (Stata Corp., College Station, TX, USA) was used for the analysis using the "apc_ie" command statement.
METHODS
- The calculation of the age-adjusted mortality rate from 1985 to 2009 showed no significant difference in the period of 1985 to 1989. However, since then, significant differences were shown by age group in the male subjects. In the females, the mortality rate was relatively high in the group aged 75 or older in the late 90s. The standardized mortality rates of males and females both decreased from the period of 2000 to 2004 to the period of 2005 to 2009 in every age group (Table 1).
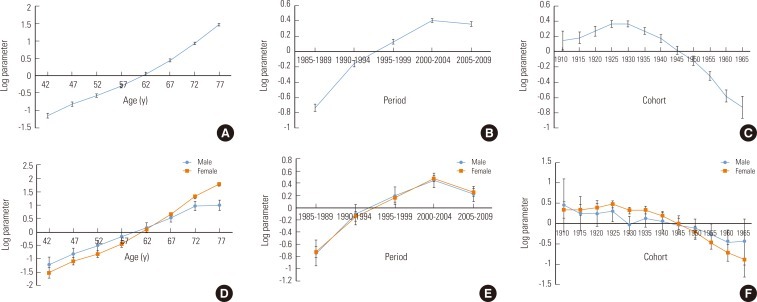
- In total analyses, the APC effects on the mortality rate were statistically significant. Even under conditions in which the period-cohort effect is controlled, the typical age effect was shown. However, the age effect differed by gender. While the mortality rate in males was higher than that of females aged younger than the mid-60s, the female mortality rate became higher than that of males after the mid-60s. This difference by gender increased with age.
- For the period effect with adjusting for age-cohort effect, the mortality rate increased from 1985 to 1999, and then it decreased. The patterns of the period effects were parallel in males and females.
- In the cohort effect analysis, the mortality rate had consistently increased since a birth year of 1910, and it peaked during the period from 1925 to 1930. For birth years after that, the trend of the mortality rate showed a rapid decline. Unlike the total results, the mortality rate in males showed a fluctuation, and that of the population born in 1930 rapidly decreased. In female, the mortality rate peaked in 1925, and since then, the mortality rate was reduced. As a result of the IE analysis, the cohort effect was significant in females only. However, when the year of birth was closer to the present, the trends of the decreased mortality rate by ischemic heart disease for the two sexes were equal (Figure 1).
RESULTS
- This study analyzed the trend in the mortality rate over time by the IE method using the data on mortality by ischemic heart disease from 1985 to 2009. Overall, the mortality rate steadily increased since 1985. The mortality rate of females was higher than that of males. All three effects were significant in total mortality rates. Considering the year of birth, the mortality rate after 1910 rapidly increased, and it peaked between 1925 and 1930, then it rapidly decreased. In a gender-stratified analysis, the age-period effects were significant in both genders. However, the cohort effect was significant in females only.
- Although CHD is the main cause of death, the mortality rate by CHD started to decrease in some developed countries beginning in the late 20th century [11]. The starting point for this change of trend may be different in each country, and it could be explained by the APC effect.
- As one of the time factors, the age effect is the first consideration. The mortality rate by cardiovascular disease could increase due to the decline of biological functioning caused by aging. The age effect of each disease differs by gender. CHD in females occurs around ten years later than in males, and its occurrence increases after menopause [12]. The high mortality rate in females could be explained by post-menopausal hormonal unbalance late in life [13]. As the future ratio of females to males in the aging population, is expected to continue to grow, the age effect in females can be expected to continue from now on.
- While economic growth and the development of medical technology contribute to the decline in the mortality rate, the western diet and rapid lifestyle changes lead to an increase in the risk of major chronic diseases [11]. The recent decline in the mortality rate of ischemic heart disease would be affected by the development of medical technology and the improvement of the medical system. Besides, the decline of the smoking rate in males since 1998 and the diminution of the prevalence for hypertension would contribute to the decrease of the mortality rate since 2000 [14]. However, the increases in animal fats intake and the smoking rate in younger women are expected to affect the future morbidity and mortality rates [11,15,16].
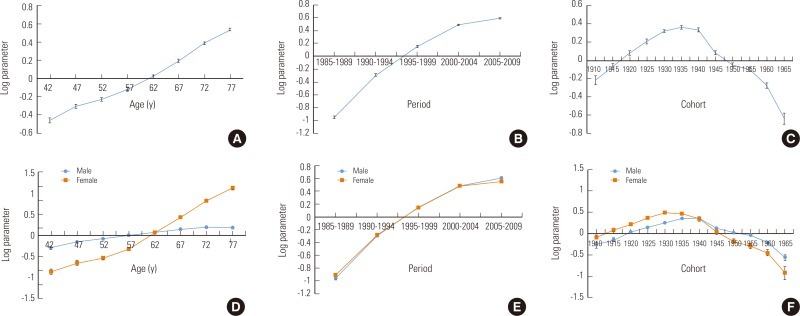
- In most studies, the year of birth is not considered. To understand the time trend of general diseases, the cohort effect should be considered to obtain results without bias [17]. Among the Korean studies analyzing the APC effect by using mortality data, there was a study on the mortality data by acute myocardial infarction from 1988 to 2007, and showed a high mortality rate in the cohort group born between 1945 and 1950 [18]. The cause of death classification code (I20-I25) by ischemic heart disease includes acute myocardial infarction (I21), and acute myocardial infarction causes 82% of all deaths caused by ischemic heart disease. As a result of the detailed analysis of acute myocardial infarction as a cause of death, the cohort effect of the cause of death by acute myocardial infarction was the highest for births in 1935 (Appendix 1). Minor differences may be shown by the cohort size and the period of the data [2]. In addition, using various statistical methods for analysis would lead to different results.
- The cohort effect describes the influence of the environment at the year of birth. In this study, it was difficult to explain the relative period difference in early 1900. In a previous study on the analysis of breast cancer by time, the trend toward an increased mortality rate in the group born in the early 1900s was similar to the result of this study [19]. Although these results could arise from a coincidence or the age effect, the environmental influence at that time could affect both of the two diseases.
- When the APC effect is analyzed, three factors have a high correlation. Thus, using all three factors at the same time, there is an identification problem, which means it is difficult to distinguish clearly among each effect. For this reason, alternative methods of approaching this problem have been suggested. Generally, the limited constrained generalized linear model (CGLM), which is designed to estimate relative coefficients in a standard comparative category as constraining conditions are given on a parameter vector, has been used. In CGLM analysis, it is difficult to achieve consistent results because an estimated parameter value is changed by the selection of reference categories and prior information for category selection is needed [10].
- To improve the statistical method, the IE method applying principal component regression analysis was recently developed [8,10]. The IE is a more useful method because the stable confidence interval can be calculated and the direct estimation without selection of reference category. However, both methods have had limitations in solving the identification problem so far [10].
- To understand the APC effect of this study, the following factors should be considered. The cause of death is classified by a physician. In this process, other accompanying causes may not be identified, and changes in the cause of death classification system could cause errors. Some previous studies have reported that changes in the cause of death classification system did not have a major effect on the mortality rate by disease [16]. When the cause of death is classified as being related to the cardiovascular system, other diseases often accompany. Thus, the classification would be affected by general practices and physicians' classification tendencies could affect the classification [20]. For the group data, various factors affecting the occurrence of diseases were not considered [9]. Lastly, a survivor bias must be considered when mortality data is interpreted because early death from the same diseases would have resulted from higher exposure rates.
- Nevertheless, this trend analysis could provide a basis for disease prevention. The cohort effect can be analyzed to evaluate national prevention policies with the management of high risk groups by predicting the main population whose mortality rate will be affected in the future.
DISCUSSION
ACKNOWLEDGEMENTS
- 1. Korean National Statistical Office. 2009 Report on the cause of death statistics. cited 2012 Sep 17. Available from: http://kostat.go.kr/portal/korea/kor_nw/2/6/2/index.board?bmode=read&bSeq=&aSeq=179505&pageNo=1&rowNum=10&navCount=10&currPg=&sTarget=title&sTxt= (Korean)
- 2. Mirzaei M, Truswell AS, Taylor R, Leeder SR. Coronary heart disease epidemics: not all the same. Heart 2009;95(9):740-746. 19095711ArticlePubMed
- 3. Amiri M, Janssen F, Kunst AE. The decline in ischaemic heart disease mortality in seven European countries: exploration of future trends. J Epidemiol Community Health 2011;65(8):676-681. 21527402ArticlePubMed
- 4. American Heart Association. International cardiovascular disease statistics. cited 2012 Sep 17. Available from: http://bellevuecollege.edu/artshum/materials/inter/Spring04/SizeMatters/internatCardioDisSTATsp04.pdf
- 5. Karalis IK, Alegakis AK, Kafatos AG, Koutis AD, Vardas PE, Lionis CD. Risk factors for ischaemic heart disease in a Cretan rural population: a twelve year follow-up study. BMC Public Health 2007;7: 351. 18088432ArticlePubMedPMC
- 6. Jung J, Kim N. Risk factors, subjective symptoms, knowledge of coronary artery disease and preventive health practices in postmenopausal women. Korean J Women Health Nurs 2006;12(1):29-36. (Korean)ArticlePDF
- 7. Barker DJ, Osmond C. Infant mortality, childhood nutrition, and ischaemic heart disease in England and Wales. Lancet 1986;1(8489):1077-1081. 2871345ArticlePubMed
- 8. Yang Y. Trends in U.S. adult chronic disease mortality, 1960-1999: age, period, and cohort variations. Demography 2008;45(2):387-416. 18613487ArticlePubMedPMC
- 9. Bravo M. Age-period-cohort analysis of dentist use in Spain from 1987 to 1997. An analysis based on the Spanish National Health Interview Surveys. Eur J Oral Sci 2001;109(3):149-154. 11456343ArticlePubMed
- 10. Yang Y, Fu WJ, Land KC. A methodological comparison of age-period-cohort models: the intrinsic estimator and conventional generalized linear models. Sociol Methodol 2004;34(1):75-110Article
- 11. Yu IT, Li W, Wong TW. Effects of age, period and cohort on acute myocardial infarction mortality in Hong Kong. Int J Cardiol 2004;97(1):63-68. 15336808ArticlePubMed
- 12. Wake R, Yoshiyama M. Gender differences in ischemic heart disease. Recent Pat Cardiovasc Drug Discov 2009;4(3):234-240. 19545234ArticlePubMed
- 13. Natarajan S, Liao Y, Cao G, Lipsitz SR, McGee DL. Sex differences in risk for coronary heart disease mortality associated with diabetes and established coronary heart disease. Arch Intern Med 2003;163(14):1735-1740. 12885690ArticlePubMed
- 14. Korea Centers for Disease Control and Prevention. 2008 Report on the Korea National Health and Nutrition Examination Survey. cited 2012 Sep 17. Available from: http://knhanes.cdc.go.kr/knhanes/sub04/sub04_03.do?classType=7 (Korean)
- 15. Korea Centers for Disease Control and Prevention. Food & nutrient intakes of Koreans in 2008: Korea National Health and Nutrition Examination Survey. Public Health Wkly Rep 2010;3(11):169-177. (Korean)
- 16. Franco-Marina F, Lazcano-Ponce E, Lopez-Carrillo L. Breast cancer mortality in Mexico: an age-period-cohort analysis. Salud Publica Mex 2009;51(Suppl 2):s157-s164. 19967270ArticlePubMed
- 17. Fuchs CS, Stampfer MJ, Colditz GA, Giovannucci EL, Manson JE, Kawachi I, et al. Alcohol consumption and mortality among women. N Engl J Med 1995;332(19):1245-1250. 7708067ArticlePubMed
- 18. Jhun HJ, Kim H, Cho SI. Time trend and age-period-cohort effects on acute myocardial infarction mortality in Korean adults from 1988 to 2007. J Korean Med Sci 2011;26(5):637-641. 21532854ArticlePubMedPMC
- 19. Choi Y, Kim Y, Park SK, Shin HR, Yoo KY. Age-period-cohort analysis of female breast cancer mortality in Korea. Breast Cancer 2006;13(3):266-271. 16929120ArticlePubMed
- 20. Kim BY. A development of the cause of death statistics. J Korean Official Stat 1999;4(2):1-30. (Korean)
REFERENCES
- Appendix 1
Appendix
Age-period-cohort effect of mortality rate caused by myocardial infarction from 1985 to 2009 using an intrinsic estimator. Error bars indicate a 95% confidence interval; age effects (A and D), period effects (B and E), and cohort effects (C and F). Results of total population in the present study indicate top line and results of gender-stratified analysis present bottom line.
Figure 1Age-period-cohort effect of mortality rate caused by ischemic heart disease from 1985 to 2009 using an intrinsic estimator. Error bars indicate a 95% confidence interval; age effects (A and D), period effects (B and E), and cohort effects (C and F). Results of total population in the present study indicate top line and results of gender-stratified analysis present bottom line.

Table 1.Age-adjusted mortality rate caused by ischemic heart disease (ICD 10 I20-I25) in Korean adults (aged 40 to 79) from 1985 to 2009
Figure & Data
References
Citations
Citations to this article as recorded by 
- Age-period-cohort Analysis of Cardiovascular Disease Mortality in Japan, 1995-2018
Tasuku Okui
Journal of Preventive Medicine and Public Health.2020; 53(3): 198. CrossRef - Trends in Incidence and Case Fatality Rates of Heart Disease and Its Subtypes in Korea, 2006–2015
Su Ra Seo, Shin Yi Jang, Sung-il Cho
International Journal of Environmental Research and Public Health.2020; 17(22): 8451. CrossRef - Age-period-cohort Analysis of Healthy Lifestyle Behaviors Using the National Health and Nutrition Survey in Japan
Tasuku Okui
Journal of Preventive Medicine and Public Health.2020; 53(6): 409. CrossRef - Analyzing Age-Period-Cohort Data: A Review and Critique
Ethan Fosse, Christopher Winship
Annual Review of Sociology.2019; 45(1): 467. CrossRef - Bounding Analyses of Age-Period-Cohort Effects
Ethan Fosse, Christopher Winship
Demography.2019; 56(5): 1975. CrossRef - Potentially modifiable blood triglyceride levels by the control of conventional risk factors
Bumjo Oh, Joohon Sung, Sohyun Chun
Lipids in Health and Disease.2019;[Epub] CrossRef - The Effects of Age, Period, and Cohort on Mortality from Ischemic Heart Disease in China
Jie Chang, Boyang Li, Jingjing Li, Yang Sun
International Journal of Environmental Research and Public Health.2017; 14(1): 50. CrossRef - The unrealized potential: cohort effects and age-period-cohort analysis
Jongho Heo, Sun-Young Jeon, Chang-Mo Oh, Jongnam Hwang, Juhwan Oh, Youngtae Cho
Epidemiology and Health.2017; 39: e2017056. CrossRef - Post-Translational Modifications of Cardiac Mitochondrial Proteins in Cardiovascular Disease: Not Lost in Translation
Jubert Marquez, Sung Ryul Lee, Nari Kim, Jin Han
Korean Circulation Journal.2016; 46(1): 1. CrossRef - Age, Period, and Cohort Effects on Mortality From Ischemic Heart Disease in Southern Spain
Ricardo Ocaña-Riola, José María Mayoral-Cortés, Alberto Fernández-Ajuria, Carmen Sánchez-Cantalejo, Piedad Martín-Olmedo, Encarnación Blanco-Reina
Revista Española de Cardiología (English Edition).2015; 68(5): 373. CrossRef - Efectos de la edad, el periodo de defunción y la cohorte de nacimiento en la mortalidad por enfermedad isquémica del corazón en el sur de España
Ricardo Ocaña-Riola, José María Mayoral-Cortés, Alberto Fernández-Ajuria, Carmen Sánchez-Cantalejo, Piedad Martín-Olmedo, Encarnación Blanco-Reina
Revista Española de Cardiología.2015; 68(5): 373. CrossRef - Role of strain values using automated function imaging on transthoracic echocardiography for the assessment of acute chest pain in emergency department
Mirae Lee, Sung-A Chang, Eun Jeong Cho, Sung-Ji Park, Jin-Oh Choi, Sang-Chol Lee, Jae K. Oh, Seung Woo Park
The International Journal of Cardiovascular Imaging.2015; 31(3): 547. CrossRef - Changes in the Practice of Coronary Revascularization between 2006 and 2010 in the Republic of Korea
Yoon Jung Choi, Jin-Bae Kim, Su-Jin Cho, Jaelim Cho, Jungwoo Sohn, Seong-Kyung Cho, Kyoung Hwa Ha, Changsoo Kim
Yonsei Medical Journal.2015; 56(4): 895. CrossRef - Decomposing Black-White Disparities in Heart Disease Mortality in the United States, 1973–2010: An Age-Period-Cohort Analysis
Michael R. Kramer, Amy L. Valderrama, Michele L. Casper
American Journal of Epidemiology.2015; 182(4): 302. CrossRef
 PubReader
 ePub Link
 Cite
Cite