
Articles
- Page Path
- HOME > J Prev Med Public Health > Volume 44(6); 2011 > Article
-
Original Article
Changes in Contribution of Causes of Death to Socioeconomic Mortality Inequalities in Korean Adults - Kyunghee Jung-Choi1, Young-Ho Khang2, Hong-Jun Cho3
-
Journal of Preventive Medicine and Public Health 2011;44(6):249-259.
DOI: https://doi.org/10.3961/jpmph.2011.44.6.249
Published online: November 14, 2011
1Department of Preventive Medicine, Ewha Womans University School of Medicine, Seoul, Korea.
2Department of Preventive Medicine, University of Ulsan College of Medicine, Seoul, Korea.
3Department of Family Medicine, Asan Medical Center, University of Ulsan College of Medicine, Seoul, Korea.
- Corresponding author: Kyunghee Jung-Choi, MD. PhD. 911-1, Mok-6-dong, Yandchun-gu, Seoul, 158-710, Korea. Tel: +82-2-2650-5824, Fax: +82-2-2653-1086, jungchoikh@gmail.com
Copyright © 2011 The Korean Society for Preventive Medicine
This is an Open Access article distributed under the terms of the Creative Commons Attribution Non-Commercial License (http://creativecommons.org/licenses/by-nc/3.0/) which permits unrestricted non-commercial use, distribution, and reproduction in any medium, provided the original work is properly cited.
ABSTRACT
-
Objectives
- This study aimed to analyze long-term trends in the contribution of each cause of death to socioeconomic inequalities in all-cause mortality among Korean adults.
-
Methods
- Data were collected from death certificates between 1990 and 2004 and from censuses in 1990, 1995, and 2000. Age-standardized death rates by gender were produced according to education as the socioeconomic position indicator, and the slope index of inequality was calculated to evaluate the contribution of each cause of death to socioeconomic inequalities in all-cause mortality.
-
Results
- Among adults aged 25-44, accidental injuries with transport accidents, suicide, liver disease and cerebrovascular disease made relatively large contributions to socioeconomic inequalities in all-cause mortality, while, among adults aged 45-64, liver disease, cerebrovascular disease, transport accidents, liver cancer, and lung cancer did so. Ischemic heart disease, a very important contributor to socioeconomic mortality inequality in North America and Western Europe, showed a very low contribution (less than 3%) in both genders of Koreans.
-
Conclusions
- Considering the contributions of different causes of death to absolute mortality inequalities, establishing effective strategies to reduce socioeconomic inequalities in mortality is warranted.
- Many empirical studies have reported socioeconomic inequalities in mortality in Korea. Although there are differences in the size and pattern of mortality inequalities depending on the cause of death, research results consistently show that the lower the socioeconomic position (SEP), the higher the risk of total mortality regardless of age and sex [1-5]. In 2005, the risk of death for 20- to 64-year-olds with an elementary school education or less was significantly greater than for those with an undergraduate education or more: 6.3 times higher among men, and 4.9 times higher among women [6]. In order to improve socioeconomic health inequalities, more aggressive strategic intervention is required, and various strategies are being tried in the United Kingdom, Sweden, and the Netherlands [7,8]. In Korea, since 2005, "enhancement of health equity" along with "extension of healthy life expectancy" has been suggested as an overarching goal of the Ministry of Health and Welfare based on a 2003 report titled Health Plan 2010 [9]. However, specific strategies or assignment selection are not sufficient to achieve this goal.
- In order to effectively decrease socioeconomic inequalities in mortality, it is important to acknowledge how much various causes of death contribute to the socioeconomic mortality inequalities [10-12]. Research on the contribution of causes of death to total inequalities in mortality can suggest a basis for specific intervention points. However, there are few studies that shed light on this topic [13]. Although a recent report did assess the contribution of causes of death to mortality inequalities in Korea, the study could neither include the entire Korean population nor address long-term tendencies [13].
- In Western countries, many studies have investigated the contribution of causes of death to socioeconomic inequalities in mortality. Kunst et al. [12] showed that the contribution of ischemic heart disease was substantial in northern European countries such as England, Wales, Ireland, Finland, Sweden, Norway, Denmark, and so on, but not in southern European a Mediterranean countries. This difference is referred to as the north-south gradient. Huisman et al. [11] found the contribution of cardiovascular disease to total death inequality by education to be high in eight countries as well. Even in the research done by Scania of Sweden, cardiovascular disease inequality accounted for more than 50% of the differential in total deaths [10]. Mackenbach et al. [14] stated that unlike in northern European countries, cancer makes a large contribution in southern European countries, and accidents make a large contribution in Eastern Europe. Research on the New Zealand population [15] showed a greater contribution by cardiovascular disease and a lower contribution by cancer.
- Because the contributions of various causes of death to total deaths in Korea are different than in other countries, it is predicted that the contribution of causes of death to socioeconomic inequalities is also different. This study aimed to analyze long-term trends in the contribution of each cause of death to socioeconomic inequalities in all-cause mortality among Korean adults, using absolute and relative inequality measures.
INTRODUCTION
- I. Research Data and Subjects
- This study utilized death certificate data and the national census data provided by the National Statistical Office. In order to explore the trends from 1990 to 2004, the authors used death data from all of those years, inclusive, as well as census data from the years 1990, 1995, and 2000. The subjects were divided into two age groups- 25-44 years old and 45-64 years old-based on their ages when the national census took place. Excluding those whose level of education and age are unknown, the 25 - 44 age group during this period included a total of 46 217 823 people (50.7% men and 49.3% women), and the 45-64 age group consisted of 23 950 067 people (48.9% men and 51.1% women). Deaths in the 25-44 age group between 1990 and 2004 totaled 415 399 (73.5% men and 26.5% women), while deaths in the 45-64 age group totaled 999 888 (70.3% men and 29.7% women).
- II. SEP Indicator
- Level of education was used as the SEP indicator. Because the levels of education in the death data between 1990 and 1992 were marked as "nonattendance" "elementary school graduate" "middle and high school graduate" and "college or higher" only, we could not distinguish between middle school-only graduates and high school graduates. Therefore, the subjects in this study are classified as "elementary school graduate or less" "middle school or high school graduate" and "college graduate or higher." Occupational class could be considered an SEP indicator, but the index of accordance for occupation information between census data and death data turned out to be lower than that for level of education [16].
- III. Statistical Analysis
- In order to calculate the mortality rate, the population of a given age group recorded in a given census year (1990, 1995, and 2000) was the denominator, and the number of people who died in the succeeding 5-year period among those who had been of the relevant age in the census year was the numerator. This method has been applied in previous reports [4,17] in order to reduce the risk of numerator-denominator bias. The mortality rate was calculated based on direct standardization methods; the national population from the census of the year 2005 data was set up as standard population; and the time periods were defined as 1990-1994, 1995-1999, and 2000-2004 based on the death data by gender. The confidence interval was estimated assuming a Poisson distribution of death cases.
- Age-adjusted mortality rates by gender for main causes of death were also calculated. The causes of death in the death data are coded according to the Korean Standard Classification of Diseases. Based on a previous report [4], 12 causes of death with a high mortality rate (11 causes for men, and 12 causes for women) were selected after classifying them based on middle classification (3 units). Terms for the causes of death in the Korean Standard Classification of Diseases and those of this study were used for convenience, as organized in Table 1.
- In order to evaluate the extent of socioeconomic inequalities in mortality, the slope index of inequality (SII) and the relative index of inequality (RII) were calculated. The SII is a slope of regression line that was obtained by mapping the death rate onto the middle value of each group's population size after arranging the population from lower to higher by SEP. The middle value of each population size was calculated after setting the total population size as 1 and was converted into an accumulated value. The SII indicates the absolute health gap between the person of hypothetically lowest rank and highest rank. For example, if the SII is 100 people per every 100 000 people, the absolute difference in risk of death between those with the lowest SEP and those with the highest is 100 people out of 100000. The RII is conceptualized as a value obtained by dividing the death rate value of the highest SEP case with the death rate value of the lowest case on the same regression line as the SII. If the RII is 3, then that means death risk among people with the lowest SEP is 3 times higher than that of people with the highest SEP. In this research, with the currently used methods as a reference [15], regression analysis was used after applying the age-adjusted death rate value into the middle value of each SEP group, and the SII was calculated by figuring out the slope of the regression line. The RII was obtained by using Poisson regression analysis based on the middle value of SEP.
- The contribution of cause of death to socioeconomic inequalities in mortality is calculated by figuring out how much the SII of the cause takes up in the SII of the total mortality as a percentage. The formula is given below:
- Absolute level of the contribution of the cause of death to total inequalities in mortality =
- [(SII for the relevant cause of death) / (SII of total mortality) * 100]
METHODS
A) Mortality rates
B) Socioeconomic inequalities in mortality
C) Contribution of cause of death to socioeconomic mortality inequalities
- The distribution of the number of total subjects and deaths by education level is presented in Table 2. Among men of both age groups, with the largest number were middle or high school graduates. This was likewise true among women aged 25-44, but among women aged 45-64, those with an elementary education or less comprised the biggest population. For those with an elementary education or less, mortality was higher than in the general population.
- The mortality rate in the year 2000-2004 was about 1112 per 100 000 in men aged 25-44 and 5024 per 100 000 in men aged 45-64 (Table 3). Mortality in women was lower than in men: 428 per 100 000 for those aged 25-44 and 1872 per 100 000 for those aged 45-64 (Table 4). The total mortality rate of both men and women showed a tendency to decrease. Most mortality rates for individual causes of death showed a tendency to decrease, as well.
- In the year 2000-2004, the most frequent causes of death were transport accidents, suicide, and liver disease for men aged 25-44, and cerebrovascular disease, liver disease, liver cancer, lung cancer, and stomach cancer for men aged 45-64 (Table 3). Mortality caused by suicide continuously increased. For men aged 45-64, the percentage of deaths caused by such diseases as ischemic heart disease, diabetes, and lung cancer had a tendency to increase. The percentage of deaths caused by transport accidents was at its highest in the years 1995-1999.
- Among women aged 25-44, suicide, stomach cancer, transport accidents, and cerebrovascular disease were the most common causes of death. In women aged 45-64, the most frequent causes of death were cerebrovascular disease, diabetes, liver cancer, and stomach cancer (Table 4). As with men, women's suicide mortality rate continuously increased both in absolute terms and as a percentage of all deaths. Mortality from breast cancer and ischemic heart disease also showed a tendency to increase in women aged 45-64. Transport accidents made up a higher percentage of total deaths in 1995-1999 than in the other periods.
- The size of socioeconomic mortality inequalities showed different tendencies from the mortality rate. The size of the SII by education level increased among men aged 25-44 and 45-64 and among women aged 45-64 in 1995-1999 compared to the 1990-1994 period, and then it decreased in 2000-2004, but not to the level of 1990-1994. The RII increased the most in the year 1995 -1999 in both men and women aged 25 - 44. However, the RII for both men and women aged 45-64 increased throughout the study period. (Table 5,6).
- The diseases with the highest SII in 2000-2004 were (in descending order) liver disease, suicide and transport accidents among men aged 25-44, and liver disease, cerebrovascular disease, transport accidents, lung cancer, and suicide among men aged 45- 64; this order is different from the order of most frequent causes of death (Table 5). The diseases with the highest RII were tuberculosis, liver disease, and diabetes in men aged 25-44, and tuberculosis, liver disease, transport accidents and other accidental injuries in men aged 45-64. Among men aged 25- 44, both the SII and the RII of most diseases showed a tendency to be the highest in the years 1995-1999. In the 45-64 age group, the RII showed a tendency to increase most of the time, and the SII for transport accidents, liver disease, and liver cancer was highest in 1995-1999.
- In women aged 25 - 44, suicide, cerebrovascular disease, transport accidents, and liver disease had the highest SII, as did cerebrovascular disease, diabetes, transport accidents, liver cancer, and liver disease in women aged 45-64 (Table 6). The RII was highest for (in descending order) diabetes, liver disease, tuberculosis, and cerebrovascular disease in women 25-44, and diabetes, transport accidents, cerebrovascular disease, and other accidental injuries in women 45-64. In the older age group, breast cancer disproportionately affected the highly educated, but the absolute size of SII seemed to decrease. Ischemic heart disease in both men and women aged 45-64 also disproportionately affected those with high education in 1990-1994, but after the year 1995 it was more likely to affect those with low education (Table 5,6).
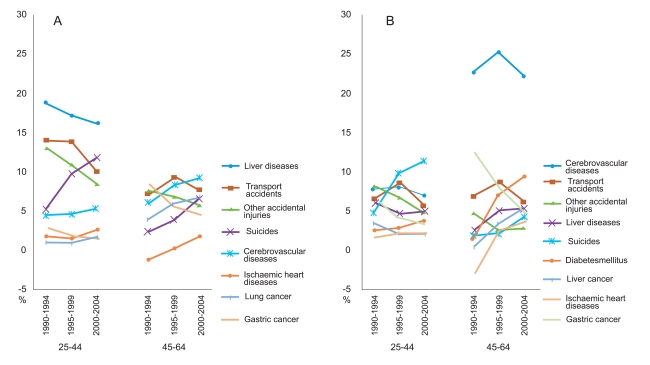
- In men 25 - 44, liver disease, suicide, transport accidents, and other accidental injuries, in all three periods, contributed the most to total mortality inequalities by education (Figure 1). In the year 2000-2004, liver disease, cerebrovascular disease, transport accident, lung cancer, and suicide showed a high contribution among men aged 45-64. In 45-64 years old, the contribution of cancer was demonstrated to rise compared to men 25-44. It was stomach cancer in 1990-1994, liver cancer in 1995-1999, and lung cancer in 2000-2004, respectively, which contributed the most. The contributions of suicide, cerebrovascular disease, and ischemic heart disease to total inequalities by education showed a tendency to increase, but that of liver disease and stomach cancer decreased. In men aged 45-64 the contribution of transport accidents to total inequalities increased in 1995-1999 compared to 1990-1994, and then it decreased in 2000-2004.
- In 2000 - 2004, the largest contributions to total mortality inequalities came from suicide, cerebrovascular disease, transport accidents, liver disease, and other accidental injuries among women aged 25-44, and among the older group of women, the largest contributions came from cerebrovascular disease, diabetes, transport accidents, liver cancer and liver disease (Figure 1). In 1990-1994 and 1995-1999 the contribution of stomach cancer was higher than that of liver cancer, but the contribution of stomach cancer decreased consistently and was lower than that of liver cancer in 2000-2004. The contribution of suicide, diabetes, and ischemic heart disease has increased. The contribution of cerebrovascular disease and transport accidents was highest in the year 1995-1999. Women, in contrast to men, showed a lower contribution of liver disease to the total mortality inequalities and a higher contribution of cerebrovascular disease. The contribution of stomach cancer was higher in women, and those of liver cancer and lung cancer were higher in men.
RESULTS
- This study showed that, despite the decrease in Korea's national mortality rate, socioeconomic inequalities in mortality by education have not decreased even in absolute terms. The main sources of socioeconomic inequalities in mortality were suicide, accidental injuries (including transport accidents), liver disease, and cerebrovascular disease among both men and women aged 25-44; liver disease, cerebrovascular disease, transport accidents, lung cancer, and suicide among men aged 45-64; and cerebrovascular disease, diabetes, transport accidents, liver disease and liver cancer among women aged 45-64. The contributions of suicide and ischemic heart disease had a tendency to rise, and the contribution of transport accidents was higher in 1995-1999 compared to the other periods.
- The RII shows a tendency to increase as the mortality rate decreases, whereas the SII shows the opposite trend [18-20]. However, the SII is not only related to the mortality rate, but also the size of the RII [18]. Thus, just because the mortality rate decreases, it doesn't necessarily follow that the SII decreases; this varies depending on the characteristics of disease epidemics and whether or not there is a strategic effort to decrease the socioeconomic mortality inequalities. This study also found that diseases with high mortality rates and those with a high SII showed different trends. After the year 1990-1994, the national total mortality rate consistently decreased in both men and women, but the increase in relative mortality inequality meant that the absolute mortality inequality didn't decrease. This demonstrates that strategic intervention on mortality inequalities is urgent.
- The pattern of the contribution of various death causes to socioeconomic mortality inequalities in Korea was different from that of northern or western European countries. The biggest difference involved ischemic heart disease. According to the research of Mackenbach et al. [14], which studied a population aged 30-74, this was the disease with the biggest contribution to total mortality inequalities in Finland, Sweden, and Norway, and it accounted for about 30%. This tendency was found to be similar in western Europe and New Zealand [10-12]. However, in this study, the percentage that ischemic heart disease contributed to total mortality inequalities was less than 3%. This indicates that any strategic interventions undertaken in Korea to decrease socioeconomic mortality inequalities should be different from those undertaken in other countries.
- Korea's ischemic heart disease mortality rate, however, is increasing, and the pattern of inequality associated with ischemic heart disease is changing as well [4]. Among both women and men aged 45-64, ischemic heart disease caused higher mortality in those of higher education in the year 1990-1994, but it caused higher mortality-and increased inequality-in those of lower education in the years 2000-2004. Among adults aged 25-44, the inequality was disadvantageous to those of lower education and the size of the inequality also increased. This result is similar to that of Khang et al. [4], and this reflects on the fact that the distribution of risk factors of ischemic heart disease is changing by generalizing the westernized diet in Korea. It is predicted that if this tendency continues, both mortality caused by ischemic heart disease and the inequality associated with it will rise.
- Along with ischemic heart disease, suicide was a leading cause of death whose contribution to total mortality inequalities is increasing rapidly. Especially among women aged 25-44 whose SII of total mortality is consistently rising, suicide contributed significantly to the increase in total mortality inequalities. The national suicide mortality rate has been showing a tendency to increase since the early 1990s, with especially noticeable upsurges during the Korea's economic crisis of 1998 and during the credit crisis of 2003 [21]. Macroscopic socioeconomic changes can cause changes in mortality rates [22,23]. During this period, not only did the suicide mortality rate increase, but socioeconomic inequality in suicide mortality increased in both relative and absolute terms. This aspect explains the high and increasing contribution of suicide to absolute mortality inequalities and suggests that the aftermath of the negative socioeconomic changes had a greater effect on socioeconomically disadvantaged groups. In some countries that went through similar socioeconomic changes, the suicide rate did not rise, thanks to the social system and policy-related actions [23]. Thus, it is imperative to seek a new direction and appropriate suicide prevention policies.
- Transport accidents accounted for 5-10% of total mortality inequalities in 2000-2004. The subjects and research methods of this study were somewhat different from those of previous studies, but considering that research done in the U.S.A. and Sweden [10,24] found that mortality by transport accidents contributed less than 2% to the total mortality inequality, the contribution of transport accidents in Korea seems to be relatively large. Korea ranks third out of 26 countries in accident death rate, and the RII is also large [26] hence, the high SII and high contribution to total inequalities. Inequality in transport accident mortality made a particularly high contribution to total inequalities in the year 1995-1999. This could be seen as a result of a rapid increase in relative inequality in that period, although death rate from transport accidents showed a tendency to decrease afterward. Borreli et al. [26], who studied the relationship between deaths from transport accidents and education level, stated that subjects of lower SEP have more fatal transport accidents because they do not have the financial means to buy new cars, because they rarely use protective gear like a seat belts, and because there is a higher possibility that they live in regions with a higher risk of traffic accidents. However, more studies are needed in order to determine why the RII of national traffic accidents increased so rapidly in 1995-1999, and why it shows a consistent tendency to grow.
- Liver disease contributed the most to total SII in men, although it tends to decrease in terms of its contribution to total inequality. The main risk factor for liver disease is hepatitis B and hepatitis C infection. The risk of chronic hepatitis B developing into liver cirrhosis varies according to age, sex, drinking habits, the extent to which the liver is fiberized, the extent to which the hepatitis B is duplicated, whether or not the patient is infected with HCV, HDV, or HIV, etc. [27]. According to the 2009 National Health and Nutrition Survey, the rate of infection with the hepatitis B antigen among Koreans aged 30 and above is 4.5% in men and 3.4% in women. The researchers were unable to determine whether the rate of hepatitis B infection is higher in groups of lower SEP [28]. However, considering studies from other countries [29,30] which have found people of socioeconomically disadvantaged status to have higher rates of infection, studies about inequalities of hepatitis B virus infection according to age in Korea is needed.
- Among women, the contribution of cerebrovascular disease and diabetes to total death inequalities was higher than among men. Despite the fact that the absolute death rate from cerebrovascular disease and diabetes is not higher in women than men, the reason its contribution turned to be high is that death rates from liver disease and accidents are relatively low in women compared to men. This gender difference may be explained by the distribution of risk factors for liver disease and accidents. Women are involved in less social activity, there are fewer women who earn their living by driving, most industrial accidents happen to men [31], the infection rate for hepatitis B is lower in women, the heavy drinking rate is much lower in women [28], and so on. All of these differences have an effect on the occurrence rate of liver disease and accidents and their contribution to mortality inequalities.
- Diseases such as liver disease, cerebrovascular disease, stomach cancer, and liver cancer, whose contribution to the total mortality inequalities is high in Korea, are known to be diseases whose occurrence in adults is related to exposure to risk factors in childhood [32]. Among people aged 45-64, the contribution of these diseases was about 40%. Other researchers have found that the more living standards improve, the less frequently these diseases occur, and this study bears out that observation as well. However, in order for the decrease in occurrence rate to lead to a decrease in the absolute contribution, there must be an effort to lessen the relative inequality of exposure to the risks during childhood.
- Among adults aged 45-64, the contribution of cancer was relatively high. Kim [33] used 2001 cancer registration data to investigate the social differentials in the occurrence and fatality rate of cancer between those receiving free medical care due to poverty and the high-income group. The relative ratio of cancer occurrence was found to be 1.11, but once cancer occurred, the death risk of the former group was 3.09 times higher than that of the latter group. Among Korean cancer patients, income-based inequalities were observed in the use of both outpatient and inpatient medical services, medical fees, and the type of medical facility used [34]. In addition, inequalities in early cancer screening [35] and in the stage at which cancer was diagnosed during screening [36] were reported. All of these inequalities-in particular, the inequalities in medical use-should be given significant weight in the policy-making process.
- This research used the SII and RII as tools to measure socioeconomic mortality inequalities. While relative risk ratio or risk difference are comparable between two groups only, the SII and RII can compare three or more groups to make one value index after considering the death rate of each group. And the SII and RII take into account the size of each group population [37].
- This study has some limitations. It used unlinked data with the possibility of a numerator-denominator bias. However, according to a study by Kim and Khang [38], when the education level is divided into three categories (elementary school or less, middle or high school graduate, college or higher), the accordance rate was 89.4%, and the kappa value was 0.75, which was considered substantial. Khang et al. [16] reported that the reliability was very high when they divided the population into the three aforementioned categories. Thus, numerator-denominator bias can be presumed to have had little effect on these results. In addition, we tried to minimize the numerator-denominator bias by analyzing death data based on age when the census was taken. Thus, when the number of people who were 25-44 years old in the year 1990 is used as denominator, the numerator was the number of deaths in 1990-1994 among those who were aged 25-44 in the year 1990 only, not in the succeeding years.
- This study provides a way to establish priorities in terms of national socioeconomic mortality inequalities policy, and suggests specific and direct evidence. Korea, whose death structure is different from other countries, needs to establish policies on health inequality that consider the current national situation. Unlike Europe, whose policy priority is ischemic heart disease, Korea should give priority to diseases such as accidental injuries, liver disease, and cerebrovascular disease in order to decrease socioeconomic inequality in mortality among Korean adults. For suicide and diabetes, whose contribution to the total inequality is continuously increasing, more aggressive measures should be sought. In order to decrease socioeconomic health inequality, both upstream solutions (for the fundamental root causes of health inequality) and downstream solutions (for risk factors according to the socioeconomic status) are necessary. This research presents data that can be used as grounds for selecting which diseases to concentrate on for downstream solutions. The seriousness of the situation has to be recognized: despite the consistent decrease in the death rate, socioeconomic mortality inequalities by education are not decreasing even in absolute terms. In conclusion, based on the result of this research, Korea should establish policies that have more specific goals and that are more effective in decreasing socioeconomic health inequalities.
DISCUSSION
-
The authors have no conflicts of interest with the material presented in this paper.
-
This article is available at http://jpmph.org/.
Notes
- 1. Son M, Oh J, Choi YJ, Kong JO, Choi J, Jin E, et al. The effects of the parents' social class on infant and child death among 1995-2004 birth cohort in Korea. J Prev Med Public Health 2006;39(6):469-476. (Korean). 17168199PubMed
- 2. Cho HJ, Khang YH, Yang S, Harper S, Lynch JW. Socioeconomic differentials in cause-specific mortality among South Korean adolescents. Int J Epidemiol 2007;36(1):50-57. 17085457ArticlePubMed
- 3. Khang YH, Kim HR. Socioeconomic mortality inequality in Korea: mortality follow-up of the 1998 National Health and Nutrition Examination Survey (NHANES) data. J Prev Med Public Health 2006;39(2):115-122. (Korean). 16615265PubMed
- 4. Khang YH, Lynch JW, Kaplan GA. Health inequalities in Korea: age- and sex-specific educational differences in the 10 leading causes of death. Int J Epidemiol 2004;33(2):299-308. 15082630ArticlePubMed
- 5. Jeong BG, Jung KY, Kim JY, Moon OR, Lee YH, Hong YS, et al. The relationship between regional material deprivation and the standardized mortality ratio of the community residents aged 15-64 in Korea. J Prev Med Public Health 2006;39(1):46-52. (Korean). 16613071PubMed
- 6. Yi JH. Socioeconomic inequalities in mortality and its trends- by education and occupational class in 1995, 2000 and 2005 [dissertation]. 2007. Seoul: Seoul National University; (Korean)
- 7. Mackenbach JP, Bakker MJ. European Network on Interventions and Policies to Reduce Inequalities in Health. Tackling socioeconomic inequalities in health: analysis of European experiences. Lancet 2003;362(9393):1409-1414. 14585645ArticlePubMed
- 8. Mackenbach JP. Can we reduce health inequalities? An analysis of the English strategy (1997-2010). J Epidemiol Community Health 2011;65(7):568-575. 21459930ArticlePubMed
- 9. Ministry of Health and Welfare. Health plan 2010. 2005. Seoul: Ministry of Health and Welfare; (Korean)
- 10. Rosvall M, Chaix B, Lynch J, Lindstrõm M, Merlo J. Contribution of main causes of death to social inequalities in mortality in the whole population of Scania, Sweden. BMC Public Health 2006;6: 79. 16569222ArticlePubMedPMC
- 11. Huisman M, Kunst AE, Bopp M, Borgan JK, Borrell C, Costa G, et al. Educational inequalities in cause-specific mortality in middle-aged and older men and women in eight western European populations. Lancet 2005;365(9458):493-500. 15705459ArticlePubMed
- 12. Kunst AE, Groenhof F, Mackenbach JP, Health EW. EU Working Group on Socioeconomic Inequalities in Health. Occupational class and cause specific mortality in middle aged men in 11 European countries: comparison of population based studies. BMJ 1998;316(7145):1636-1642. 9603745ArticlePubMedPMC
- 13. Jung-Choi K, Khang YH, Cho HJ. Socioeconomic differentials in cause-specific mortality among 1.4 million South Korean public servants and their dependents. J Epidemiol Community Health 2011;65(7):632-638. 20584732ArticlePubMed
- 14. Mackenbach JP, Stirbu I, Roskam AJ, Schaap MM, Menvielle G, Leinsalu M, et al. Socioeconomic inequalities in health in 22 European countries. N Engl J Med 2008;358(23):2468-2481. 18525043ArticlePubMed
- 15. Fawcett J, Blakely T. Cancer is overtaking cardiovascular disease as the main driver of socioeconomic inequalities in mortality: New Zealand (1981-99). J Epidemiol Community Health 2007;61(1):59-66. 17183017ArticlePubMedPMC
- 16. Khang YH, Kim HR, Lynch JW. Consistency between education reported in health survey and recorded in death certificate. BMC Public Health 2007;7: 294. 17941999ArticlePubMedPMC
- 17. Khang YH, Lynch JW, Yun S, Lee SI. Trends in socioeconomic health inequalities in Korea: use of mortality and morbidity measures. J Epidemiol Community Health 2004;58(4):308-314. 15026444ArticlePubMedPMC
- 18. Houweling TA, Kunst AE, Huisman M, Mackenbach JP. Using relative and absolute measures for monitoring health inequalities: experiences from cross-national analyses on maternal and child health. Int J Equity Health 2007;6: 15. 17967166ArticlePubMedPMC
- 19. Mackenbach JP, Kunst AE, Cavelaars AE, Groenhof F, Geurts JJ. Socioeconomic inequalities in morbidity and mortality in western Europe. The EU Working Group on Socioeconomic Inequalities in Health. Lancet 1997;349(9066):1655-1659. 9186383ArticlePubMed
- 20. Vagero D, Erikson R. Socioeconomic inequalities in morbidity and mortality in western Europe. Lancet 1997;350(9076):516. 9274598Article
- 21. Lee WY, Khang YH, Noh M, Ryu JI, Son M, Hong YP. Trends in educational differentials in suicide mortality between 1993-2006 in Korea. Yonsei Med J 2009;50(4):482-492. 19718395ArticlePubMedPMC
- 22. Men T, Brennan P, Boffetta P, Zaridze D. Russian mortality trends for 1991-2001: analysis by cause and region. BMJ 2003;327(7421):964. 14576248ArticlePubMedPMC
- 23. Chang SS, Gunnell D, Sterne JA, Lu TH, Cheng AT. Was the economic crisis 1997-1998 responsible for rising suicide rates in East/Southeast Asia? A time-trend analysis for Japan, Hong Kong, South Korea, Taiwan, Singapore and Thailand. Soc Sci Med 2009;68(7):1322-1331. 19200631ArticlePubMed
- 24. Wong MD, Shapiro MF, Boscardin WJ, Ettner SL. Contribution of major diseases to disparities in mortality. N Engl J Med 2002;347(20):1585-1592. 12432046ArticlePubMed
- 25. OECD health data 2010. OECD. cited 2011 Apr 24. Available from: http://www.ecosante.org/index2.php?base=OCDE&langs=ENG&langh=ENG&ref=YES&sessionid=033db9d796fe37ed1687528c1a1fc45dArticle
- 26. Borrell C, Plasencia A, Huisman M, Costa G, Kunst A, Andersen O, et al. Education level inequalities and transportation injury mortality in the middle aged and elderly in European settings. Inj Prev 2005;11(3):138-142. 15933403ArticlePubMedPMC
- 27. Fattovich G, Bortolotti F, Donato F. Natural history of chronic hepatitis B: special emphasis on disease progression and prognostic factors. J Hepatol 2008;48(2):335-352. 18096267ArticlePubMed
- 28. Korea Centers for Disease Control. Korea health statistics 2009: Korea National Health and Nutrition Examination Survey (KNHANES IV-3). 2010. Seoul: Ministry of Health & Welfare; (Korean)
- 29. Pereira LM, Martelli CM, Merchan-Hamann E, Montarroyos UR, Braga MC, de Lima ML, et al. Population-based multicentric survey of hepatitis B infection and risk factor differences among three regions in Brazil. Am J Trop Med Hyg 2009;81(2):240-247. 19635877ArticlePubMed
- 30. Michos A, Terzidis A, Kalampoki V, Pantelakis K, Spanos T, Petridou ET. Seroprevalence and risk factors for hepatitis A, B, and C among Roma and non-Roma children in a deprived area of Athens, Greece. J Med Virol 2008;80(5):791-797. 18360892ArticlePubMed
- 31. Ministry of Employment and Labor. Industrial injuries and illnesses 2008. 2010. Seoul: Ministry of Employment and Labor; (Korean)
- 32. Galobardes B, Lynch JW, Davey Smith G. Childhood socioeconomic circumstances and cause-specific mortality in adulthood: systematic review and interpretation. Epidemiol Rev 2004;26: 7-21. 15234944ArticlePubMed
- 33. Kim CW. Inequality in incidence, fatality and utilization of cancer patients across income groups in South Korea [dissertation]. 2005. Seoul: Seoul National University; (Korean)
- 34. Yoon TH, Lee SY, Kim CW, Kim SY, Jeong BG, Park HK. Inequalities in medical care utilization by South Korean cancer patients according to income: a retrospective cohort study. Int J Health Serv 2011;41(1):51-66. 21319720ArticlePubMed
- 35. Lee K, Lim HT, Hwang SS, Chae DW, Park SM. Socioeconomic disparities in behavioural risk factors for cancer and use of cancer screening services in Korean adults aged 30 years and older: the Third Korean National Health and Nutrition Examination Survey, 2005 (KNHANES III). Public Health 2010;124(12):698-704. 20888016ArticlePubMed
- 36. Halpern MT, Pavluck AL, Ko CY, Ward EM. Factors associated with colon cancer stage at diagnosis. Dig Dis Sci 2009;54(12):2680-2693. 19117126ArticlePubMed
- 37. Harper S, Lynch J. In: Oakes JM, Kaufman JS, editors. Measuring health inequalities. Methods in social epidemiology. 2006. 1st ed. San Francisco: Jossey-Bass; p. 134-168
- 38. Kim HR, Khang YH. Reliability of education and occupational class: a comparison of health survey and death certificate data. J Prev Med Public Health 2005;38(4):443-448. (Korean). 16358831PubMed
REFERENCES
KSCD: Korean Standard Classification of Diseases and Causes of Death. Other external causes of accidental injury [W00-X59] include falls, exposure to inanimate mechanical forces, exposure to animate mechanical forces, accidental drowning and submersion, other accidental threats to breathing, exposure to electric current, radiation and extreme ambient air temperature and pressure, exposure to smoke, fire and flames, contact with heat and hot substances, contact with venomous animals and plants, exposure to forces of nature, accidental poisoning by and exposure to noxious substances, overexertion, travel and privation, and accidental exposure to other and unspecified factors.
Figure & Data
References
Citations
- Educational inequalities in adult mortality: a systematic review and meta-analysis of the Asia Pacific region
Kathryn Christine Beck, Mirza Balaj, Lorena Donadello, Talal Mohammad, Hanne Dahl Vonen, Claire Degail, Kristoffer Eikemo, Anna Giouleka, Indrit Gradeci, Celine Westby, Kam Sripada, Magnus Rom Jensen, Solvor Solhaug, Emmanuela Gakidou, Terje Andreas Eikem
BMJ Open.2022; 12(8): e059042. CrossRef - Socioeconomic Disparities in Cardiovascular Health in South Korea
Chi-Young Lee, Eun-Ok Im
Journal of Cardiovascular Nursing.2021; 36(1): 8. CrossRef - Mainstreaming of Health Equity in Infectious Disease Control Policy During the COVID-19 Pandemic Era
Hongjo Choi, Seong-Yi Kim, Jung-Woo Kim, Yukyung Park, Myoung-Hee Kim
Journal of Preventive Medicine and Public Health.2021; 54(1): 1. CrossRef - Cancer Incidence by Occupation in Korea: Longitudinal Analysis of a Nationwide Cohort
Hye-Eun Lee, Masayoshi Zaitsu, Eun-A Kim, Ichiro Kawachi
Safety and Health at Work.2020; 11(1): 41. CrossRef - Mortality inequalities by occupational class among men in Japan, South Korea and eight European countries: a national register-based study, 1990–2015
Hirokazu Tanaka, Wilma J Nusselder, Matthias Bopp, Henrik Brønnum-Hansen, Ramune Kalediene, Jung Su Lee, Mall Leinsalu, Pekka Martikainen, Gwenn Menvielle, Yasuki Kobayashi, Johan P Mackenbach
Journal of Epidemiology and Community Health.2019; 73(8): 750. CrossRef - Measurement of Socioeconomic Position in Research on Cardiovascular Health Disparities in Korea: A Systematic Review
Chi-Young Lee, Yong-Hwan Lee
Journal of Preventive Medicine and Public Health.2019; 52(5): 281. CrossRef - Forty years of economic growth and plummeting mortality: the mortality experience of the poorly educated in South Korea
Jinwook Bahk, John W Lynch, Young-Ho Khang
Journal of Epidemiology and Community Health.2017; 71(3): 282. CrossRef - Increased breast cancer mortality only in the lower education group: age-period-cohort effect in breast cancer mortality by educational level in South Korea, 1983-2012
Jinwook Bahk, Sung-Mi Jang, Kyunghee Jung-Choi
International Journal for Equity in Health.2017;[Epub] CrossRef - Effects of Periodontal Disease on Cardio-Cerebrovascular Disease: A Focus on Personal Income and Social Deprivation
Min-Young Kim, Hosung Shin
Journal of Dental Hygiene Science.2017; 17(4): 375. CrossRef - Joint Symposium of Korean Cancer Association & UICC-ARO—Cross-boundary cancer studies: cancer and Universal Health Coverage (UHC) in Asia
Eun-Cheol Park, Norie Kawahara, Shinjiro Nozaki, Hasbullah Thabrany, Shunya Yoshimi, Sohee Park, Duk Hyoung Lee, Hideyuki Akaza, Jae Kyung Roh
Japanese Journal of Clinical Oncology.2017; 47(9): 889. CrossRef - Impact of Childhood Socioeconomic Position on Self‐Rated Health Trajectories of South Korean Adults
Joan P. Yoo, Min Sang Yoo
Asian Social Work and Policy Review.2016; 10(1): 142. CrossRef - Mortality rates by occupation in Korea: a nationwide, 13-year follow-up study
Hye-Eun Lee, Hyoung-Ryoul Kim, Yun Kyung Chung, Seong-Kyu Kang, Eun-A Kim
Occupational and Environmental Medicine.2016; 73(5): 329. CrossRef - Educational Inequality in Female Cancer Mortality in Korea
Mi-Hyun Kim, Kyunghee Jung-Choi, Hyoeun Kim, Yun-Mi Song
Journal of Korean Medical Science.2015; 30(1): 1. CrossRef - The population attributable fraction of low education for mortality in South Korea with improvement in educational attainment and no improvement in mortality inequalities
Dohee Lim, Kyoung Ae Kong, Hye Ah Lee, Won Kyung Lee, Su Hyun Park, Sun Jung Baik, Hyesook Park, Kyunghee Jung-Choi
BMC Public Health.2015;[Epub] CrossRef - Sex Differences Associated With Hepatitis B Virus Surface Antigen Seropositivity Unwareness in Hepatitis B Virus Surface Antigen-positive Adults: 2007‐2012 Korea National Health and Nutrition Examination Survey
Suk-Yong Jang, Sung-In Jang, Hong-Chul Bae, Jaeyong Shin, Eun-Cheol Park
Journal of Preventive Medicine and Public Health.2015; 48(2): 74. CrossRef - Decomposition of educational differences in life expectancy by age and causes of death among South Korean adults
Kyunghee Jung-Choi, Young-Ho Khang, Hong-Jun Cho, Sung-Cheol Yun
BMC Public Health.2014;[Epub] CrossRef - Trends in income-related health inequalities in self-assessed health in Korea, 1998–2011
Jong Won Min
Global Public Health.2014; 9(9): 1053. CrossRef - Cancer Control and the Communication Innovation in South Korea: Implications for Cancer Disparities
Minsoo Jung
Asian Pacific Journal of Cancer Prevention.2013; 14(6): 3411. CrossRef - Socioeconomic inequalities in health status in Korea
Kyunghee Jung-Choi, Yu-Mi Kim
Journal of the Korean Medical Association.2013; 56(3): 167. CrossRef - Difference of Area-based deprivation and Education on Cerebrovascular Mortality in Korea
Jeoung-Ha Sim, Dong-Choon Ahn, Mi-A Son
Korean Journal of Health Policy and Administration.2012; 22(2): 163. CrossRef
 PubReader
 ePub Link
 Cite
Cite

