
Articles
- Page Path
- HOME > J Prev Med Public Health > Volume 44(3); 2011 > Article
-
Original Article
Changes in the Distribution of Maternal Age and Parity and Increasing Trends in the Low Birth Weight Rate in Korea Between 1995 and 2005 - Jisuk Bae1, Jung Han Park1, Yoo Keun Park2, Jong-Yeon Kim1, Sang-Won Lee3, Soon-Woo Park1
-
Journal of Preventive Medicine and Public Health 2011;44(3):111-117.
DOI: https://doi.org/10.3961/jpmph.2011.44.3.111
Published online: May 17, 2010
1Department of Preventive Medicine, Catholic University of Daegu School of Medicine, Daegu, Korea.
2Wonchodang Oriental Medical Clinic, Seoul, Korea.
3Department of Preventive Medicine, CHA University, Gumi, Korea.
- Corresponding author: Jung Han Park, MD, MPH, DrPH. 3056-6 Daemyung-4dong, Nam-gu, Daegu, 705-718, Korea. Tel: +82-53-650-4495, Fax: +82-53-654-3881, jhpark@cu.ac.kr
• Received: July 12, 2010 • Accepted: December 20, 2010
Copyright © 2011 The Korean Society for Preventive Medicine
This is an Open Access article distributed under the terms of the Creative Commons Attribution Non-Commercial License (http://creativecommons.org/licenses/by-nc/3.0/) which permits unrestricted non-commercial use, distribution, and reproduction in any medium, provided the original work is properly cited.
ABSTRACT
-
Objectives
- This study measured the impact of shifts in maternal age and parity on the increase in the low birth weight (LBW) rate in Korea.
-
Methods
- We obtained raw data for all 6 397 945 live births registered at the Korea National Statistical Office between 1995 and 2005. We calculated the proportion of increment in the LBW rate due to changes in the distribution of maternal age and parity (AP-dis) and the proportion due to changes in the age- and parity-specific LBW rate (AP-spe).
-
Results
- The LBW rate increased from 3.02% in 1995 to 4.28% in 2005. The multiple birth rate increased from 1.32% to 2.19% during the same period. Of the 1.26% points increment in the LBW rate, 0.64% points occurred among singleton births and 0.62% points occurred among multiple births. Changes in the AP-dis accounted for 50% of the increase in the LBW rate among singleton births, but did not contribute to the increase in the LBW rate among multiple births. The remainder of the total increment in the LBW rate was explained by the increase in the AP-spe.
-
Conclusions
- This study demonstrated that shifts in maternal age and parity among singleton births and increased multiple births were important contributors to the increment in the LBW rate. This study also revealed that the increase in the AP-spe was an equally important contributor as the shifts in maternal age and parity to the increment in the LBW rate among singleton births and was a major contributor among multiple births.
- The total fertility rate in the Republic of Korea (ROK) steadily declined from 4.53 in 1970 to 1.08 in 2005, reflecting delayed marriage and more couples having fewer children [1]. The mean maternal age for all births increased from 28.0 in 1995 to 30.2 in 2005 [1]. A more concerning national statistic, however, is the decline in the mean birth weight from 3.34 kg in 1995 to 3.26 kg in 2005. The percentage of babies born with a low birth weight (LBW), defined as a birth weight < 2500 g [2], increased from 3.0% to 4.3% during the same period [1].
- The mother's age at delivery and parity are associated with infant birth weight. Women < 20 years and ≥ 30 years of age have a higher LBW rate than women 20-29 years of age [1,3-5]. The LBW rate is higher for first births than second and third births, then increases as the birth order increases beyond four [1,6]. Advanced maternal age and the proportion of first-born infants in women ≥ 30 years of age may have contributed to the increase in the LBW rate in the ROK [1,3-6]. There was also a steady increase in the rate of multiple births, from 1.3% in 1995 to 2.2% in 2005 [1]. The increase in the multiple birth rate may also have contributed to the increase in the preterm birth and LBW rates [1,4].
- Birth weight is one of the most sensitive and accessible indicators of newborn health and is directly related to the gestational age. Birth weight has a great significance because it is strongly associated with infant mortality, developmental problems in childhood, and the risk of various diseases in adulthood, including diabetes, hypertension, and cardiovascular conditions [7-10]. Therefore, the identification of factors related to the increase in the LBW rate and the prevention of LBW births are important and urgent public health issues.
- Although the association of maternal age and parity with the LBW rate is well-established, to our knowledge, only one study that measured the impact of shifts in maternal age and parity on the increase in the LBW rate has been published [11]. Yang et al. [11] evaluated the effects of changes in the distribution of maternal age and parity (AP-dis) and changes in the age- and parity-specific LBW rate (AP-spe) on the LBW trends in the United States between 1980 and 2000 using a decomposition method; however, one of the limitations of the study was that the analysis was restricted to singleton births.
- If the AP-spe remains constant over time, increasing trends in the LBW rate may be predominantly attributed to changes in the AP-dis. On the contrary, if the AP-spe changes over time, increasing trends in the LBW rate may be attributed to changes in such risk factors for LBW births as personal lifestyles, environmental factors, and obstetrical practices [11-16]. Thus, we evaluated these two components of changes in the LBW rate for singleton and multiple births separately between 1995 and 2005 in the ROK.
INTRODUCTION
- I. Research Data
- We obtained raw data for all live births registered at the National Statistical Office of the ROK for the period between 1995 and 2005. There were 6 397 945 registered births, and the analysis was conducted for 6 361 162 births after excluding 36 783 births that had recorded a birth weight < 500 g or missing data for birth weight, birth plurality, maternal age, and/or parity. Although both the gestational age and birth weight were recorded on the birth certificate, we used the birth weight data alone because it was more accurately recorded than the data on gestational age.
- II. Data Analysis
- The LBW rate was calculated for each year between 1995 and 2005. The Cochran-Armitage trend test was used to test the significance of trends in the LBW rate over a 10-year period. Differences in the AP-dis or AP-spe between 1995 and 2005 were tested by a chi-square test or Fisher's exact test. To evaluate statistical significance, a two-sided significance level of 0.05 was used. Statistical analysis was performed using SAS version 9.1 (SAS Inc., Cary, NC, USA).
- To partition the increase in the LBW rates between 1995 and 2005 into the increase due to changes in the AP-dis and the increase due to changes in the AP-spe, we used the following standardization method, as modified by the authors [17-19].
- The standard population is cross-tabulated by age, where i=1, 2, ..., i (≤19, 20-24, 25-29, 30-34, 35-39, and ≥40), and parity, where j=1, 2, ..., j (1, 2, and ≥ 3). The AP-spe is
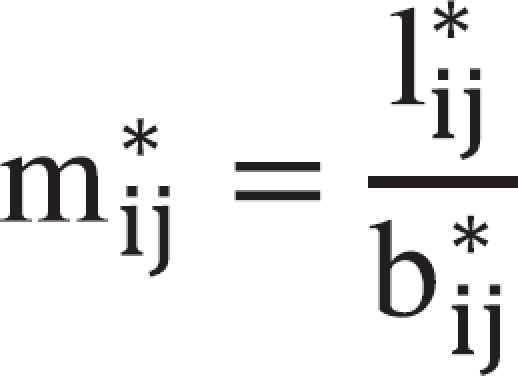
- where mij is the LBW rate of ij-th cells, lij the number of LBW births in the ij-th cells, and bij the number of births in the ij-th cells. The asterisk denotes the standard population. The overall LBW rate, M, is
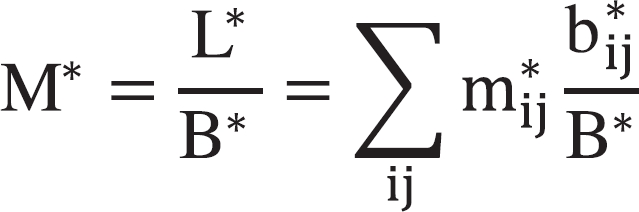
- where L is the total number of LBW births, and B the total number of births. The ratio of m*ij to M* , k*ij is
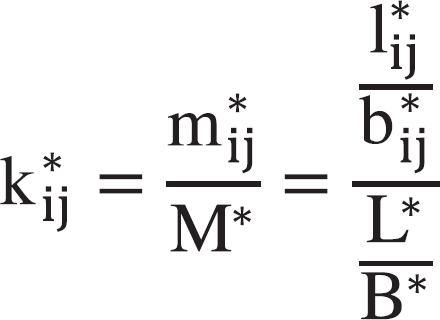
- If the AP-spe did not change since 1995 (standard population) and remained the same in 2005 (study population), but the AP-dis of births changed over the time period, then the changes in the risk of LBW births in the study population due to changes in the AP-dis can be given by
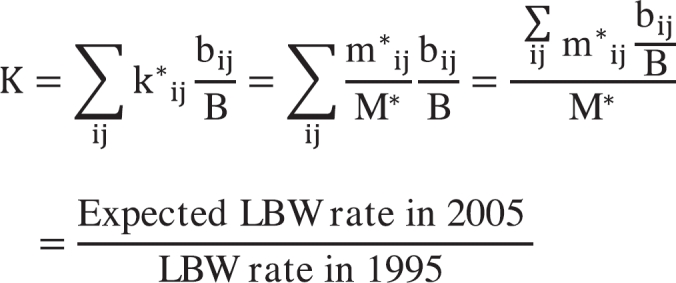
- where
 is the proportion of births in 2005 in the ij-th cells. K is named the age-parity score, which can be directly interpreted as the percentage difference in the LBW rate with reference to the standard population.
 - In our analysis, the expected LBW rate in 2005 was K multiplied by the LBW rate in 1995. Subsequently, changes in the LBW rate due to changes in the AP-dis (AP-dis_ΔLBW) and AP-spe (AP-spe_ΔLBW) can be calculated as follows:
- AP-dis_ΔLBW = expected LBW % in 2005 - LBW % in 1995
- AP-spe_ΔLBW = observed LBW % in 2005 - expected LBW % in 2005
- We calculated these two components for singleton and multiple births separately. This study was approved by the Institutional Review Board of Daegu Catholic University Medical Center.
METHODS
- Between 1995 and 2005, the total number of live births decreased by 39.2%, from 712 750 births in 1995 to 433429 births in 2005. The multiple birth rate steadily increased from 1.32% in 1995 to 2.19% in 2005, which was statistically significant (ptrend < 0.001). During the same period, the LBW rate increased by 1.26% points, from 3.02% to 4.28% (ptrend < 0.001). When the LBW rate was calculated for singleton and multiple births separately, statistically significant trends were also observed (ptrend < 0.001). The LBW rate for singleton births increased from 2.57% in 1995 to 3.25% in 2005. The LBW rate for multiple births was 14-16 times higher than that for singleton births and increased from 36.70% to 50.33% during the same period (Table 1).
- Table 2 shows changes in the AP-dis by plurality between 1995 and 2005. Among both singleton and multiple births, there was a statistically significant shift in the AP-dis to the ≥ 30-year age groups in 2005 (p < 0.001). Table 3 shows the AP-spe by plurality in 1995 and 2005. Among singleton births in 1995, the rates for the first and second babies of mothers 20 - 29 years of age, the third babies of mothers 25-29 years of age, and the second and third babies of mothers 30-34 years of age were near to or lower than 2.57% (the LBW rate among all singleton births in 1995), while the rates for the remainder of the age-parity groups were much higher than 2.57%. Among multiple births in 1995, the rates for the maternal age between 20 and 39 years were not as variable as the rates for the same maternal age groups among singleton births. Statistically significant increases in the AP-spe in 2005 were observed in 9 of 18 age-parity groups among singleton births and 8 of 17 age-parity groups among multiple births (p < 0.05).
- The calculation process to separate out the contribution of changes in the AP-dis and AP-spe to the total increment in the LBW rate is summarized in Table 4. Among singleton births, the absolute LBW rate increased by 0.64% points, from 2.54% points in 1995 to 3.18% points in 2005 (25.2% increment). The absolute percentage points of the increase in the LBW rate due to changes in the AP-dis were 0.32 (50.0% of the increase). Among multiple births, the absolute LBW rate increased by 0.62% points, from 0.48% points to 1.10% points during the same period (129.2% increment) and accounted for nearly one-half of the LBW rate increase among all live births. The age-parity score of multiple births for 2005 was 0.999, which means no contribution of changes in the AP-dis to changes in the LBW rate. All of the LBW rate increment among multiple births was attributed to the increase in the AP-spe.
- Consequently, a total of 0.32% points, which accounted for 25.4% of the overall increase of 1.26% points, were attributed to changes in the AP-dis, and occurred only among singleton births. The absolute percentage points of the increase in the LBW rate due to changes in the AP-spe were 0.32 (50.0% of the increase) among singleton births, 0.62 (100.0% of the increase) among multiple births, and a total of 0.94, which accounted for 74.6% of the overall increase of 1.26% points.
RESULTS
- In this study, we evaluated the effects of changes in the AP-dis and the AP-spe on the LBW trends in the ROK between 1995 and 2005 for singleton and multiple births separately. Our study revealed that nearly one-half of the total increase in the LBW rate during the time period occurred among singleton births and the other half occurred among multiple births.
- When the impact of the shifts in maternal age and parity on the increase in the LBW rate was evaluated by calculating the age-parity score, one-half of the increase in the LBW rate among singleton births was attributed to changes in the AP-dis, primarily the shift in maternal age to the ≥ 30 - year age groups. The remainder of the increase in the LBW rate among singleton births was attributed to changes in the AP-spe.
- Given recent trends in delayed marriage and childbearing in the ROK and the association of maternal age and parity with the LBW rate, the noticeable impact of the shifts in maternal age and parity on the increase in the LBW rate among singleton births was what we had expected. The impact of the shifts in maternal age and parity observed in our study was greater than that reported in the United States [11]. In a study conducted in the United States [11], among white, singleton, liveborn infants, 32.5% of the increased rate of very LBW (VLBW) and 7.4% of the increased rate of LBW between 1980 and 1990 were associated with changes in the AP-dis. Among black infants, 15.9% of the increased rate of VLBW and 38.2% of the increased rate of LBW were associated with changes in the AP-dis during the same period. The difference in the contribution of the shifts in maternal age and parity to the increase in the LBW rate between the current study and the study in the United States may be related with racial difference, and degree of a shift in age and parity distribution.
- Although the multiple birth rate increased by 0.87% points, from 1.32% in 1995 to 2.19% in 2005, nearly one-half of the total increment in the LBW rate during this time period occurred among multiple births. This was because the LBW rate for multiple births was very high (36.70% in 1995 and 50.33% in 2005).
- When the impact of the shifts in maternal age and parity on the increase in the LBW rate was evaluated by calculating the age-parity score, changes in the AP-dis did not contribute to the increase in the LBW rate among multiple births because even though there was a statistically significant shift in the AP-dis between 1995 and 2005, the AP-spe for the mothers 20 - 39 years of age, where the majority of multiple births was distributed, showed a minor variation. In contrast, the AP-spe for these age groups increased significantly in 2005. As a result, the total increment in the LBW rate among multiple births was attributed to changes in the AP-spe.
- The increase in the multiple birth rate was most likely associated with increased utilization of assisted reproduction techniques (ART) for infertile couples. The cause of infertility among these couples might be partly associated with advanced maternal and paternal ages. The Korean Society of Obstetrics and Gynecology reported in their annual report on ART that 15 619 treatment cycles were performed in 2000 and 19 149 treatment cycles were performed in 2005. In 2005, the proportion of multiple embryo transfers was 90.0%. The twin rate of in vitro fertilization and intracytoplasmic sperm injection was 34.9% and the triplet rate was 0.5% [20]. The twin and triplet rates are directly related to the number of transferred embryos [21]. It is desirable to regulate the number of transferred embryos that had shown a remarkable impact on reducing the multiple birth rate in Sweden [22]. In addition, advances in embryo selection techniques and other techniques relevant to ART are essential to improve the clinical pregnancy rate in single embryo transfers.
- The reasons for the increase in the AP-spe among singleton and multiple births could not be determined from the birth registry data. However, there have been several studies that suggest possible explanations for the increase in the AP-spe among singleton and multiple births. First, the distribution of the body mass index of young women in the ROK was shifted to two tails, overweight and underweight [23,24]. Epidemiologic studies have revealed that underweight women, as well as overweight and obese women, have an increased risk of preterm and LBW births [25-28]. Second, maternal occupation during pregnancy has been reported to be associated with pregnancy outcomes, including preterm and LBW births [29]. Increased economic activity in the service sector among young women [30] might have been associated with the LBW rate. Third, lifestyle factors, including maternal cigarette smoking, have been proposed to be associated with an increased risk of preterm and LBW births. Although there is limited evidence on trends in maternal cigarette smoking during pregnancy, increasing trends in cigarette smoking among young women were observed in the national survey data in the ROK [23,24]. Fourth, ambient air pollution has also been suggested as a contributor to the increase in the LBW rate in the ROK [16].
- Recent advances in medical technology and changes in obstetrical practices might be associated with a decrease in fetal deaths, which consequently lead to increased rates of LBW or preterm births. Furthermore, obstetrical practices, such as labor induction and cesarean delivery at preterm gestation, may be associated with increased rates of LBW or preterm births. However, the rate of cesarean section in the ROK decreased from 40.5% in 2001 to 37.1% in 2005 [31]. The impact of health care practices, including obstetric interventions, on the LBW rate needs to be explored in future studies.
- The limitations of this study include the possibility of inaccurate recording of birth weights in the birth certificates and subsequent misclassification of LBW. However, there is no basis for suspecting changes in the accuracy of birth weight recording over the study period. By using the data regarding the groups of registered births in each year from 1995 to 2005, we attempted to show the relative contribution of the two components, changes in the AP-dis and AP-spe, to the increase in the LBW rate.
- In conclusion, this study demonstrated that shifts in maternal age and parity among singleton births and increased multiple births were important contributors to the increment in the LBW rate between 1995 and 2005 in the ROK. This study also revealed that the increase in the AP-spe was an equally important contributor as the shifts in maternal age and parity to the increment in the LBW rate among singleton births and was a major contributor among multiple births. Further studies are warranted to define the causes of the AP-spe increase. In terms of policy implications of our study, considering the worldwide trends in delayed marriage and childbearing, increasing trends in the LBW rate is not likely to be reversed by medical interventions alone. To reduce the LBW rate, public health services and social interventions to facilitate pregnancy at a physiologically optimal age and quality control of ART are recommended.
DISCUSSION
ACKNOWLEDGEMENTS
-
The authors have no conflicts of interest with the material presented in this paper.
-
This article is available at http://jpmph.org/.
Notes
- 1. Annual report on live births and deaths statistics, 1970-2005. Korea National Statistical Office. cited 2010 Nov 1. Available from: http://kostat.go.kr/
- 2. World Health Organization (WHO). International statistical classification of diseases and related health problems, tenth revision. 1992. Geneva: WHO
- 3. Jacobsson B, Ladfors L, Milsom I. Advanced maternal age and adverse perinatal outcome. Obstet Gynecol 2004;104(4):727-733. 15458893ArticlePubMed
- 4. Morken NH, Källen K, Hagberg H, Jacobsson B. Preterm birth in Sweden 1973-2001: rate, subgroups, and effect of changing patterns in multiple births, maternal age, and smoking. Acta Obstet Gynecol Scand 2005;84(6):558-565. 15901267ArticlePubMed
- 5. Park JH, Lee JY, Park SW, Park SJ. Effect of delayed first childbearing on low birth weight and pre-term birth. J Korean Soc Matern Child Health 2004;8(1):7-15. (Korean)
- 6. Shin YS. Relationship of maternal demographic, obstetric and behavioral factors with birth weight. J Korean Soc Matern Child Health 2000;4(1):7-15. (Korean)Article
- 7. McCormick MC. Significance of low birthweight for infant mortality and morbidity. Birth Defects Orig Artic Ser 1988;24(1):3-10. 3179418
- 8. Ijzerman RG, Boomsma DI, Stehouwer CD. Intrauterine environmental and genetic influences on the association between birthweight and cardiovascular risk factors: studies in twins as a means of testing the fetal origins hypothesis. Paediatr Perinat Epidemiol 2005;19(Suppl 1):10-14. 15670116ArticlePubMedPMC
- 9. McNeill G, Tuya C, Smith WC. The role of genetic and environmental factors in the association between birthweight and blood pressure: evidence from meta-analysis of twin studies. Int J Epidemiol 2004;33(5):995-1001. 15375085ArticlePubMed
- 10. Osmond C, Barker DJ. Fetal, infant, and childhood growth are predictors of coronary heart disease, diabetes, and hypertension in adult men and women. Environ Health Perspect 2000;108(Suppl 3):545-553. 10852853Article
- 11. Yang Q, Greenland S, Flanders WD. Associations of maternal age- and parity- related factors with trends in low-birthweight rates: United States, 1980 through 2000. Am J Public Health 2006;96(5):856-861. 16571716ArticlePubMedPMC
- 12. Cogswell ME, Yip R. The influence of fetal and maternal factors on the distribution of birthweight. Semin Perinatol 1995;19(3):222-240. 7570074ArticlePubMed
- 13. Shennan AH, Bewley S. Why should preterm births be rising? BMJ 2006;332(7547):924-925. 16627490ArticlePubMedPMC
- 14. In: Behrman RE, Butler AS, editors. Preterm birth: causes, consequences, and prevention. 2007. Washington, DC: National Academies Press
- 15. Srám RJ, Binková B, Dejmek J, Bobak M. Ambient air pollution and pregnancy outcomes: a review of the literature. Environ Health Perspect 2005;113(4):375-382. 15811825ArticlePubMedPMC
- 16. Leem JH, Kaplan BM, Shim YK, Pohl HR, Gotway CA, Bullard SM, et al. Exposures to air pollutants during pregnancy and preterm delivery. Environ Health Perspect 2006;114(6):905-910. 16759993ArticlePubMedPMC
- 17. Park JH. Association between reduction in neonatal mortality rate and changes in sociodemographic factors in Baltimore city between 1960 and 1970 [dissertation]. 1979. Baltimore: Johns Hopkins University
- 18. Kim YA, Park JH. Impact of changes in maternal age and parity distribution on low birth weight incidence rate. Korean J Prev Med 1989;22(2):276-282. (Korean)
- 19. Fleiss JL. Statistical methods for rates and proportions. 1981. 2nd ed. New York: John Wiley & Sons Inc.; p. 244-255
- 20. Korean Society of Obstetrics and Gynecology. Current status of assisted reproductive technology in Korea, 2005. Korean J Obstet Gynecol 2008;51(12):1421-1447. (Korean)
- 21. Aston KI, Peterson CM, Carrell DT. Monozygotic twinning associated with assisted reproductive technologies: a review. Reproduction 2008;136(4):377-386. 18577552ArticlePubMed
- 22. Saldeen P, Sundström P. Would legislation imposing single embryo transfer be a feasible way to reduce the rate of multiple pregnancies after IVF treatment? Hum Reprod 2005;20(1):4-8. 15567878ArticlePubMed
- 23. Korea Centers for Disease Control and Prevention. The Second Korea National Health and Nutrition Examination Survey (KNHANES II), 2001. 2002. Seoul: Ministry of Health and Welfare; (Korean)
- 24. Korea Centers for Disease Control and Prevention. The Third Korea National Health and Nutrition Examination Survey (KNHANES III), 2005. 2006. Seoul: Ministry of Health and Welfare; (Korean)
- 25. Hauger MS, Gibbons L, Vik T, Belizán JM. Pregnancy weight status and the risk of adverse pregnancy outcome. Acta Obstet Gynecol Scand 2008;87(9):953-959. 18720038ArticlePubMed
- 26. Bhattacharya S, Campbell DM, Liston WA, Bhattacharya S. Effect of Body Mass Index on pregnancy outcomes in nulliparous women delivering singleton babies. BMC Public Health 2007;7: 168. 17650297ArticlePubMedPMC
- 27. Smith GC, Shah I, Pell JP, Crossley JA, Dobbie R. Maternal obesity in early pregnancy and risk of spontaneous and elective preterm deliveries: a retrospective cohort study. Am J Public Health 2007;97(1):157-162. 17138924ArticlePubMedPMC
- 28. Sebire NJ, Jolly M, Harris J, Regan L, Robinson S. Is maternal underweight really a risk factor for adverse pregnancy outcome? A population-based study in London. BJOG 2001;108(1):61-66. 11213006ArticlePubMed
- 29. Meyer JD, Nichols GH, Warren N, Reisine S. Maternal occupation and risk for low birth weight delivery: assessment using state birth registry data. J Occup Environ Med 2008;50(3):306-315. 18332780ArticlePubMed
- 30. Report on wage structure survey, 1995-2005. Ministry of Employment and Labor. cited 2010 Nov 1. Available from: http://laborstat.molab.go.kr/
- 31. National Health Insurance Corporation. National health insurance statistical yearbook, 2005. 2006. Seoul: National Health Insurance Co.; (Korean)
REFERENCES
Table 1.All live births, singleton and multiple births, singleton and multiple birth rates, and low birth weight (LBW) rate from 1995 to 2005 in the Republic of Korea
|
Year |
|||||||||||
|---|---|---|---|---|---|---|---|---|---|---|---|
| 1995 | 1996 | 1997 | 1998 | 1999 | 2000 | 2001 | 2002 | 2003 | 2004 | 2005 | |
| All live births | 712 750 | 657 388 | 644 103 | 639 011 | 636 389 | 634 438 | 554 581 | 489 999 | 487 849 | 471 225 | 433 429 |
| Singleton births | 703 374 | 648 602 | 635 439 | 629 376 | 626 440 | 623 741 | 544 596 | 480 322 | 478 015 | 461 305 | 423 943 |
| Multiple births | 9376 | 8786 | 8664 | 9635 | 9949 | 10 697 | 9985 | 9677 | 9834 | 9920 | 9486 |
| Singleton birth rate (%)* | 98.68 | 98.66 | 98.65 | 98.49 | 98.44 | 98.31 | 98.20 | 98.03 | 97.98 | 97.89 | 97.81 |
| Multiple birth rate (%)* | 1.32 | 1.34 | 1.35 | 1.51 | 1.56 | 1.69 | 1.80 | 1.97 | 2.02 | 2.11 | 2.19 |
| LBW rate (%) | |||||||||||
| All live births* | 3.02 | 3.07 | 3.22 | 3.46 | 3.55 | 3.80 | 3.93 | 3.96 | 4.06 | 4.13 | 4.28 |
| Singleton births* | 2.57 | 2.58 | 2.69 | 2.80 | 2.84 | 3.02 | 3.08 | 3.03 | 3.13 | 3.15 | 3.25 |
| Multiple births* | 36.70 | 38.91 | 42.20 | 46.95 | 47.72 | 49.19 | 50.28 | 50.19 | 49.32 | 49.86 | 50.33 |
Table 2.Distribution of maternal age and parity of births in 1995 and 2005 by plurality in the Republic of Korea n (%)
| Maternal age (y) |
1995 |
2005 |
p-value1 | ||||
|---|---|---|---|---|---|---|---|
|
Birth order |
Birth order |
||||||
| First | Second | ≥ Third | First | Second | ≥ Third | ||
| Singleton births | < 0.001 | ||||||
| - 19 | 6134 (0.87) | 692 (0.10) | 18 (< 0.01) | 1966 (0.46) | 160 (0.04) | 6 (< 0.01) | |
| 20 - 24 | 102 049 (14.51) | 31 465 (4.47) | 1685 (0.24) | 24 564 (5.79) | 6522 (1.54) | 567 (0.13) | |
| 25 - 29 | 191 487 (27.22) | 173 663 (24.69) | 16 682 (2.37) | 112 293 (26.49) | 53 164 (12.54) | 6037 (1.42) | |
| 30 - 34 | 33 887 (4.82) | 84 000 (11.94) | 28 584 (4.06) | 68 731 (16.21) | 85 121 (20.08) | 19 736 (4.66) | |
| 35 - 39 | 7253 (1.03) | 11 547 (1.64) | 10 672 (1.52) | 11 466 (2.70) | 16 559 (3.91) | 11 540 (2.72) | |
| 40 - | 1139 (0.16) | 981 (0.14) | 1436 (0.20) | 1833 (0.43) | 1558 (0.37) | 2120 (0.50) | |
| Multiple births | < 0.001 | ||||||
| - 19 | 23 (0.25) | 20 (0.21) | 1 (0.01) | 5 (0.05) | 5 (0.05) | 0 (-) | |
| 20 - 24 | 471 (5.02) | 803 (8.56) | 149 (1.59) | 171 (1.80) | 206 (2.17) | 43 (0.45) | |
| 25 - 29 | 1221 (13.02) | 2804 (29.91) | 887 (9.46) | 1289 (13.59) | 1609 (16.96) | 370 (3.90) | |
| 30 - 34 | 447 (4.77) | 1191 (12.70) | 701 (7.48) | 1490 (15.71) | 2095 (22.09) | 835 (8.80) | |
| 35 - 39 | 114 (1.22) | 267 (2.85) | 217 (2.31) | 374 (3.94) | 539 (5.68) | 348 (3.67) | |
| 40 - | 12 (0.13) | 17 (0.18) | 31 (0.33) | 31 (0.33) | 44 (0.46) | 32 (0.34) | |
Table 3.Maternal age- and parity-specific low birth weight rate (%) in 1995 and 2005 by plurality in the Republic of Korea
| Maternal age (y) |
1995 |
2005 |
||||
|---|---|---|---|---|---|---|
|
Birth order |
Birth order |
|||||
| First | Second | ≥ Third | First | Second | ≥ Third | |
| Singleton births | ||||||
| -19 | 3.77 | 4.34 | 16.67 | 5.80* | 3.75 | 16.67 |
| 20 - 24 | 2.61 | 2.42 | 2.97 | 3.47* | 2.74 | 5.11* |
| 25 - 29 | 2.60 | 2.00 | 2.13 | 3.08* | 2.34* | 3.58* |
| 30 - 34 | 3.81 | 2.59 | 2.38 | 3.77 | 2.77* | 2.87* |
| 35 - 39 | 5.46 | 4.02 | 3.35 | 5.82 | 4.08 | 4.21* |
| 40 - | 5.88 | 6.32 | 4.81 | 6.82 | 5.58 | 6.32 |
| Multiple births | ||||||
| -19 | 56.52 | 65.00 | - | 80.00 | 60.00 | - |
| 20 - 24 | 45.86 | 38.85 | 35.57 | 48.54 | 51.94* | 53.49* |
| 25 - 29 | 41.61 | 32.95 | 38.11 | 49.65* | 54.88* | 38.92 |
| 30 - 34 | 36.91 | 33.17 | 32.67 | 49.46* | 52.79* | 43.83* |
| 35 - 39 | 42.98 | 40.07 | 41.01 | 45.19 | 53.62* | 45.98 |
| 40 - | 41.67 | 58.82 | 48.39 | 54.84 | 63.64 | 46.88 |
Table 4.Calculation process of changes in the low birth weight (LBW) rate due to changes in the distribution of age and parity (AP-dis) and changes in the age- and parity-specific LBW rate (AP-spe) among singleton and multiple births between 1995 and 2005 in the Republic of Korea
Figure & Data
References
Citations
Citations to this article as recorded by 
- Incidence, Long-Term Visual Outcomes, and Mortality in Retinopathy of Prematurity in Korea: A Nationwide Population-Based Study
Kun-Hoo Na, Kyoung Hoon Kim, Tae Uk Kang, Hoo Jae Hann, Hyeong Sik Ahn, Hyun Jung Kim
Investigative Opthalmology & Visual Science.2020; 61(10): 14. CrossRef - Factors associated with low birth weight at term: a population-based linkage study of the 100 million Brazilian cohort
Ila R. Falcão, Rita de Cássia Ribeiro-Silva, Marcia F. de Almeida, Rosemeire L. Fiaccone, Aline dos S. Rocha, Naiá Ortelan, Natanael J. Silva, Enny S. Paixao, Maria Yury Ichihara, Laura C. Rodrigues, Mauricio L. Barreto
BMC Pregnancy and Childbirth.2020;[Epub] CrossRef - Modeling the Effect of Mother's Characteristics on the Weight of a Newborn
Oluwafemi Samson Balogun, Donald Douglas Atsa'am, Toluwalase Janet Akingbade, Emmanuel Awuni Kolog, Richard O. Agjei, Samuel Nii Odoi Devine
International Journal of Childbirth.2020; 10(4): 206. CrossRef - Impact of Changes in Maternal Age and Parity Distribution on the Increasing Trends in the Low Birth Weight and Very Low Birth Weight Rates in South Korea, 2005-2015
Yujin Oh, Jisuk Bae
Journal of Preventive Medicine and Public Health.2019; 52(2): 123. CrossRef - Factors Associated With Failure to Thrive Among Children Aged 3 to 72 Months in Jahrom, Southern Iran
Vahid Rahmanian, Yaser Sarikhani, Keramatollah Rahmanian, Elham Mansoorian, Mahdieh Zare
Shiraz E-Medical Journal.2018;[Epub] CrossRef - Adverse Child’s Birth Outcomes and Maternal Age at Birth: 1997-98, 2014-15 Birth Certificate Data of Korea
Sang Hwa Park, Jong Seok Kim, Dar Oh Lim
Journal of Health Informatics and Statistics.2017; 42(3): 294. CrossRef - Experiences of Prenatal Genetic Screening and Diagnostic Testing Among Pregnant Korean Women of Advanced Maternal Age
Myunghee Jun, Vipavee Thongpriwan, Kyung Sook Choi
Journal of Transcultural Nursing.2017; 28(6): 550. CrossRef - Reproductive Health of Women in Rural Areas of East Azerbaijan – Iran, before and after Implementation of rural Family Physician Program: an Ecologic Study
Mahasti Alizadeh, Hossein Jabbari Birami, Siavash Moradi
Journal of Caring Sciences.2015; 4(4): 321. CrossRef - Risk Assessment of Adverse Birth Outcomes in Relation to Maternal Age
Yi-Hao Weng, Chun-Yuh Yang, Ya-Wen Chiu, Lynette K. Rogers
PLoS ONE.2014; 9(12): e114843. CrossRef - The association between maternal nonylphenol exposure and parity on neonatal birth weight: A cohort study in Taiwan
Chia-Huang Chang, Mei-Lien Chen, Kai-Wei Liao, Yen-An Tsai, I-Fang Mao, Tzu-Hao Wang, Shiaw-Min Hwang, Yu-Jen Chang, Ming-Song Tsai
Chemosphere.2013; 93(6): 1145. CrossRef
 PubReader
 ePub Link
 Cite
Cite
