Articles
- Page Path
- HOME > J Prev Med Public Health > Volume 47(6); 2014 > Article
-
Original Article
Incidence of and Factors for Self-reported Fragility Fractures Among Middle-aged and Elderly Women in Rural Korea: An 11-Year Follow-up Study - Soon-Ki Ahn1, Sin Kam2, Byung-Yeol Chun2
-
Journal of Preventive Medicine and Public Health 2014;47(6):289-297.
DOI: https://doi.org/10.3961/jpmph.14.020
Published online: October 2, 2014
1Health Consultation Center for Daejeon Regional Headquarters, National Health Insurance Service, Daejeon, Korea
2Department of Preventive Medicine, Kyungpook National University School of Medicine, Daegu, Korea
- Corresponding author: Sin Kam, MD, PhD 680 Gukchaebosang-ro, Jung-gu, Daegu 700-842, Korea Tel: +82-53-420-4865, Fax: +82-53-425-2447 E-mail: kamshin@knu.ac.kr
Copyright © 2014 The Korean Society for Preventive Medicine
This is an Open Access article distributed under the terms of the Creative Commons Attribution Non-Commercial License (http://creativecommons.org/licenses/by-nc/3.0/) which permits unrestricted noncommercial use, distribution, and reproduction in any medium, provided the original work is properly cited.
ABSTRACT
-
Objectives:
- This community-based cohort study was performed to investigate the incidence of and factors related to self-reported fragility fractures among middle-aged and elderly women living in rural Korea.
-
Methods:
- The osteoporosis cohort recruited 430 women 40 to 69 years old in 1999, and 396 of these women were followed over 11 years. In 1999, questionnaires from all participants assessed general characteristics, medical history, lifestyle, menstrual and reproductive characteristics, and bone mineral density. In 2010, self-reported fractures and the date, site, and cause of these fractures were recorded. Cox proportional hazards models were used to calculate hazard ratios (HRs).
-
Results:
- Seventy-six participants among 3949.7 person-years experienced fragility fractures during the 11-year follow-up. The incidence of fragility fractures was 1924.2 per 100 000 person-years (95% confidence interval [CI], 1491.6 to 2356.8). In the multivariate model, low body mass index (HR, 2.66; 95% CI, 1.13 to 6.24), a parental history of osteoporosis (HR, 2.03; 95% CI, 1.18 to 3.49), and postmenopausal status (HR, 3.50; 95% CI, 1.05 to 11.67) were significantly related to fragility fracture.
-
Conclusions:
- Fracture prevention programs are needed among postmenopausal, rural, Korean women with a low body mass index and parental history of osteoporosis Korea.
- A fragility fracture is defined as a fracture occurring after a fall, such as from a standing height. Patients who have suffered at least one fragility fracture should be targeted for further investigation and possible treatment of osteoporosis [1].
- According to the World Health Organization (WHO), osteoporosis is a systemic skeletal disease characterized by low bone mineral density (BMD) and the micro-architectural deterioration of bone tissue with a consequential increase in bone fragility [2]. Osteoporosis acts silently before the fracture develops [2]. According to a previous report, there are more than 200 million people with osteoporosis in the world; one in three women and one in eight men over 50 years old have osteoporosis [3].
- The WHO expects the number of osteoporotic fractures to increase more than three-fold and the burden from these fractures to more than double over the next 50 years because of the aging population, particularly in Asia and Latin America [4]. As the aging population increases rapidly [5], the susceptibility of fracture among those with low BMD is increasing to the level of an osteoporosis epidemic in the Republic of Korea (hereafter Korea) [6].
- A number of previous studies have established the risk factors of osteoporotic fracture. The established risk factors that are thought to predict fracture within five years are age, self-reported health status, weight, height, race/ethnicity, self-reported physical activity, the history of fractures after 54 years old, parental fractures, current smoking, current corticosteroid use, and current treatment for diabetes [7-9].
- In America, direct expenditures on osteoporotic fractures were estimated at 20 billion US dollars in 1988 and 35 billion US dollars in 1998 [10,11]. In Korea, the economic burden of osteoporotic vertebral fracture among elderly women was estimated to be 66.2 billion Korean won according to the National Health Insurance claims records from 2002 to 2004 [12]. The total national expenditure on the treatment of osteoporotic hip, vertebral, and wrist fractures among those older than 50 years was estimated to be total 1 trillion and 49.5 billion Korean won [13].
- To date, few prospective cohort studies on osteoporotic fractures in Korea have been performed. In Australia, one long-term prospective cohort study, the Dubbo Osteoporosis Epidemiology Study, was performed [14].
- Thus, we investigated the incidence of and factors related to self-reported fragility fractures through a community-based cohort study on middle-aged and elderly women living in rural Korea.
INTRODUCTION
- Study Participants
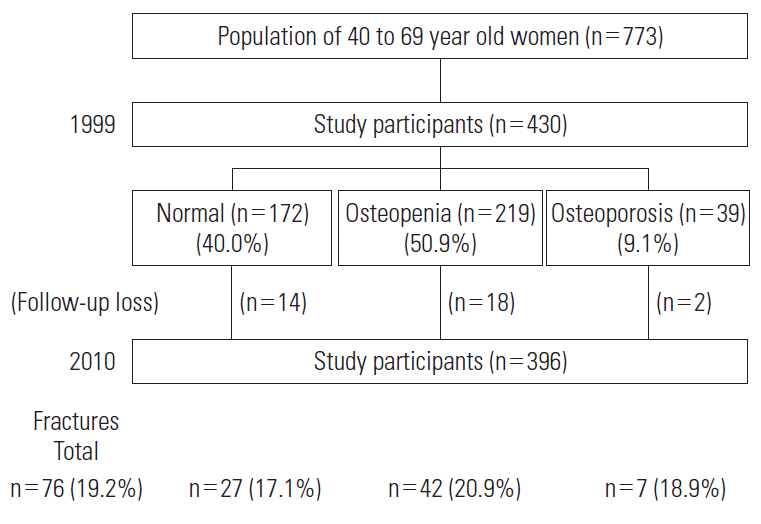
- Goryeong county is a rural area located near Daegu city in the southeast region of Korea. According to the statistical yearbook of Goryeong 2000, there were approximately 38 000 people living in Goryeong county. In 1999, 773 women aged between 40 to 69 years old were living within eight community health posts area. We conducted this community-based cohort survey in Goryeong county from April to June 1999.
- A cluster sampling method was applied to select voluntary participants for our study population from eight community health posts. At the time of the initial examination, a total of 430 women aged between 40 to 69 years were recruited.
- Throughout an 11-year follow up after the baseline survey, 34 participants died, moved out of the area, or chose not to participate in the follow-up surveys; 396 participants were followed over the 11 years (the follow-up rate was 92.1%). All participants provided informed consent. At baseline, participants were categorized according to the WHO criteria as having osteoporosis (9.1%), osteopenia (50.9%), or neither (40.0%) (Figure 1).
- Measurements
- All participants were interviewed by community health practitioners who administered a structured questionnaire for data collection. Baseline characteristics in 1999 included general characteristics (age, marital status, occupation status, and education status), anthropometrics (height and body weight), medical history (joint pain, previous fracture history, comorbidities, medication history, and parental history of osteoporosis), lifestyle (preferences for salty foods, dietary calcium intake, coffee intake, alcohol intake, smoking, and exercise), and menstrual and reproductive characteristics (menarche age, menopausal age, menopausal status, number of children, period of total breast-feeding, and duration post-menopause).
- Body weight was measured while participants wore light clothing, and height was measured while standing. Body mass index (BMI, kg/m2) was calculated as weight (kg) divided by height squared (m2). BMI was used to classify participants as obese (≥25.0 kg/m2), overweight (23.0-24.9 kg/m2), normal (18.5-22.9 kg/m2), or underweight (<18.5 kg/m2), according to the guidelines for Asians [15].
- Baseline BMD was measured in the T12-L2 vertebral body using quantitative computed tomography bone densitometry by the radiologist in the local hospital until June 1999, and the average value was used as the participant’s BMD. The WHO criteria were used to interpret the BMD results to diagnose osteoporosis. Those with a BMD value within one standard deviation (SD) of the young adult mean (T-score ≥-1.0) were defined as normal [2]. Those with a BMD value more than one SD below the young adult mean but less than 2.5 SD below this value (T-score between -2.5 to -1.0) were defined as having osteopenia, and those with a BMD value of 2.5 SD or more below the young adult mean (T-score ≤-2.5) were defined as having osteoporosis [2].
- In 2010, community health practitioners administered a questionnaire and collected self-reported data on fracture events including the calendar year and month of the fracture, cause, site, date of death (if applicable), and migration.
- Seventy-six participants experienced fragility fractures after excluding six cases that were caused by a car accident. Among all of the participants with fractures, 11 experienced subsequent fractures. In our data analysis, however, we considered only the initial fracture as the event.
- Ascertainment of Fragility Fracture
- The clinical definition of a fragility fracture was defined as a fracture occurring spontaneously or following a minor trauma such as a fall from a standing height, from a seated position, from less than a meter from the ground, after having missed one to three steps in a staircase, after moving outside of the typical range of motion, or after coughing [16].
- Only self-reported data were used to ascertain events; the authors neither reviewed hospital records nor confirmed a radiological fracture. Fragility fractures may have occurred independently of having a low BMD. One team of researchers suggested that fractures in older people should be termed “fall-induced high-impact injuries” instead of the commonly used and rather misleading “osteoporotic fracture” considering the parallel priority of falling and osteoporosis in the fracture mechanism [17].
- Statistical Analysis
- The total follow-up period was calculated individually after a fracture event, death, or loss to follow-up. We categorized all continuous variables. Moreover, the 11-year cumulative fracture risk, follow-up period in person-years (PY), and incidence density by each risk factor are presented. The incidence density of fragility fractures (per 100 000 PY) was calculated as the number of participants who developed fractures during the follow-up period divided by the sum of individual follow-up periods of those at risk. Differences between groups for independent variables were analyzed using the chi-squared test for dichotomous variables and t-test or analysis of variance for continuous variables. The Cox proportional hazards regression models were used to determine the hazard ratio (HR) and 95% confidence interval (CI) for risk factors associated with fracture incidence [18]. A normal approximation to the Poisson distribution was used to calculate the 95% CI for the incidence density. The assumption in the Poisson distribution for the proportional HRs of the levels of each risk factor was examined graphically by plotting the log-minus-log-survival graph to determine whether they met each other. We found no evidence that the proportional hazards assumption was violated in the univariate analysis for any significant risk factors. In all analyses, statistical significance was defined as a p<0.05 (two-tailed test), and the R statistical software version 3.1.1 (R Foundation for Statistical Computing, Vienna, Austria) was used.
METHODS
- Baseline general characteristics of the 396 study participants are presented in Table 1. Their average age was 56.7 years (range, 40 to 69 years). Mean ages at menarche and menopause were 17.2 and 48.6 years, respectively. The participants had an average of 4.4 children and breast-fed for an average of 8.1 years over their lifetimes. Participants’ average height, weight, and BMI were 154.4 cm, 55.6 kg, and 23.3 kg/m2, respectively. The largest industry that participants worked in was agriculture (91.3%). Elementary school graduates made up 52.6% of the participants. In addition, 85% were postmenopausal and 9.3% had osteoporosis at baseline.
- Sites, causes of fractures, and site-specific incidence density are shown in Table 2. A total of 3949.9 PY were followed, and 76 participants experienced fragility fractures over the course of 11 years. The incidence density of all fragility fractures was 1924.2 per 100 000 PY (95% CI, 1491.6 to 2356.8). Site-specific incidence density were estimated as 860.8 per 100 000 PY (95% CI, 571.5 to 1150.2) for fractures in wrists, 354.5 per 100 000 PY (95% CI, 168.8 to 540.1) for fractures in ribs, 177.2 per 100 000 PY (95% CI, 49.5 to 308.5) for fractures in the vertebrae, and 126.6 per 100 000 PY (95% CI, 15.6 to 237.6) for fractures in the hips and ankles. Fractures sites were, in order of decreasing frequency, in the wrist (44.7%), rib (18.4%), vertebra (9.2%), hip (6.6%), and ankle (6.6%); 74.9% were axial bone fractures, and 22.3% were in a lower extremity. In addition, the causes of fractures were, in order of decreasing frequency, due to a slip (69.7%), fall (11.8%), contusion (9.2%), and downward pressure (3.9%).
- The 11-year cumulative fracture risk, incidence density, and crude HRs of fracture by baseline general characteristics and medical history are shown in Table 3. The 11-year cumulative fracture risk was 19.2%. The HRs among those aged 50 to 59 and 60 to 69 compared to those aged 40 to 49 (reference) were 1.71 (95% CI, 0.78 to 3.75) and 2.53 (95% CI, 1.18 to 5.41), respectively. Having a parental history of osteoporosis was a significant factor in the univariate analysis (HR, 1.88; 95% CI, 1.11 to 3.20).
- The 11-year cumulative fracture risk, incidence density, and crude HRs of fracture by baseline lifestyle, menstrual, and reproductive characteristics as well as baseline BMD were shown in Table 4. Dietary calcium intake (HR, 1.61; 95% CI 1.02 to 2.54) and menopausal status (HR, 4.65; 95% CI, 1.47 to 14.84) were significant factors. Moreover, the duration of total breast-feeding (HR, 1.69; 95% CI, 1.08 to 2.66) was a significant factor in the univariate analysis.
- According to the WHO criteria for osteoporosis, the HRs of fracture among those with osteopenia and osteoporosis compared with those who were normal (reference) were 1.25 (95% CI, 0.77 to 2.04) and 1.11 (95% CI, 0.48 to 2.55), respectively, and demonstrated no statistical significance.
- To further understand the influence of age and BMI, the respective three and four categorizes of these variables were dichotomized. The significant variables from the univariate analysis were entered into the final multivariate Cox proportional hazards model for fragility fractures. Although not significant, the variables of interest including BMI, the previous fracture history, and baseline BMD were entered into the final model (Table 5).
- In the final model, having a low BMI (HR, 2.66; 95% CI, 1.13 to 6.24), parental history of osteoporosis (HR, 2.03; 95% CI, 1.18 to 3.49), and postmenopausal status (HR, 3.50; 95% CI, 1.05 to 11.67) were significant, independent factors after adjustment for all covariates (age, BMI, previous fracture history, parental history of osteoporosis, dietary calcium intake, menopausal status, duration of total breast-feeding, and BMD.
RESULTS
- In this study, we demonstrated that having a low BMI, parental history of osteoporosis, and postmenopausal status were significant risk factors of fragility fractures. Additionally, the incidence density of self-reported fragility fractures was estimated as 1924.2 per 100 000 PY (95% CI, 1491.6 to 2356.8).
- Twelve prospective population-based cohort studies showed that the fracture incidence rate was approximately 2000 per 100 000 PY [4]. For example, in the Dubbo Osteoporosis Epidemiology Study from Australia between 1989 and 2005, 2245 women aged 60 years and older were followed, and the incidence rate of initial fractures was 3157.6 per 100 000 PY (95% CI, 2951.9 to 3363.3) [19]. These differences in the incidence rate can be attributed to many factors, such as the case definition, data collection method, and study population characteristics.
- Our data indicated that the prevalence of osteoporosis in women aged 40 to 69 at baseline was approximately 9.1% (95% CI, 6.4 to 11.8), which is consistent with the results of other studies in Korea in which the prevalence of osteoporosis in adult women ranged from 3.0% to 11.8% in Taean, Ulsan, and Jeongeup [13,20].
- The present study showed that the incidence rates were approximately 860.8 per 100 000 PY (95% CI, 571.5 to 1150.2) in wrists, 354.5 per 100 000 PY (95% CI, 168.8 to 540.1) in the ribs, 177.2 per 100 000 PY (95% CI, 49.5 to 308.5) in the vertebrae, and 126.6 per 100 000 PY (95% CI, 15.6 to 237.6) in the hips and ankles.
- Thus, the fracture sites were, in order of decreasing frequency, the wrist, the rib, the vertebra, the hip joint, and the ankle. According to the study by Shin et al. [21], the incidence rate per 100 000 was 565 in the distal radius, 236 in the vertebra, and 247 in the hip joint in women aged 65 and older. Although the fracture incidence rate by site was different, the pattern of the order by decreasing frequency by site was similar to that of Shin et al.’s study from Gwangju , Korea in 1999 [21]. One possible explanation for this difference in site-specific incidence rates for each fracture site between studies is that our study group was younger than theirs was. In addition, we observed that the incidence of wrist fractures among postmenopausal women in our study was higher than that of hip fractures in Kato’s study (71.6 and 334.7 per 100 000 PY, respectively) [22].
- In this study, low BMI (<18.5 kg/m2) was a significant risk factor. This finding is consistent with that from a European study that reported low BMI (below 19 kg/m2) to be associated with an increased risk of hip fracture; accelerated weight loss is also considered an important determinant of hip fracture risk [23,24].
- There was a significant association between parental history of osteoporosis and fracture occurrence in this study. According to a 15-year follow-up study in England and Wales, parental history of osteoporosis was significantly and independently related with osteoporotic fracture in women [25,26].
- Our study indicated that menopausal status significantly predicted the incidence of fracture. Decline in estrogen production at menopause is well known to strongly influence the development of osteoporosis. During the first years following menopause, bone loss starts in the trabecular, and then in the cortical compartment before slowing down [2,11]. It has been suggested that BMD decreases significantly by six years after menopause, the periosteal diameter increases significantly by six years, and the medullar diameter increases by eight years; however, the strength index was not found to decrease significantly until 14 years after menopause [27]. Women with a prevalent vertebral fracture have a substantially increased absolute risk of an incident fracture, especially if they were diagnosed with osteoporosis by a BMD scan [28]. Practically, the diagnosis of osteoporosis and guidelines for medication depends on the T-score.
- While BMD is the single best predictor of fractures in peri-menopausal women [29], we found no significant association of BMD with fragility fracture in this study. Fractures have a complex web of causes, including low bone density, falls, and environmental influences. Thus, we should consider several factors including loading and strength to understand fracture risk [30,31]. Five- and 10-year fracture risk assessment tools have been developed in consideration with clinical risk factors, but without the use of BMD scans [32].
- Our data showed significant HRs (2.53) among those aged between 60 to 69 years old when compared to those aged between 40 to 49 years old in the univariate analysis; however, this HR (1.26) completely attenuated after adjusting for covariates in the multivariate analysis. Several recent studies have reported that the incidence of hip fractures exponentially increases after age 70, but that of forearm fractures linearly increases between the ages of 40 and 65 and then stabilizes [4]. This finding might be due to changes in the patterns of falling with advancing age. For example, in this study, the highest incidence of wrist fractures was found among the younger population.
- Dietary calcium intake was not a significant factor in this study. The relationship between calcium intake and fracture rate is controversial. Results from a recent meta-analysis showed that each additional gram of calcium in the diet caused a 25% to 70% reduction in hip fracture risk [33]. In addition, calcium intake of 300 mg/day (the equivalent of one glass of milk) was significantly related to a decrease in fracture risk [33].
- Breast-feeding over a long period throughout one’s lifetime was not a significant risk factor for fracture in the present study. Multiparity was also not a significant risk factor in this study. This finding is in contrast to that of a study on Chinese women where increasing parities were significantly detrimental to BMD in the spine and hip [34]. One possible explanation for this difference is that our study participants lived through the Korean War and the post-war economic development, so they were likely to be limited in their ability to approach peak BMD because they lacked access to sufficient nutrition [35].
- There were some limitations in the present study. First, although the accuracy of self-reported fractures has been shown to be reasonably good [36,37], the potential for misclassification and recall bias may have influenced our findings. We also did not review the medical records and radiological results to confirm self-reported data. In particular, if the self-reported incidences of non-spinal fractures were inaccurate, then the incidence of fragility fractures may have been underestimated. Second, our study participants lived in a rural region of Korea; therefore, our results may not apply to the general population of women in Korea. Third, loss to follow-up is a potential limitation, but our follow-up rate was relatively high (92.1%). Fourth, the baseline BMD measurement of the lumbar vertebrae may not be related to peripheral fractures, especially for those occurring in the wrist. Last, we were not able to review the BMD level around the time of each fracture.
- In spite of these limitations, the major strength of our study is that it was a community-based cohort study with an 11-year follow-up period. Moreover, we revealed the incidence density and high-risk group for fragility fractures among rural women in Korea.
- In conclusion, the incidence density of self-reported fragility fractures among rural, middle-aged, and elderly women in Korea was 1924.2 per 100 000 PY. We suggest that the development of a fracture prevention program is essential for the health of postmenopausal, rural women with low BMI and a parental history of osteoporosis.
DISCUSSION

| Site |
Cause |
Incidence density1 (95% CI) | |||||
|---|---|---|---|---|---|---|---|
| Slip | Fall | Contusion | Downward pressure | Unknown | Total | ||
| Wrist | 30 | 3 | 0 | 0 | 1 | 34 (44.7) | 860.8 (571.5,1150.2) |
| Rib | 8 | 1 | 3 | 1 | 1 | 14 (18.4) | 354.5 (168.8, 540.1) |
| Vertebra | 3 | 3 | 0 | 1 | 0 | 7 (9.2) | 177.2 (45.9, 308.5) |
| Hip | 4 | 0 | 1 | 0 | 0 | 5 (6.6) | 126.6 (15.6, 237.6) |
| Ankle | 3 | 2 | 0 | 0 | 0 | 5 (6.6) | 126.6 (15.6, 237.6) |
| Other | 5 | 0 | 3 | 1 | 2 | 11 (13.5) | - |
| Leg | 2 | 0 | 1 | 0 | 0 | 3 (3.9) | - |
| Toe | 1 | 0 | 1 | 0 | 0 | 2 (2.6) | - |
| Clavicle | 0 | 0 | 0 | 1 | 1 | 2 (2.6) | - |
| Foot | 1 | 0 | 0 | 0 | 0 | 1 (1.3) | - |
| Knee | 1 | 0 | 0 | 0 | 0 | 1 (1.3) | - |
| Unknown | 0 | 0 | 1 | 0 | 1 | 2 (2.6) | - |
| Total | 53 (69.7) | 9 (11.8) | 7 (9.2) | 3 (3.9) | 4 (5.8) | 76 (100.0) | 1924.2 (1491.6, 2356.8) |
| Variable | n | Person-years | Fractures, n (%) | Incidence density1 (95% CI) | Crude HR |
|---|---|---|---|---|---|
| General characteristics | |||||
| Age (y) | |||||
| 40-49 | 74 | 773.0 | 8 (10.8) | 1034.9 (317.8,1752.1) | 1.00 |
| 50-59 | 162 | 1638.5 | 29 (17.9) | 1769.9 (1125.7, 2414.1) | 1.71 (0.78, 3.75) |
| 60-69 | 160 | 1538.2 | 39 (24.4) | 2535.4 (1739.7, 3331.2) | 2.53 (1.18, 5.41) |
| BMI (kg/m2) | |||||
| <18.5 | 18 | 151.4 | 6 (33.3) | 3963.0 (791.9, 7134.1) | 2.41 (0.96, 6.04) |
| 18.5-22.9 | 167 | 1695.9 | 30 (18.0) | 1769.0 (1136.0, 2402.0) | 1.02 (0.58,1.82) |
| 23.0-24.9 | 93 | 930.8 | 20 (21.5) | 2148.7 (1207.0, 3090.4) | 1.25 (0.67, 2.33) |
| ≥25.0 | 112 | 1106.1 | 19 (17.0) | 1.00 | |
| Spouse | |||||
| Yes | 319 | 3218.9 | 58 (18.2) | 1801.9 (1338.1, 2265.6) | 1.00 |
| No | 71 | 673.2 | 16 (22.5) | 2376.7 (1212.1,3541.3) | 1.36 (0.78, 2.37) |
| Occupation | |||||
| Other | 33 | 317.0 | 4 (12.1) | 1261.8 (25.2, 2498.4) | 1.00 |
| Agriculture | 346 | 3455.2 | 69 (19.9) | 1997.0 (1525.8, 2468.2) | 1.56 (0.57, 4.26) |
| Education level | |||||
| None | 154 | 1500.0 | 36 (23.4) | 2400.0 (1616.0, 3184.0) | 1.00 |
| Elementary school | 205 | 2072.9 | 36 (17.6) | 1736.7 (1169.4, 2304.0) | 0.71 (0.45,1.13) |
| Middle school or higher | 31 | 319.0 | 4 (12.9) | 1253.9 (25.1, 2482.8) | 0.51 (0.18,1.44) |
| Medical history | |||||
| Joint pain | |||||
| No | 86 | 857.7 | 14 (16.3) | 1598.5 (761.2, 2435.9) | 1.00 |
| Yes | 307 | 3060.9 | 60 (19.5) | 1971.9 (1472.9, 2470.8) | 1.01 (0.58,1.76) |
| Comorbidities | |||||
| 0 | 251 | 2542.0 | 45 (17.9) | 1770.3 (1253.0, 2287.5) | 1.00 |
| 1 | 130 | 1275.3 | 26 (20.0) | 2038.7 (1255.1, 2822.4) | 1.16 (0.72,1.88) |
| 2 or more | 14 | 121.4 | 5 (35.7) | 4118.6 (508.5, 7728.7) | 2.45 (0.97, 6.17) |
| Previous fracture history | |||||
| No | 375 | 3771.7 | 72 (19.2) | 1909 (1468.0, 2349.9) | 1.00 |
| Yes | 21 | 178.0 | 4 (19.0) | 2247.2 (44.9, 4449.4) | 1.24 (0.45, 3.39) |
| Oral contraceptive use | |||||
| No | 348 | 3470.8 | 64 (18.4) | 1844.0 (1392.2, 2295.7) | 1.00 |
| Yes | 41 | 402.7 | 11 (26.8) | 2731.6 (1117.3, 4345.8) | 1.49 (0.79, 2.83) |
| Parental history of osteoporosis | |||||
| No | 325 | 3283.9 | 57 (17.5) | 1735.7 (1285.1, 2186.4) | 1.00 |
| Yes | 62 | 567.7 | 18 (29.0) | 3170.7 (1705.9, 4635.5) | 1.88 (1.11, 3.20) |
| Total | 396 | 3949.7 | 76 (19.2) | 1924.2 (1491.6, 2356.8) |
| Variables | n | Person-years | Fractures, n (%) | Incidence density1 (95% CI) | Crude HR |
|---|---|---|---|---|---|
| Lifestyle | |||||
| Salty food preference | |||||
| No | 261 | 2608.7 | 45 (17.2) | 1725.0 (1221.0, 2229.0) | 1.00 |
| Yes | 132 | 1308.8 | 30 (22.7) | 2292.2 (1471.9, 3112.4) | 1.33 (0.84, 2.12) |
| Dietary calcium intake | |||||
| ≥1 time/wk | 251 | 2548.5 | 41 (16.3) | 1608.8 (1116.3, 2101.2) | 1.00 |
| <1 time/wk | 140 | 1347.1 | 34 (24.3) | 2523.9 (1675.6, 3372.3) | 1.61 (1.02, 2.54) |
| Coffee | |||||
| Sometimes or never | 320 | 3190.2 | 59 (18.4) | 1849.4 (1377.5, 2321.3) | 1.00 |
| Daily | 73 | 727.4 | 16 (21.9) | 2199.6 (1121.8, 3277.4) | 1.20 (0.69, 2.08) |
| Alcohol intake | |||||
| No | 333 | 3340.1 | 62 (18.6) | 1856.2 (1394.2, 2318.3) | 1.00 |
| Yes | 59 | 566.5 | 13 (22.0) | 2294.8 (1047.3, 3542.3) | 1.25 (0.69, 2.28) |
| Smoking | |||||
| No | 371 | 3700.9 | 71 (19.1) | 1918.5 (1472.2, 2364.7) | 1.00 |
| Yes | 20 | 194.7 | 4 (20.0) | 2054.4 (41.1, 4067.8) | 1.09 (0.40, 2.98) |
| Exercise frequency | |||||
| <3 time/wk | 366 | 3665.7 | 69 (18.9) | 1882.3 (1438.2, 2326.5) | 1.00 |
| ≥3 time/wk | 25 | 229.8 | 6 (24.0) | 2611 (521.8, 4700.2) | 1.41 (0.61, 3.24) |
| Menstrual and reproductive characteristics | |||||
| Menopausal status | |||||
| Premenopause | 59 | 619.1 | 3 (5.1) | 484.6 (1.0,1,032.9) | 1.00 |
| Postmenopause | 335 | 3309.9 | 73 (21.8) | 2205.5 (1699.6, 2711.4) | 4.65 (1.47,14.84) |
| No. of children | |||||
| ≤3 | 113 | 1150.9 | 15 (13.3) | 1303.3 (643.8,1962.9) | 1.00 |
| >3 | 276 | 2722.7 | 60 (21.7) | 2203.7 (1646.1, 2761.3) | 1.71 (0.97, 3.01) |
| Duration of total breast-feeding (y) | |||||
| ≤8 | 235 | 2397.8 | 37 (15.7) | 1543.1 (1045.9, 2040.3) | 1.00 |
| >8 | 155 | 1486.8 | 38 (24.5) | 2555.8 (1743.2, 3368.5) | 1.69 (1.08, 2.66) |
| Baseline BMD (T-score) | |||||
| ≥-1.0 | 158 | 1596.1 | 27 (17.1) | 1691.6 (1053.5, 2329.7) | 1.00 |
| 2.5 to -1.0 | 201 | 1978.0 | 42 (20.9) | 2123.4 (1481.2, 2765.5) | 1.25 (0.77, 2.04) |
| ≤-2.5 | 37 | 375.6 | 7 (18.9) | 1863.7 (483.0, 3244.3) | 1.11 (0.48, 2.55) |
| Total | 396 | 3949.7 | 76 (19.2) | 1924.2 (1491.6, 2356.8) |
| Variable | Crude HR (95% CI) | Adjusted HR1 (95% CI) |
|---|---|---|
| Age (y) | ||
| 40-59 | 1.00 | 1.00 |
| 60-69 | 1.70 (1.09, 2.67) | 1.26 (0.76, 2.08) |
| BMI (kg/m2) | ||
| <18.5 | 2.25 (0.98, 5.19) | 2.66 (1.13, 6.24) |
| ≥18.5 | 1.00 | 1.00 |
| Previous fracture history | ||
| No | 1.00 | 1.00 |
| Yes | 1.24 (0.45, 3.39) | 1.14 (0.41, 3.18) |
| Parental history of osteoporosis | ||
| No | 1.00 | 1.00 |
| Yes | 1.88 (1.11, 3.20) | 2.03 (1.18, 3.49) |
| Dietary calcium intake | ||
| ≥1 time/wk | 1.00 | 1.00 |
| <1 time/wk | 1.61 (1.02, 2.54) | 1.36 (0.85, 2.19) |
| Menopausal status | ||
| Premenopause | 1.00 | 1.00 |
| Postmenopause | 4.56 (1.47, 14.76) | 3.50 (1.05,11.67) |
| Duration of total breast-feeding (y) | ||
| ≤8 | 1.00 | 1.00 |
| >8 | 1.70 (1.08, 2.67) | 1.35 (0.83, 2.20) |
| Baseline BMD (T-score) | ||
| ≥-1.0 | 1.00 | 1.00 |
| <-1.0 | 1.23 (0.77,1.97) | 0.93 (0.57,1.51) |
HR, hazard ratio; CI, confidence interval; BMI, body mass index; BMD, bone mineral density.
1 Adjusted HR was adjusted for age, body mass index, previous fracture history, parental history of osteoporosis, dietary calcium intake, menopausal status, duration of total breast-feeding, and bone mineral density.
- 1. Scottish Intercollegiate Guidelines Network. Management of osteoporosis. Edinburgh: Scottish Intercollegiate Guidelines Network; 2003. p. 5
- 2. World Health Organization. Prevention and management of osteoporosis. Geneva: World Health Organization; 2003. p. 2
- 3. Tarantino U, Cannata G, Lecce D, Celi M, Cerocchi I, Iundusi R. Incidence of fragility fractures. Aging Clin Exp Res 2007;19(4 Suppl):7-11PubMed
- 4. World Health Organization. WHO scientific group on the assessment of osteoporosis at primary health care level. Geneva: World Health Organization; 2007. p. 5-7
- 5. Korea National Statistical Office. Population projections for Korea: 2005-2050. Seoul: Korea National Statistical Office; 2006. p. 4 (Korean)
- 6. Cho NH. Osteoporosis epidemiology. J Korean Soc Osteoporos 2005;3(1):7-34. (Korean)
- 7. Kado DM, Lui LY, Ensrud KE, Fink HA, Karlamangla AS, Cummings SR, et al. Hyperkyphosis predicts mortality independent of vertebral osteoporosis in older women. Ann Intern Med 2009;150(10):681-687ArticlePubMedPMC
- 8. Nguyen TV, Eisman JA, Kelly PJ, Sambrook PN. Risk factors for osteoporotic fractures in elderly men. Am J Epidemiol 1996;144(3):255-263ArticlePubMed
- 9. Robbins J, Aragaki AK, Kooperberg C, Watts N, Wactawski-Wende J, Jackson RD, et al. Factors associated with 5-year risk of hip fracture in postmenopausal women. JAMA 2007;298(20):2389-2398ArticlePubMed
- 10. Barrett-Connor E. The economic and human costs of osteoporotic fracture. Am J Med 1995;98(2A):3S-8SArticle
- 11. International Osteoporosis Foundation; European Society of Musculoskeletal Radiology. Vertebral fracture initiative resource document. Nyon: International Osteoporosis Foundation; 2003. p. 3
- 12. Kang HY, Kang DR, Jang YH, Park SE, Choi WJ, Moon SH, et al. Estimating the economic burden of osteoporotic vertebral fracture among elderly Korean women. J Prev Med Public Health 2008;41(5):287-294. (Korean)ArticlePubMedPDF
- 13. Korean Society of Bone Metabolism. Physician’s guide for diagnosis and treatment of osteoporosis. Seoul: Korean Society of Bone Metabolism; 2008. p. 3-4 (Korean)
- 14. Bliuc D, Nguyen ND, Milch VE, Nguyen TV, Eisman JA, Center JR. Mortality risk associated with low-trauma osteoporotic fracture and subsequent fracture in men and women. JAMA 301;19(5):513-521Article
- 15. World Health Organization, Western Pacific Region. The International Association for the Study of Obesity and the International Obesity Task Force. The Asia-Pacific perspective: redefining obesity and its treatment; 2000 [cited 2014 Aug 18]. Available from: http://www.wpro.who.int/nutrition/documents/docs/Redefiningobesity.pdf
- 16. Bessette L, Ste-Marie LG, Jean S, Davison KS, Beaulieu M, Baranci M, et al. The care gap in diagnosis and treatment of women with a fragility fracture. Osteoporos Int 2008;19(1):79-86ArticlePubMed
- 17. Kannus P, Parkkari J. Prevention of hip fracture with hip protectors. Age Ageing 2006;35 Suppl 2: ii51-ii54Article
- 18. Lee ET, Wang JW. Statistical methods for survival data analysis. 3rd ed. Hoboken: Wiley; 2003. p. 298-338
- 19. Center JR, Bliuc D, Nguyen TV, Eisman JA. Risk of subsequent fracture after low-trauma fracture in men and women. JAMA 2007;297(4):387-394ArticlePubMed
- 20. Jung SE, Yoon YS, Lee NW, Kim T, Kim HJ, Lee KW, et al. Estimated prevalence of osteoporosis in Ansan, Korea. J Korean Soc Osteoporos 2006;4(1):41-48. (Korean)
- 21. Shin HH, Kim SY, Sohn SJ. Estimation of incidence rate of osteoporotic fracture among the elderly in a city. Korean J Bone Metab 2001;8(2):159-171. (Korean)
- 22. Kato I, Toniolo P, Zeleniuch-Jacquotte A, Shore RE, Koenig KL, Akhmedkhanov A, et al. Diet, smoking and anthropometric indices and postmenopausal bone fractures: a prospective study. Int J Epidemiol 2000;29(1):85-92ArticlePubMed
- 23. Johnell O, Gullberg B, Kanis JA, Allander E, Elffors L, Dequeker J, et al. Risk factors for hip fracture in European women: the MEDOS Study. Mediterranean Osteoporosis Study. J Bone Miner Res 1995;10(11):1802-1815ArticlePubMed
- 24. Ensrud KE, Cauley J, Lipschutz R, Cummings SR; Study of Osteoporotic Fractures Research Group. Weight change and fractures in older women. Study of Osteoporotic Fractures Research Group. Arch Intern Med 1997;157(8):857-863ArticlePubMed
- 25. Hippisley-Cox J, Coupland C. Predicting risk of osteoporotic fracture in men and women in England and Wales: prospective derivation and validation of QFractureScores. BMJ 2009;339: b4229Article
- 26. Kanis JA, Johnell O, Oden A, Johansson H, McCloskey E. FRAX and the assessment of fracture probability in men and women from the UK. Osteoporos Int 2008;19(4):385-397ArticlePubMedPMC
- 27. Ahlborg HG, Johnell O, Turner CH, Rannevik G, Karlsson MK. Bone loss and bone size after menopause. N Engl J Med 2003;349(4):327-334ArticlePubMed
- 28. Cauley JA, Hochberg MC, Lui LY, Palermo L, Ensrud KE, Hillier TA, et al. Long-term risk of incident vertebral fractures. JAMA 2007;298(23):2761-2767Article
- 29. Lips P. Epidemiology and predictors of fractures associated with osteoporosis. Am J Med 1997;103(2A):3S-8SArticlePubMed
- 30. Ullom-Minnich P. Prevention of osteoporosis and fractures. Am Fam Physician 1999;60(1):194-202PubMed
- 31. Silva MJ. Biomechanics of osteoporotic fractures. Injury 2007;38 Suppl 3: S69-S76Article
- 32. Kim DY. Clinical application of bone mineral density measurement. Korean J Nucl Med 2004;38(4):275-281. (Korean)
- 33. Cumming RG, Nevitt MC. Calcium for prevention of osteoporotic fractures in postmenopausal women. J Bone Miner Res 1997;12(9):1321-1329ArticlePubMed
- 34. Jang SN, Choi YH, Choi MG, Kang SH, Jeong JY, Choi YJ, et al. Prevalence and associated factors of osteoporosis among postmenopausal women in Chuncheon: Hallym Aging Study (HAS). J Prev Med Public Health 2006;39(5):389-396. (Korean)PubMed
- 35. Zhang YY, Liu PY, Deng HW. The impact of reproductive and menstrual history on bone mineral density in Chinese women. J Clin Densitom 2003;6(3):289-296ArticlePubMed
- 36. Ivers RQ, Cumming RG, Mitchell P, Peduto AJ. The accuracy of self-reported fractures in older people. J Clin Epidemiol 2002;55(5):452-457ArticlePubMed
- 37. Ismail AA, O’Neill TW, Cockerill W, Finn JD, Cannata JB, Hoszowski K, et al. Validity of self-report of fractures: results from a prospective study in men and women across Europe: EPOS Study Group. Osteoporos Int 2000;11(3):248-254ArticlePubMed
REFERENCES
Figure & Data
References
Citations
- Comparison of intraoperative radiation exposure with and without use of distal targeting device: a randomized control study
Jun-Il Yoo, Hojin Jeong, Jaeboem Na, Sang-Youn Song, Jung-Taek Kim, Yong-Han Cha, Chan Ho Park
Archives of Orthopaedic and Trauma Surgery.2019; 139(11): 1579. CrossRef
 PubReader
 ePub Link
 Cite
Cite