Articles
- Page Path
- HOME > J Prev Med Public Health > Volume 51(3); 2018 > Article
-
Original Article
The Impact of Air Pollution, Including Asian Sand Dust, on Respiratory Symptoms and Health-related Quality of Life in Outpatients With Chronic Respiratory Disease in Korea: A Panel Study -
Motoyuki Nakao1, Yoko Ishihara1
 , Cheol-Hong Kim2, In-Gyu Hyun2
 -
Journal of Preventive Medicine and Public Health 2018;51(3):130-139.
DOI: https://doi.org/10.3961/jpmph.18.021
Published online: May 9, 2018
1Department of Public Health, Kurume University School of Medicine, Kurume, Japan
2Department of Internal Medicine, Respiratory Health Center, Hallym University Dongtan Sacred Heart Hospital, Hwaseong, Korea
- Corresponding author: Yoko Ishihara, PhD Department of Public Health, Kurume University School of Medicine, 67 Asahimachi, Kurume, Fukuoka 830-0011, Japan E-mail: blackcat@med.kurume-u.ac.jp
Copyright © 2018 The Korean Society for Preventive Medicine
This is an Open Access article distributed under the terms of the Creative Commons Attribution Non-Commercial License (http://creativecommons.org/licenses/by-nc/4.0/) which permits unrestricted non-commercial use, distribution, and reproduction in any medium, provided the original work is properly cited.
ABSTRACT
-
Objectives
- Air pollution is a growing concern in Korea because of transboundary air pollution from mainland China. A panel study was conducted to clarify the effects of air pollution on respiratory symptoms and health-related quality of life (HR-QoL) in outpatients with and without chronic obstructive pulmonary disease (COPD) in Korea.
-
Methods
- Patients filled out a questionnaire including self-reported HR-QoL in February and were followed up in May and July. The study was conducted from 2013 to 2015, with different participants each year. Air quality parameters were applied in a generalized estimating equation as independent variables to predict factors affecting HR-QoL.
-
Results
- Lower physical fitness scores were associated with Asian sand dust events. Daily activity scores were worse when there were high concentrations of particulate matter (PM) less than 10 μm in diameter (PM10). Lower social functioning scores were associated with high PM less than 2.5 μm in diameter and nitrogen dioxide (NO2) concentrations. High NO2 concentrations also showed a significant association with mental health scores. Weather-related cough was prevalent when PM10, NO2, or ozone (O3) concentrations were high, regardless of COPD severity. High PM10 concentrations were associated with worsened wheezing, particularly in COPD patients.
-
Conclusions
- The results suggest that PM, NO2, and O3 cause respiratory symptoms leading to HR-QoL deterioration. While some adverse effects of air pollution appeared to occur regardless of COPD, others occurred more often and more intensely in COPD patients. The public sector, therefore, needs to consider tailoring air pollution countermeasures to people with different conditions to minimize adverse health effects.
- Both acute and chronic exposure to air pollution are known to have detrimental effects on cardiorespiratory health [1]. Worsening air pollution in northeast Asia, including Korea and Japan, is believed to be due to long-range transport of air pollutants from industrialized areas of mainland China [2,3], as well as domestic sources of air pollution such as motor vehicles, industry, and open burning [4,5]. In addition to anthropogenic air pollutants, a natural phenomenon known as Asian sand dust (ASD) causes air pollution in East Asia. ASD particles originating from inland China, including the Gobi and Taklamakan deserts and the Loess Plateau, are transported to East Asia with the westerlies and monsoon mainly in the spring, accompanied by pollutants produced in industrial areas on the east coast of China [6,7]. Ambient nitrate and sulfate concentrations have been reported to remain high, accompanied by long-lasting high ambient particulate matter (PM) concentrations, during ASD events in Korea and Japan [8]. Lee et al. [9] reported that the microbial profiles of ambient particles during ASD events were distinctive from those observed during non-ASD events, suggesting that ASD might cause adverse health effects in areas covered with ASD particles. PM air pollution has been reported to have health effects in terms of mortality and morbidity from cardiorespiratory diseases, respiratory symptoms, and hospital admissions [10-13]. In the estimation of effects on the atmospheric environment, which is intimately involved in daily life, objective and clinical endpoints, as well as a multifaceted evaluation including a subjective measure of impact, are desirable. Therefore, the concept of health-related quality of life (HR-QoL), which refers to an individual’s perception of well-being, should also be considered as a health outcome of exposure to air pollution [14]. Although Yamazaki et al. [15] reported a significant linear trend of lower HR-QoL vitality scores on the Short Form-36 Health Survey (SF-36) in groups exposed to higher concentrations of nitrogen oxides in Japan, few studies have investigated the effects of air pollution on HR-QoL in Korea.
- To elucidate the association of air pollution levels with patients’ reported respiratory symptoms and HR-QoL, we conducted a hospital-based panel study of patients with or without chronic obstructive pulmonary disease (COPD) living in Dongtan, Hwaseong, which is 30-40 km south of Seoul.
INTRODUCTION
- Study Design and Participants
- This institution-based panel study was conducted among Korean adults at Hallym University Dongtan Sacred Heart Hospital in Hwaseong, Gyeonggi Province, Korea. Patients aged 40-79 years visiting the hospital in February from 2013 to 2015 were recruited, and a different set of patients was established each year. Outpatients with COPD were diagnosed by a respiratory specialist with reference to the results of a pulmonary function test. Patients with COPD in a stable state (not in an exacerbation state or undergoing home oxygen therapy) were classified as having COPD according to the Global Initiative for Chronic Obstructive Lung Disease (GOLD) criteria [16]. Participants with no respiratory diseases were classified as the referent group. Participants filled out a questionnaire at enrollment in February and were followed up in May and July, when the questionnaire was administered. In February, a total of 75 patients with COPD and 90 referents were included. The follow-up rates of COPD and referent groups measured against the initial February enrollment were 90.7% (n= 68) and 88.9% (n= 80), respectively, in May and 84.0% (n= 63) and 83.3% (n= 75), respectively, in July.
- Ethical Approval and Consent to Participate
- This study was approved by the clinical ethical review board of Kurume University School of Medicine and Hallym University Dongtan Sacred Heart Hospital. Before the investigation, participants were provided with an explanation in person regarding the purpose and method of the study, as well as information regarding data handling. The study was carried out upon receipt of written consent.
- Questionnaire
- The questionnaire was a self-completed booklet containing items on demographics and lifestyle such as age, sex, smoking history, occupation, and respiratory symptoms (Q1: Does the weather affect your cough?; Q2: Have you ever coughed up sputum from your chest when you did not have a cold?; Q3: Do you usually cough up sputum from your chest first thing in the morning?; and Q4: How frequently do you wheeze?), the Dartmouth Coop Functional Health Assessment/World Organization of National Colleges, Academies, and Academic Association of General Practitioners (COOP/WONCA) charts, and the SF-36 version 2 (SF-36v2). Permission for the use of the Korean version of the COOP/WANCA charts was obtained from Van Weel [17], and permission for the use of the Korean version of the SF-36v2 was licensed from QualityMetric Incorporated (New York, NY, USA). The validity and reliability of the Korean versions of the SF-36v2 and COOP/WONCA charts have previously been demonstrated [18-20]. Responses to the COOP/WONCA charts, which comprised 8 items (physical fitness, feelings, daily activities, social activities, change in health, overall health, pain, and quality of life), were scored on a 5-point ordinal scale (1=best; 5=worst) [17]. The scores of the COOP/WANCA charts were inverted (5=best; 1=worst) to facilitate interpretation. Responses to the SF-36v2, which comprised 36 questions, were on 3-, 5-, or 6-point ordinal scales, from which 8 subscales (physical functioning, role limitations due to physical health problems [role: physical], bodily pain, general health perceptions, vitality, social functioning, role limitations due to emotional problems [role: emotional], mental health) from 0 to 100 points (minimum=0, maximum= 100) were calculated according to the scoring manual [21].
- Sources of Air Quality Data
- Air quality data, including PM less than 10 μm in diameter (PM10), PM less than 2.5 μm in diameter (PM2.5), nitrogen dioxide (NO2), sulfate dioxide (SO2), ozone (O3), and carbon monoxide (CO) data were obtained from a monitoring station in Dontang-dong, Hwaseong, which was the nearest station to the hospital, according to the Gyeonggi-do Institute of Health and Environment [22]. Ambient temperature and relative humidity (RH) were obtained from data collected at the nearest weather station to the hospital (37.267° east longitude and 126.983° north latitude) according to the National Oceanic and Atmospheric Administration, National Data Center climate data available online [23]. Personal exposure to each pollutant, temperature, and humidity was based on the mean value at 4 weeks before survey enrollment. ASD events were defined according to the criteria used by the National Institute of Environmental Research [24].
- Data were anonymized and managed electronically for analysis. Statistical analyses, including the Welch t-test, the chi-square test, and generalized estimating equation (GEE) analysis [25], were performed using SPSS version 22.0 (IBM Corp., Armonk, NY, USA), and p<0.05 were considered to indicate statistical significance. We chose a binary logistic model, which specifies a binominal as the distribution and logit as the link function, for GEE analysis and coded the COOP/WONCA chart scores (0=4 and 5 points; 1=1-3 points), SF-36v2 subscale scores (0=>median; 1=≤median), and respiratory symptoms (Q1: weather affects your cough; Q2: coughing up sputum without cold; Q3: coughing up sputum first thing in the morning; Q4: frequent wheezing; 0=no [Q1-Q3] or never [Q4]; 1=yes [Q1-Q3] or occasionally/more often [Q4]) as dependent variables for the GEE analysis. In the crude model, pollutant concentrations (in 10 μg/m3 [PM10, PM2.5] or 10 parts per billion [NO2, O3] increments), ASD events during the past month (0=did not occur; 1=occurred), temperature (in 10°C increments), and RH (in 10% increments) were applied as covariates, and these variables were entered separately due to multicollinearity (Table S1). We applied the average concentrations of pollutants from 1 month before the day of entry because our questionnaires asked about subjects’ health status during the past 2-4 weeks. SO2 and CO were excluded from the analysis because the concentrations of these compounds were much lower than Korean National Ambient Air Quality Standards [26] (Figure S1). Age (years old), sex (0= female; 1=male), body mass index (0=>median; 1=≤median), smoking status (0=never smoker; 1=ex-smoker; 2=current smoker), COPD severity (0=no COPD; 1=GOLD stage I; 2=GOLD stage II; 3=GOLD stages III and IV), use of air cleaning equipment (0=no; 1=yes), and time spent outdoors (hr/d) were applied as predictive variables in the adjusted model. In the adjusted model, ambient temperature and RH were also applied.
METHODS
Data handling and statistical analyses
- Characteristics of Participants and Air Quality During Survey Period
- The characteristics of participants at the baseline (February) are presented in Table 1. The mean age, male-to-female ratio, and smoking rate in the COPD group were significantly higher than in the referent group. A significant mean age difference was found only in male participants. Body mass index and employment were significantly lower in the COPD group than in the referent group. While hay fever and self-reported asthma were more prevalent in the COPD group than in the referent group, this difference was not significant. About half of the COPD patients were classified as GOLD stage II (moderate), after which GOLD stage I (mild), III (severe), and IV (very severe) were most prevalent, in decreasing order. Air quality and climate data during the survey period are summarized in Table 2 and Figure S1.
- Comparison Of HR-QoL Scores and Respiratory Symptoms Between the COPD and Referent Groups
- Table 3 shows that for each month, physical fitness, overall health, and quality of life scores on the COOP/WONCA charts were significantly worse in the COPD group than in the referent group. Daily activity scores on the COOP/WONCA charts were only worse in the COPD group than in the referent group in July. In February, all SF-36v2 subscale scores excluding mental health scores were worse in the COPD group than in the referent group. Four kinds of respiratory symptoms were more prevalent in the COPD group than in the referent group, and the number of symptoms per participant was higher in the COPD group than in the referent group.
- Factors Associated With Respiratory Symptoms, COOP/WONCA Chart Scores, and SF-36v2 Subscale Scores
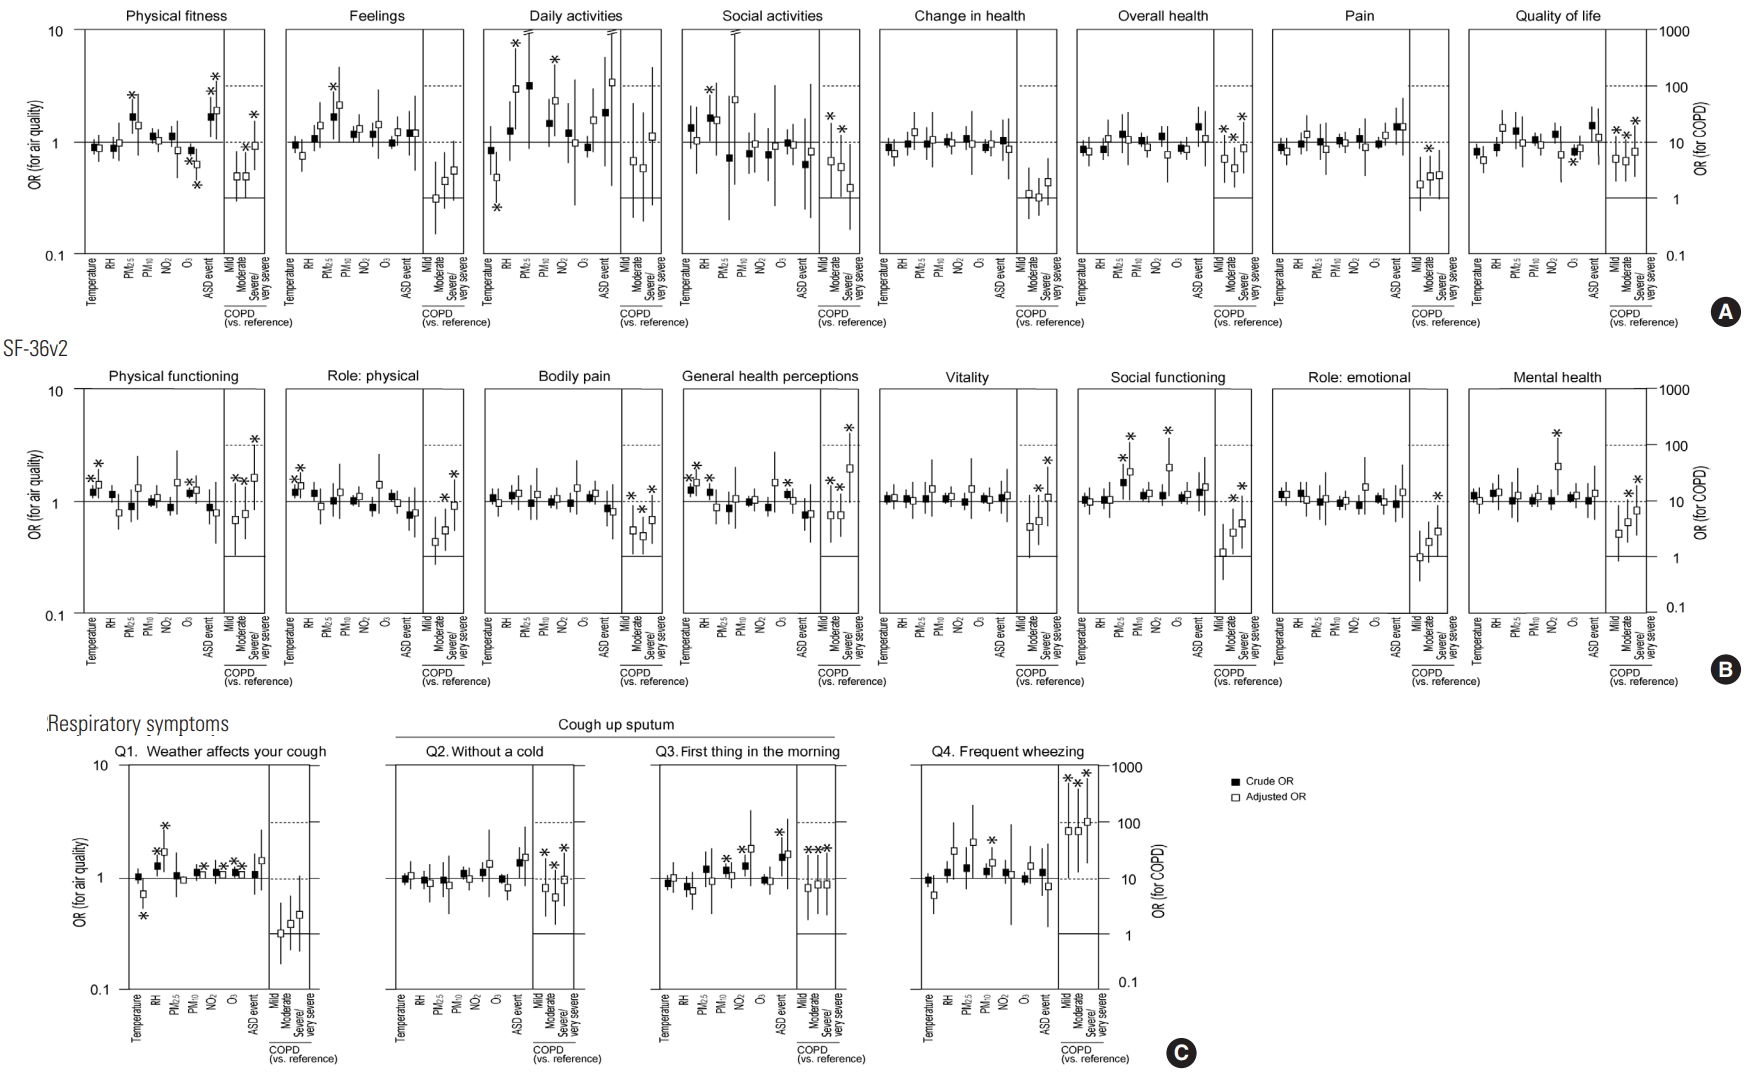
- The associations of ambient air quality with COOP/WONCA chart scores, SF-36v2 subscale scores, and respiratory symptoms were examined using GEE analysis (Figure 1). After adjusting for demographics, lifestyle, disease severity, temperature, and humidity, it was found that ASD events were associated with lower physical fitness COOP/WONCA chart scores. Increased PM10 concentrations were related to worse daily activity COOP/WONCA chart scores. The relationship between daily activities and PM2.5 parameters could not be examined because PM2.5 parameters did not fit this GEE model. Regarding the SF-36v2 subscales, higher PM2.5 and NO2 concentrations were associated with lower social functioning scores, and higher NO2 concentrations were correlated with lower mental health scores. Higher PM10, NO2, and O3 concentrations were related to affirmative answers to symptom Q1 (Does the weather affect your cough?), and higher PM10 concentrations were associated with affirmative answers to symptom Q4 (How frequently do you wheeze?).
RESULTS
- We conducted a hospital-based panel study of Korean adults to try to predict the impact of air pollution on 75 participants with COPD and 90 participants without respiratory diseases (Table 1). We used GEE analysis to predict the association between air pollution and health status because this study consisted of an iterative survey. Some significant associations of air quality parameters with HR-QoL and respiratory symptoms were found in this study (Figure 1).
- Children, elderly people, and patients with respiratory disorders are considered highly susceptible to air pollution [13]. Morbidity, mortality, hospital admission, and cardiorespiratory symptoms were therefore analyzed as health outcomes of air pollution. Patients with COPD, which elderly people are prone to, presented a significant association between increased mortality and hospitalization due to disease exacerbation from short-term exposure to ambient fine PM [27]. In addition to clinical and objective endpoints, HR-QoL changes should also be considered as a health outcome of exposure to air pollution [14]. Although few reports have investigated the relationship between air pollution and HR-QoL, Yamazaki et al. [15,28] reported that higher nitrogen oxide and oxidant concentrations were associated with lower vitality scores on the SF-36 in Japan. Our previous study showed that HR-QoL in Mongolian adults with respiratory diseases was worse in the cold season, when air pollution is severe [29,30]. Kamimura et al. [31] reported that perceived environmental pollution levels were associated with HR-QoL, but with different patterns among 3 East Asian countries (China, Japan, and Korea). These reports suggest that HR-QoL may be a useful measure to assess the impact of air pollution on public health, although international differences exist.
- Seasonal variations in the clinical conditions of COPD have been reported, with more patients suffering exacerbations in winter [32,33]. Miravitlles et al. [34] reported that HR-QoL in COPD patients was better in spring/summer than in the winter. In the present study, temperature and humidity were included as independent variables in the model to analyze seasonal factors. Higher temperatures were significantly associated with worse scores of physical functioning, role: physical, and general health perception subscales of the SF-36v2, while the COOP/WONCA daily activities score worsened in association with lower temperatures (Figure 1). Our results are not consistent with previous reports [32-34], except for the COOP/WONCA daily activities score. We speculate that this inconsistency is attributable to the survey being started in winter. Only COPD patients in a stable state even in winter were included, so this set of patients may not have been susceptible to exacerbation. The cause of the association between higher temperatures and worse HR-QoL remains unclear.
- ASD events were significantly associated with lower physical fitness scores on the COOP/WONCA charts, even after adjustment (Figure 1). COOP/WONCA physical fitness scores were also associated with COPD severity, suggesting that physical fitness in the COPD patients was more vulnerable to exposure to ASD events than in the referent group. The association of COOP/WONCA daily activity scores with PM10 was independent of COPD severity. All SF-36v2 subscales were significantly associated with COPD severity. Additionally, social functioning subscale scores on the SF-36v2 were related to PM2.5 and NO2 concentrations, suggesting that social functioning in the COPD group was more vulnerable to exposure to these pollutants than in the referent group. The “weather affects your cough” symptom was associated with PM10, NO2, and O3 concentrations but not with COPD severity, while the “frequent wheezing” symptom was correlated with PM10 and COPD severity. These results suggest that PM10 and gaseous pollutants such as NO2 and O3 cause weather-related cough, leading to the deterioration of daily activities, and this cascade of reaction to PM10 exposure is suggested to occur independently of COPD. In contrast, PM10 is also suggested to cause wheezing, leading to the deterioration of physical fitness and social functioning, and COPD patients appear to be more susceptible to PM10 than those without COPD. PM2.5 was also associated with frequent wheezing after adjustment, but not to a significant extent. ASD events were not significantly associated with any symptoms, though they were associated with the HR-QoL physical fitness score. The main component of ASD is soil-derived PM, including PM10, and PM2.5 [35]. Therefore, ASD events might have some impact on symptoms such as coughing and wheezing, thereby worsening the daily activity, physical fitness, and social functioning aspects of HR-QoL. Additionally, increased O3 concentrations were associated with weather-related cough, independent of COPD severity. However, O3 did not show any adverse effects on HR-QoL—instead, lower O3 concentrations were associated with lower COOP/WONCA physical fitness scores in an obscure way. Since O3 is a substance temporarily produced due to the interaction of volatile organic compounds or nitrogen oxides with ultraviolet rays [36], the association of NO2 with social functioning and mental health might be related to fluctuations in ambient O3 concentrations. The differences in the effects of gaseous pollutants and PM on respiratory symptoms might be explained in terms of the physical and chemical properties of these pollutants and pathophysiological and physiological differences between the participants with and without chronic respiratory diseases [37,38].
- There were several limitations of this study. First, the sample size was relatively small, which may be why few parameters showed a significant association with symptoms and HR-QoL scores. Second, since this was a panel study, the participants were not strictly followed. The causal relationship between HR-QoL and air quality parameters remains unclear, although more insight was obtained through comparisons with cross-sectional studies. Third, although the odds ratios were adjusted for various factors to estimate the association of environmental exposure with symptoms and HR-QoL in the GEE analysis, unknown confounders may have been present because this study was conducted with a small sample. Finally, although air quality data were obtained from monitoring stations near the hospital, it was impossible to verify a consistent relationship between each participant’s range of movement and the location of the station. To evaluate the relationship between air pollution and health outcomes accurately, it would be necessary to measure indoor air quality and personal exposure to air pollution.
- In conclusion, this study reported that PM air pollution may cause respiratory symptoms, leading to HR-QoL deterioration, in a sample of Korean participants. While some adverse effects of air pollution appeared to occur regardless of COPD, others appeared to occur more often and with greater severity among COPD patients. The public sector, therefore, needs to consider tailoring air pollution countermeasures to people with different health conditions to minimize adverse health effects.
DISCUSSION
ACKNOWLEDGEMENTS
-
CONFLICT OF INTEREST
The authors have no conflicts of interest associated with the material presented in this paper.
Notes
SUPPLEMENTAL MATERIALS

| Characteristics | COPD patients (n = 75) | Referents (n = 90) | p-value |
|---|---|---|---|
| Age (y) | |||
| Overall | 66.6±8.7 | 59.8±6.1 | <0.0011 |
| Male | 66.5±8.7 | 56.0±4.2 | <0.0011 |
| Female | 70.0±7.2 | 62.4±5.8 | 0.201 |
| BMI (kg/m2) | 22.3±3.2 | 23.8±2.9 | 0.0021 |
| Sex | |||
| Male | 72 (96.0) | 36 (40.0) | <0.0012 |
| Female | 3 (4.0) | 54 (60.0) | |
| Smoking status | |||
| Current smoker | 24 (32.0) | 14 (15.6) | |
| Ex-smoker | 41 (54.7) | 11 (12.2) | <0.0012 |
| Never smoker | 10 (13.3) | 65 (72.2) | |
| Occupation | |||
| White-collar | 5 (6.7) | 11 (12.2) | |
| Blue-collar | 25 (33.3) | 71 (78.9) | <0.0012 |
| Retired or unemployed | 45 (60.0) | 8 (8.9) | |
| Prevalence | |||
| Hay fever | 5 (6.7) | 1 (1.1) | 0.062 |
| Self-reported asthma | 5 (6.7) | 1 (1.1) | 0.062 |
| COPD status (GOLD stage) | |||
| I | 18 (24.0) | ||
| II | 36 (48.0) | ||
| III | 17 (22.7) | ||
| IV | 4 (5.3) |
NAAQS, national air quality standard for daily mean (for PM2.5, PM10, NO2, and SO2) or daytime mean (for O3 and CO); SD, standard deviation; Min, minimum; Max, maximum; IQR, interquartile range; QT, quartile; PM2.5, particulate matter less than 2.5 μm in diameter; PM10, particulate matter less than 10 μm in diameter; NO2, nitrogen dioxide; SO2, sulfur dioxide; O3. ozone; CO, carbon monoxide; ppb, parts per billion; ppm, parts per million.
1 PM2.5, PM10, NO2, and SO2 are presented as monthly means of the daily average value; O3 and CO are presented as monthly means of the daily maximum value of the 8-hour moving average.
|
February |
May |
July |
|||||||||
|---|---|---|---|---|---|---|---|---|---|---|---|
| Referents (n=88) | COPD (n=75) | p-value1 | Referents (n=80) | COPD (n=68) | p-value1 | Referents (n=75) | COPD (n=63) | p-value1 | |||
| COOP/WONCA charts (best: 5-worst: 1)2 | |||||||||||
| Physical fitness | 4.2±1.1 | 3.4±1.4 | <0.001 | 4.3±0.9 | 3.6±1.4 | <0.001 | 4.3±0.9 | 3.4±1.3 | <0.001 | ||
| Feelings | 4.3±0.8 | 4.1±0.9 | NS | 4.2±0.6 | 4.1±0.9 | NS | 4.2±0.7 | 4.0±1.0 | NS | ||
| Daily activities | 4.7±0.5 | 4.5±0.7 | NS | 4.7±0.4 | 4.6±0.6 | NS | 4.7±0.5 | 4.5±0.6 | <0.05 | ||
| Social activities | 4.7±0.5 | 4.6±0.7 | NS | 4.6±0.7 | 4.7±0.6 | NS | 4.6±0.5 | 4.4±0.8 | NS | ||
| Change in health | 3.3±0.7 | 3.1±0.7 | NS | 3.4±0.7 | 3.3±0.7 | NS | 3.3±0.7 | 3.1±0.8 | NS | ||
| Overall health | 3.4±0.7 | 3.1±0.7 | <0.005 | 3.6±0.6 | 3.2±0.7 | <0.001 | 3.6±0.7 | 3.1±0.7 | <0.001 | ||
| Pain | 3.9±1.0 | 3.9±1.1 | NS | 4.1±0.9 | 3.9±0.9 | NS | 4.1±0.9 | 3.9±1.0 | NS | ||
| Quality of life | 3.5±0.7 | 3.2±0.6 | <0.005 | 3.7±0.6 | 3.3±0.8 | <0.001 | 3.6±0.6 | 3.3±0.7 | <0.05 | ||
| SF-36v2 (best: 100-worst: 0) | |||||||||||
| Physical functioning | 87.4±10.6 | 69.5±23.2 | <0.001 | 82.4±13.5 | 67.1±22.0 | <0.001 | 81.7±13.5 | 64.3±24.1 | <0.001 | ||
| Role: physical | 96.2±8.9 | 78.3±27.3 | <0.001 | 92.0±13.6 | 73.8±28.4 | <0.001 | 92.5±13.7 | 71.2±29.9 | <0.001 | ||
| Bodily pain | 84.9±18.1 | 75.3±27.0 | <0.05 | 84.4±17.5 | 73.7±23.6 | <0.005 | 82.8±18.7 | 73.1±25.0 | <0.05 | ||
| General health perceptions | 71.5±16.6 | 53.4±20.9 | <0.001 | 69.0±15.0 | 49.2±19.9 | <0.001 | 68.1±14.6 | 47.6±20.5 | <0.001 | ||
| Vitality | 71.0±17.6 | 58.6±22.5 | <0.001 | 71.9±14.8 | 54.0±25.2 | <0.001 | 71.4±18.6 | 54.1±27.1 | <0.001 | ||
| Social functioning | 94.2±12.0 | 86.0±19.9 | <0.005 | 93.8±12.6 | 84.6±18.7 | <0.001 | 92.7±15.1 | 83.1±22.5 | <0.01 | ||
| Role: emotional | 95.1±10.2 | 83.6±25.7 | <0.001 | 91.7±16.7 | 82.0±23.8 | <0.01 | 90.6±16.4 | 78.3±28.3 | <0.005 | ||
| Mental health | 81.0±16.6 | 77.5±18.7 | NS | 81.8±12.0 | 71.3±20.2 | <0.001 | 80.9±15.4 | 70.0±22.0 | <0.005 | ||
| Respiratory symptoms | |||||||||||
| Weather affects your cough | 10 (11.4) | 26 (34.7) | <0.0013 | 9 (11.3) | 20 (29.4) | <0.013 | 11 (14.7) | 21 (33.3) | <0.013 | ||
| Coughing up sputum | |||||||||||
| When you don’t have a cold | 19 (21.6) | 49 (65.3) | <0.0013 | 17 (21.3) | 42 (61.8) | <0.0013 | 14 (18.7) | 43 (68.3) | <0.0013 | ||
| First thing in the morning | 13 (14.8) | 36 (48.0) | <0.0013 | 9 (11.3) | 34 (50.0) | <0.0013 | 7 (9.3) | 28 (44.4) | <0.0013 | ||
| Frequent wheezing | 1 (1.1) | 28 (37.3) | <0.0013 | 1 (1.3) | 21 (30.9) | <0.0013 | 1 (1.3) | 22 (34.9) | <0.0013 | ||
| No. of symptoms/participant | 0.49±0.84 | 1.85±1.37 | <0.001 | 0.45±0.81 | 1.72±1.29 | <0.001 | 0.44±0.70 | 1.81±1.26 | <0.001 | ||
Values are presented as mean±standard deviation or number (%).
HR-QoL, health-related quality of life; COPD, chronic obstructive pulmonary disease; COOP/WONCA, Dartmouth Coop Functional Health Assessment/World Organization of National Colleges, Academies, and Academic Association of General Practitioners; SF-36v2, Short Form-36 Health Survey version 2; NS, not significant.
1 Welch t-test.
2 Responses to the 8-item COOP/WONCA charts were scored on a 5-point ordinal scale (5=best, 1=worst); The order of the scores of the COOP/WONCA chart were inverted from the original COOP/WONCA chart scores.
3 χ2-test.
- 1. Coulibaly S, Minami H, Abe M, Hasei T, Oro T, Funasaka K, et al. Long-range transport of mutagens and other air pollutants from mainland East Asia to western Japan. Genes Environ 2015;37: 25ArticlePubMedPMC
- 2. Guan WJ, Zheng XY, Chung KF, Zhong NS. Impact of air pollution on the burden of chronic respiratory diseases in China: time for urgent action. Lancet 2016;388(10054):1939-1951ArticlePubMed
- 3. Kim HS, Chung YS, Yoon MB. An analysis on the impact of large-scale transports of dust pollution on air quality in East Asia as observed in central Korea in 2014. Air Qual Atmos Health 2016;9(1):83-93ArticlePDF
- 4. Heo JB, Hopke PK, Yi SM. Source apportionment of PM2.5 in Seoul, Korea. Atmos Chem Phys 2009;9: 4957-4971ArticlePDF
- 5. Lee HJ, Son YS. Spatial variability of AERONET aerosol optical properties and satellite data in South Korea during NASA DRAGON-Asia campaign. Environ Sci Technol 2016;50(7):3954-3964ArticlePubMed
- 6. Vadrevu KP, Ohara T, Justice C. Air pollution in Asia. Environ Pollut 2014;195: 233-235ArticlePubMed
- 7. Kim HS, Chung YS, Choi HJ. On air pollutant variations in the cases of long-range transport of dust particles observed in central Korea in the leeside of China in 2010. Air Qual Atmos Health 2014;7(3):309-323Article
- 8. Wang Z, Pan X, Uno I, Chen X, Yamamoto S, Zheng H, et al. Importance of mineral dust and anthropogenic pollutants mixing during a long-lasting high PM event over East Asia. Environ Pollut 2018;234: 368-378ArticlePubMed
- 9. Lee S, Choi B, Yi SM, Ko G. Characterization of microbial community during Asian dust events in Korea. Sci Total Environ 2009;407(20):5308-5314ArticlePubMed
- 10. Liu R, Zeng J, Jiang X, Chen J, Gao X, Zhang L, et al. The relationship between airborne fine particle matter and emergency ambulance dispatches in a southwestern city in Chengdu, China. Environ Pollut 2017;229: 661-667ArticlePubMed
- 11. Liu H, Tian Y, Xu Y, Zhang J. Ambient particulate matter concentrations and hospitalization for stroke in 26 Chinese cities: a case-crossover study. Stroke 2017;48(8):2052-2059ArticlePubMed
- 12. Health Effects Institute. Special report: revised analysis of time- series studies of air pollution and health. Boston: Health Effects Institute; 2003. p. 85-89 , 165-172
- 13. Pope CA 3rd. Epidemiology of fine particulate air pollution and human health: biologic mechanisms and who’s at risk? Environ Health Perspect 2000;108 Suppl 4: 713-723ArticlePubMed
- 14. Samet J, Buist S, Bascom R, Garcia J, Lipsett M, Mauderly J, et al. What constitutes an adverse health effect of air pollution? Am J Respir Crit Care Med 2000;161(2 Pt 1):665-673ArticlePubMed
- 15. Yamazaki S, Nitta H, Murakami Y, Fukuhara S. Association between ambient air pollution and health-related quality of life in Japan: ecological study. Int J Environ Health Res 2005;15(5):383-391ArticlePubMed
- 16. Global Initiative for Chronic Obstructive Lung Disease. Global strategy for the diagnosis, management, and prevention of chronic obstructive pulmonary disease (2017 report). [cited 2018 Jan 6]. Available from: http://goldcopd.org/download/326/
- 17. Van Weel C. Functional status in primary care: COOP/WONCA charts. Disabil Rehabil 2009;15(2):96-101Article
- 18. Han CW, Lee EJ, Iwaya T, Kataoka H, Kohzuki M. Development of the Korean version of Short-Form 36-Item Health Survey: health related QOL of healthy elderly people and elderly patients in Korea. Tohoku J Exp Med 2004;203(3):189-194ArticlePubMed
- 19. Stavem K, Jodalen H. Reliability and validity of the COOP/WONCA health status measure in patients with chronic obstructive pulmonary disease. Qual Life Res 2002;11(6):527-533ArticlePubMed
- 20. Suh SY, Im YS, Lee SH, Park MS, Yoo T. A study for the development of Korean version of the Duke-UNC functional social support questionnaire. J Korean Acad Fam Med 1997;18(3):250-260. (Korean)
- 21. Fukuhara S, Suzukamo Y. Manual of SF-36v2 Japanese version. Kyoto: Institute for Health Outcomes & Process Evaluation Research; 2004. p. 55-75 (Japanese)
- 22. Gyeonggi-do Institute of Health & Environment. Air Gyeonggi-do. [cited 2018 Jan 8]. Available from: http://air.gg.go.kr/airgg/ (Korean)
- 23. US Department of Commerce. NNDC climate data online. [cited 2018 Mar 12]. Available from: https://www7.ncdc.noaa.gov/CDO/cdo
- 24. National Institute of Environmental Research. Case analysis of the Asian sand dust event 2015. [cited 2018 Mar 12]. Available from: http://webbook.me.go.kr/DLi-File/NIER/09/021/5621763.pdf (Korean)
- 25. Zeger SL, Liang KY. Longitudinal data analysis for discrete and continuous outcomes. Biometrics 1986;42(1):121-130ArticlePubMed
- 26. Air Korea. Air quality standards. [cited 2018 Jan 6]. Available from: https://www.airkorea.or.kr/eng/information/airQualityStandards
- 27. Li MH, Fan LC, Mao B, Yang JW, Choi AM, Cao WJ, et al. Short-term exposure to ambient fine particulate matter increases hospitalizations and mortality in COPD: a systematic review and meta-analysis. Chest 2016;149(2):447-458ArticlePubMed
- 28. Yamazaki S, Nitta H, Fukuhara S. Associations between exposure to ambient photochemical oxidants and the vitality or mental health domain of the health related quality of life. J Epidemiol Community Health 2006;60(2):173-179ArticlePubMedPMC
- 29. Nakao M, Yamauchi K, Ishihara Y, Solongo B, Ichinnorov D. Effects of air pollution and seasonality on the respiratory symptoms and health-related quality of life (HR-QoL) of outpatients with chronic respiratory disease in Ulaanbaatar: pilot study for the comparison of the cold and warm seasons. Springerplus 2016;5(1):1817ArticlePubMedPMCPDF
- 30. Nakao M, Yamauchi K, Ishihara Y, Omori H, Ichinnorov D, Solongo B. Effects of air pollution and seasons on health-related quality of life of Mongolian adults living in Ulaanbaatar: cross-sectional studies. BMC Public Health 2017;17(1):594ArticlePubMedPMCPDF
- 31. Kamimura A, Armenta B, Nourian M, Assasnik N, Nourian K, Chernenko A. Perceived environmental pollution and its impact on health in China, Japan, and South Korea. J Prev Med Public Health 2017;50(3):188-194ArticlePubMedPMCPDF
- 32. Wise RA, Calverley PM, Carter K, Clerisme-Beaty E, Metzdorf N, Anzueto A. Seasonal variations in exacerbations and deaths in patients with COPD during the TIOSPIR® trial. Int J Chron Obstruct Pulmon Dis 2018;13: 605-616ArticlePubMedPMC
- 33. Donaldson GC, Wedzicha JA. The causes and consequences of seasonal variation in COPD exacerbations. Int J Chron Obstruct Pulmon Dis 2014;9: 1101-1110ArticlePubMedPMC
- 34. Miravitlles M, Ferrer M, Pont A, Zalacain R, Alvarez-Sala JL, Masa F, et al. Effect of exacerbations on quality of life in patients with chronic obstructive pulmonary disease: a 2 year follow up study. Thorax 2004;59(5):387-395ArticlePubMedPMC
- 35. Watanabe M, Noma H, Kurai J, Sano H, Mikami M, Yamamoto H, et al. Effect of Asian dust on pulmonary function in adult asthma patients in western Japan: a panel study. Allergol Int 2016;65(2):147-152ArticlePubMed
- 36. Han S, Bian H, Feng Y, Liu A, Li X, Zeng F, et al. Analysis of the relationship between O3, NO and NO2 in Tianjin, China. Aerosol Air Qual Res 2011;11(2):128-139Article
- 37. Snipes MB. Biokinetics of inhaled radionuclides. In: Raabe OG, editor. Internal radiation-dosimetry. Madison: Medical Physics Publishing; 1994. p. 181-204
- 38. McClellan RO. Particle interactions with the respiratory tract. In: Gehr P, Hyder J, editors. Particle-lung interactions. Boca Raton: CRC Press; 2000. p. 3-63
REFERENCES
Figure & Data
References
Citations
- The effects of Pycnogenol, a pine bark extract on pulmonary inflammation by Asian sand dust in mice
SW Pak, SJ Lee, Kim WI, YG Yang, YK Cho, JS Kim, TW Kim, JW Ko, JC Kim, SH Kim, IS Shin
Veterinární medicína.2024; 69(1): 8. CrossRef - Ambient air pollution and the health-related quality of life of older adults: Evidence from Shandong China
Jialong Tan, Nuo Chen, Jing Bai, Peizhe Yan, Xinyu Ma, Meiling Ren, Elizabeth Maitland, Stephen Nicholas, Wenjing Cheng, Xue Leng, Chen Chen, Jian Wang
Journal of Environmental Management.2023; 336: 117619. CrossRef - Climate change and mental health in Korea: A scoping review
Jiyoung Shin, Juha Baek, Sumi Chae
Journal of Climate Change Research.2023; 14(6-2): 989. CrossRef - Roles of the physical environment in health-related quality of life in patients with chronic obstructive pulmonary disease
Subhabrata Moitra, Maria Foraster, Ane Arbillaga-Etxarri, Alicia Marín, Anael Barberan-Garcia, Diego A. Rodríguez-Chiaradia, Eva Balcells, Maria Koreny, Pere Torán-Monserrat, Pere Vall-Casas, Robert Rodríguez-Roisin, Judith Garcia-Aymerich
Environmental Research.2022; 203: 111828. CrossRef - Ambient PM Concentrations as a Precursor of Emergency Visits for Respiratory Complaints: Roles of Deep Learning and Multi-Point Real-Time Monitoring
SungChul Seo, Choongki Min, Madeline Preston, Sanghoon Han, Sung-Hyuk Choi, So Young Kang, Dohyeong Kim
Sustainability.2022; 14(5): 2703. CrossRef - Comparative Evaluation between Particulate Matter Concentrations in Rural Villages in Wanju-gun and the Air Pollution Monitoring Network
Minji Lee, Dongphil Choi, Kyungsu Kim
The Korean Journal of Community Living Science.2022; 33(1): 139. CrossRef - Air and water health: industrial footprints of COVID-19 imposed lockdown
Vedika Gupta, Nikita Jain, Deepali Virmani, Senthilkumar Mohan, Ali Ahmadian, Massimiliano Ferrara
Arabian Journal of Geosciences.2022;[Epub] CrossRef - Effects of Non‐Photosynthetic Vegetation on Dust Emissions
Xinyue Huang, Hosein Foroutan
Journal of Geophysical Research: Atmospheres.2022;[Epub] CrossRef - Effects of exposure to ambient air pollution on pulmonary function impairment in Korea: the 2007-2017 Korea National Health and Nutritional Examination Survey
Soo Beom Choi, Sungha Yun, Sun-Ja Kim, Yong Bum Park, Kyungwon Oh
Epidemiology and Health.2021; 43: e2021082. CrossRef - Effects of temperature, humidity, and diurnal temperature range on influenza incidence in a temperate region
Ji‐Eun Park, Woo‐Sik Son, Yeonhee Ryu, Soo Beom Choi, Okyu Kwon, Insung Ahn
Influenza and Other Respiratory Viruses.2020; 14(1): 11. CrossRef - Improved Interpolation and Anomaly Detection for Personal PM2.5 Measurement
JinSoo Park, Sungroul Kim
Applied Sciences.2020; 10(2): 543. CrossRef - Asian Sand Dust Particles Increased Pneumococcal Biofilm Formation in vitro and Colonization in Human Middle Ear Epithelial Cells and Rat Middle Ear Mucosa
Mukesh Kumar Yadav, Yoon Young Go, Sung-Won Chae, Moo Kyun Park, Jae-Jun Song
Frontiers in Genetics.2020;[Epub] CrossRef - Latest circular economy policy and direction in the Republic of Korea: Room for enhancements
Manuel Herrador, Youngtae Cho, Pil-Hwan Park
Journal of Cleaner Production.2020; 269: 122336. CrossRef - Association of air pollution with outpatient visits for respiratory diseases of children in an ex-heavily polluted Northwestern city, China
Yueling Ma, Li Yue, Jiangtao Liu, Xiaotao He, Lanyu Li, Jingping Niu, Bin Luo
BMC Public Health.2020;[Epub] CrossRef - Health Effects of Asian Dust: A Systematic Review and Meta-Analysis
Masahiro Hashizume, Yoonhee Kim, Chris Fook Sheng Ng, Yeonseung Chung, Lina Madaniyazi, Michelle L. Bell, Yue Leon Guo, Haidong Kan, Yasushi Honda, Seung-Muk Yi, Ho Kim, Yuji Nishiwaki
Environmental Health Perspectives.2020;[Epub] CrossRef - Associations between perceived environmental pollution and health-related quality of life in a Chinese adult population
Bingxue Han
Health and Quality of Life Outcomes.2020;[Epub] CrossRef - Associations Between Dust Storms and Intensive Care Unit Admissions in the United States, 2000–2015
C. S. Rublee, C. J. Sorensen, J. Lemery, T. J. Wade, E. A. Sams, E. D. Hilborn, J. L. Crooks
GeoHealth.2020;[Epub] CrossRef - Temporal-spatial variation and environmental risk assessment of pharmaceuticals in tributaries of the Han River watershed, South Korea
Jong Kwon Im, Sang Hun Kim, Hye Ran Noh, Soon Ju Yu
Science of The Total Environment.2020; 741: 140486. CrossRef - Distribution of Viable Bacteria in the Dust-Generating Natural Source Area of the Gobi Region, Mongolia
Katsuro Hagiwara, Tamaki Matsumoto, Purevsuren Tsedendamba, Kenji Baba, Buho Hoshino
Atmosphere.2020; 11(9): 893. CrossRef - Impact of the COVID-19 Outbreak on Air Quality in Korea
Ji Hoon Seo, Hyun Woo Jeon, Ui Jae Sung, Jong-Ryeul Sohn
Atmosphere.2020; 11(10): 1137. CrossRef - Marble Dust Exposure Relationship to Workers‘ Lung Conditions in Marble Industries
Ummul Khoiroh
JURNAL KESEHATAN LINGKUNGAN.2020; 12(4): 285. CrossRef - Association between ambient temperature and chronic obstructive pulmonary disease: a population-based study of the years of life lost
Guijie Luan, Peng Yin, Lijun Wang, Maigeng Zhou
International Journal of Environmental Health Research.2019; 29(3): 246. CrossRef - Influence of Particulate Matter during Seasonal Smog on Quality of Life and Lung Function in Patients with Chronic Obstructive Pulmonary Disease
Chaicharn Pothirat, Warawut Chaiwong, Chalerm Liwsrisakun, Chaiwat Bumroongkit, Athavudh Deesomchok, Theerakorn Theerakittikul, Atikun Limsukon, Pattraporn Tajaroenmuang, Nittaya Phetsuk
International Journal of Environmental Research and Public Health.2019; 16(1): 106. CrossRef - Young mothers’ acceptance of herbal food supplements: Centred on preventive health behaviour for children
Malliga Marimuthu
Journal of Retailing and Consumer Services.2019; 51: 311. CrossRef - Environmental Air Pollution and the Risk of Osteoporosis and Bone Fractures
Vu H. Nguyen
Journal of Preventive Medicine and Public Health.2018; 51(4): 215. CrossRef
 PubReader
 ePub Link
 Cite
Cite