
Articles
- Page Path
- HOME > J Prev Med Public Health > Volume 55(4); 2022 > Article
-
Original Article
Analysis of Differences in Preterm Birth Rates According to Household Occupation in Japan From 2007 to 2019 -
Tasuku Okui
 , Naoki Nakashima
 -
Journal of Preventive Medicine and Public Health 2022;55(4):371-378.
DOI: https://doi.org/10.3961/jpmph.22.178
Published online: June 20, 2022
Medical Information Center, Kyushu University Hospital, Fukuoka, Japan
- Corresponding author: Tasuku Okui, Medical Information Center, Kyushu University Hospital, 3-1-1 Maidashi, Higashi-ku, Fukuoka 812-8582, Japan, E-mail: task10300@gmail.com
• Received: April 16, 2022 • Accepted: June 3, 2022
Copyright © 2022 The Korean Society for Preventive Medicine
This is an Open Access article distributed under the terms of the Creative Commons Attribution Non-Commercial License (https://creativecommons.org/licenses/by-nc/4.0/) which permits unrestricted non-commercial use, distribution, and reproduction in any medium, provided the original work is properly cited.
ABSTRACT
-
Objectives
- No studies have examined the association between preterm birth rates and socioeconomic factors in Japan using nationwide statistical data. We analyzed the association between preterm birth rates and household occupation using Vital Statistics data.
-
Methods
- Aggregated Vital Statistics data from Japan from 2007 to 2019 were obtained from the Ministry of Health, Labour and Welfare. From the data, the number of births according to year, age group, gestational period, number of pregnancies, and household occupation were used in this study. Crude preterm birth rates and preterm birth rates adjusted by maternal age according to household occupation were calculated for each year. Poisson regression analysis was conducted to evaluate the association between household occupation and preterm births.
-
Results
- Unemployed households had the highest preterm birth rate, and households with an occupation classification of “full-time worker 2” (an employee at a large company, civil servant, or board member) had the lowest preterm birth rate throughout each period. Poisson regression analysis revealed that unemployed households were statistically significantly associated with a high preterm birth risk. In contrast, the preterm birth rate adjusted by maternal age remained stable throughout each period regardless of household occupation, and preterm birth rates were found not to have increased in recent years in Japan.
-
Conclusions
- Unemployed households had higher preterm birth rates than other household occupations. Further studies investigating the characteristics of unemployed households are needed to identify the reasons for this disparity.
- Preterm birth is one of several adverse perinatal birth outcomes and has a known association with neonatal mortality or infant mortality [1,2] and adulthood mortality [3]. The global preterm birth rate increased from 9.8% in 2000 to 10.6% in 2014 [4], although trends vary between countries. An increasing trend was observed in China and multiple European countries [5,6], in part due to an increase in multiple pregnancies, among other factors [5]. Japan’s preterm birth rate is known to be relatively low compared to other countries presumably due to the regular prenatal visits provided by local governments in Japan [7]. However, the preterm singleton birth rate has increased over the past several decades in Japan [8,9], with an increase in the rate of cesarean section births having been identified as a factor [9]. This trend is affected by many other factors, and identifying the differences in preterm birth rates according to maternal characteristics is important for understanding this phenomenon.
- Several socioeconomic characteristics have been identified as risk factors for preterm birth [10–13], and disparities based on race and education level have been observed in other countries. Several epidemiological studies have investigated the association between socioeconomic factors and preterm birth rates in Japan [13–15], observing disparities in preterm birth rates according to education level and employment status [13,15]. However, no study has investigated the association between socioeconomic factors and preterm births in Japan using Vital Statistics data. It is crucial to elucidate this association using nationwide data on births in Japan. Household occupation is often used as a socioeconomic factor since it is included in Vital Statistics data from Japan [16,17]. Studies analyzing the trend of infant and perinatal mortality rates using Vital Statistics data in Japan have found that unemployed households had higher rates of infant and perinatal mortality compared to other types of households [16,17], and preterm birth rates might also vary according to household occupation. In addition, the degree to which preterm birth rates increase or decrease according to household occupation is unknown.
- In this study, we examined the differences and trends in preterm birth rates according to household occupation using Vital Statistics data from Japan.
INTRODUCTION
- Data
- Aggregated Vital Statistics data from Japan from 2007 to 2019 were used due to their availability. The data were obtained from the Ministry of Health, Labour and Welfare by requesting a made-to-order aggregation per Japan’s Statistics Act (2007, Article 53). The data contained the number of births by year, age group, gestational period, number of pregnancies, and household occupation. Age groups were classified as <20 years, 20–24 years, 25–29 years, 30–34 years, 40–44 years, 45–49 years, 50–54 years, ≥55 years, and unknown. However, we only used data for the ages of 20–24 years, 25–29 years, 30–34 years, 35–39 years, and 40–44 years due to the relatively low numbers of births in the other age groups. Gestational periods were classified as <28 weeks, 28–31 weeks, 32–36 weeks, 37–41 weeks, ≥42 weeks, and unknown, and any births before 37 gestational weeks were classified as preterm births. The number of pregnancies was classified in terms of singleton or multiple pregnancies; however, we only used data on singleton births, which is consistent with the practices of previous studies [8,9].
- The household occupation categories included farmer, self-employed worker, full-time worker 1, full-time worker 2, other worker, and unemployed. The household occupation referred to the main occupation in a household and was considered to be classified based on the occupation of the household’s highest earner. Unemployed households were defined as households with no employed occupants. “Full-time worker 1” referred to full-time workers at workplaces with fewer than 100 employees, and “full-time worker 2” referred to full-time workers at workplaces with 100 or more employees, civil servants, or board members. “Other workers” included part-time workers and contract employees who were employed for less than a year.
- Anonymized data were obtained from Japan’s Ministry of Health, Labour and Welfare with permission to analyze the data and publish the results. The data were already aggregated by the Ministry of Health, Labour and Welfare and did not include individual information. The results shown in this study were processed and analyzed by the authors and are not statistics published by the Ministry of Health, Labour and Welfare.
- Statistical Analysis
- In the analysis, if the household occupation, maternal age group, or gestational age were unknown, the data for that birth were not used. We calculated the number of births by household occupation for each year. In addition, we calculated preterm birth rates by age group, household occupation, and year. Moreover, crude preterm birth rates and preterm birth rates by household occupation adjusted for maternal age were calculated for each year. When calculating standardized preterm birth rates, the age composition of births across all household occupations in 2007 was used as the standard population.
- Furthermore, Poisson regression analysis was used to evaluate the associations between household occupations and preterm births. The number of preterm births was used as the outcome, and the number of births was used as the offset term. Aggregated birth data on combined household occupation, maternal age group, and year were available, and observations from 390 (13×5×6) combinations of these variables were used in the regression analysis. Age group, year, and household occupation were used as explanatory variables. All statistical analyses were conducted using R version 4.1.3 (R Core Team, Vienna, Austria).
- Ethics Statement
- Aggregated data of the Vital Statistics were used in this study, and an ethical approval for the study was not mandatory.
METHODS
- A total of 12 723 467 births were experienced by mothers aged 20–44 years in the study period. The gestational age for 3317 births was unknown. In addition, the household occupation associated with 437 769 births was unknown. After removing births with missing data, 12 282 797 births were analyzed.
- Table 1 shows the annual number of births by household occupation. The number of births associated with each household occupation decreased over time. The highest number of births each year was associated with a household occupation classification of full-time worker 2, which exceeded 400 000 births for every year in the study period.
- Table 2 shows the preterm birth rate (%) by household occupation, age group, and year. Preterm birth rates were high among older mothers irrespective of household occupation and year, and the rate exceeded 10% for those aged 40–44 years from unemployed households for most of the years included in our analysis. Those aged 25–29 years tended to have the lowest preterm birth rate compared to the other age groups, but the rate still exceeded 5% for mothers aged 25–29 years from unemployed households.
- Figure 1 shows the crude preterm birth rate (%) and the rate adjusted for maternal age by household occupation and year. The crude and standardized preterm birth rates associated with unemployed households were the highest throughout the study period and exceeded 6% in all years. In contrast, the standardized rates associated with the other occupations were all below 5%, and the crude and standardized rates associated with the full-time worker 2 classification were the lowest. Crude preterm birth rates associated with some household occupations increased from 2007 to 2019, whereas the standardized preterm rates remained stable.
- Table 3 shows the result of the Poisson regression analysis. The year was negatively associated with preterm births over time (p<0.001). The risk of preterm births was the lowest among those aged 25–29 years, and the relative risk for those aged 40–44 years compared to those aged 25–29 years was 1.760 (p<0.001). Compared to unemployed households, the relative risks associated with the other household occupations were significantly lower than 1.000. In particular, the relative risk of households with the full-time worker 2 classification compared to those with the unemployed classification was 0.671 (p< 0.001).
RESULTS
- The results show that unemployed households had a higher preterm birth rate than households with other occupation classifications, and full-time worker 2 households had the lowest preterm birth rate. Therefore, household occupation was shown to be associated with the preterm birth rate in Japan. Previous studies using Vital Statistics data also found that unemployed households had the highest risk and full-time worker 2 households had the lowest risk of perinatal and infant mortality [16,17]. A similar phenomenon was also observed for preterm births. Although no studies have investigated the association between household income and household occupations using Vital Statistics data, it can be assumed that unemployed households are more likely to experience poverty due to the lack of work-related income. Unemployment is known to be associated with low socioeconomic status (SES), particularly low education levels [18,19]. In addition, according to Vital Statistics data from 2020, the proportion of legitimate infants among all births in Japan was 97.6% (820 795 of 840 835 births), while that among unemployed households was 46.8% (5875 of 12 542) [20]. Therefore, the proportion of non-legitimate infants is exceptionally high among unemployed households. In other words, the proportion of fatherless households among unemployed households is high. In addition, the proportion of poor households is known to be high among fatherless households in Japan [21–23]. For these reasons, an unemployed household is considered to be an indicator of low SES. In addition, individuals employed at workplaces with at least 100 employees are more likely to earn more than those employed at workplaces with fewer than 100 employees [24]. Therefore, the average income of those with a classification of full-time worker 1 was assumed to be lower than that of those with a classification of full-time worker 2. We discuss below the possible reasons for the association between preterm births and unemployed households in Japan.
- Smoking is a risk factor for preterm birth [25,26]. The smoking rate is known to vary based on SES in Japan. Low SES (low educational level, income, and occupational class) is associated with a higher smoking rate [27,28]. Fatherless and unemployed households are considered to have low incomes since they have a strong association with poverty [21–23]. Therefore, unemployed households with newborns may have a higher smoking rate; however, an epidemiological study is needed to verify this association.
- Prenatal care attendance has also been found to be associated with preterm births in other countries [29,30]. Patient education about rest, early symptom recognition, and timely intervention in cases of worsening maternal diseases obtained through participation in prenatal care is likely a primary factor in this association [29]. While SES is known to be associated with participation in prenatal care in other countries [31,32], this association has not been examined in Japan. Beginning in 2009, medical fees for prenatal care are partially covered by public expenses until the 14th visit [33], and the number of women without prenatal care has subsequently decreased in recent years. However, not all expenses or examinations related to prenatal care are covered by public expenses. In addition, medical fees are not covered after the 14th visit. Therefore, SES can still affect prenatal care utilization. In addition, there may be some differences in knowledge or a negative bias against prenatal care based on household occupation. There may also be differences in medical care utilization related to preexisting diseases according to household occupation. These factors could have affected the high preterm birth rate related to unemployed households.
- Low body mass index (BMI) is another risk factor for preterm birth [13]. Low SES is known to be associated with underweight in other countries [34,35], likely due to the poor nutritional status or depressive symptoms of individuals with a low SES. In Japan, no association between underweight and low SES has been observed [36]. However, a high pre-pregnancy BMI was also shown to be associated with preterm births among Japanese women [37], and overweight status was shown to be associated with a low SES in Japan [36]. Apart from smoking, BMI, and prenatal care utilization, maternal stress is also a risk factor for preterm birth [38]. There is a disparity in psychological distress according to SES in Japan [39].
- The trend in the preterm birth rate remained unchanged irrespective of household occupation, and the standardized rate also remained stable from 2007 to 2019 for all household occupations. In contrast, the crude and standardized preterm birth rates in Japan showed an increasing trend from 1979 to 2014 in a previous study [8] that aggregated data for every 6-year period, and 2009 to 2014 was aggregated as 1 period. Therefore, the change in the rate from 2009 to 2014 was not examined in the previous study [8], and this study found that the standardized rate had not increased since 2007. An increase in the rate of cesarean sections [40] is considered to be a major reason for the increase in preterm birth rates in Japan [9]. Therefore, there is a possibility that the spontaneous preterm birth rate has decreased in recent years since the preterm rate has remained relatively unchanged despite the increase in cesarean sections. Another possibility is that only the number of cesarean sections conducted after 37 gestational weeks is increasing, and the increase in cesarean sections did not contribute to an increase in the preterm birth rate.
- Differences in health behaviors or health status likely affected differences in preterm birth rates depending on the household occupation. Although it might be difficult to eliminate differences in health status according to household occupation, guidance on health behaviors, particularly for unemployed households, may help to reduce this disparity in Japan. Making prenatal care completely free of charge for households with low incomes may also lower the preterm birth rate associated with unemployed households. In addition, publicly incentivizing participation in prenatal care is also needed.
- There are some limitations to this study. First, we obtained aggregated Vital Statistics data from the Ministry of Health, Labour and Welfare, and the factors included in that single aggregated dataset were limited. Therefore, we could not obtain data on factors, such as parity and address in addition to the factors examined in this study. Moreover, we were only able to obtain data from 2007 to 2019, and the trends before 2007 are unknown. A study that includes data on these factors over a long time period will be significant in the future. Moreover, we could not obtain data on the risk factors of preterm birth, such as BMI, education level, smoking, pregnancy complications, and the mother’s chronic diseases since we analyzed the Vital Statistics data. Furthermore, we focused on household occupation as the sole socioeconomic factor in this study. Since no studies have investigated the association between family income or education level and household occupations using Vital Statistics data from Japan, further studies are needed to confirm our hypotheses about the disparity. Nationality is another factor that can be obtained from Vital Statistics data, and a study that includes nationality will also be significant. Third, information on whether preterm births were induced or spontaneous, which affects the association between socioeconomic factors and preterm births, was not available in the Vital Statistics data. Further studies investigating the association in terms of the mode of delivery should also be conducted in Japan. However, the strength of this study is that we used nationwide data from Japan, and the results represent the trends for all of Japan.
- We observed trends in the preterm birth rates according to household occupation in Japan from 2007 to 2019 and analyzed their association using Poisson regression analysis. The results show that unemployed households had the highest preterm birth rate, and households with a classification of full-time worker 2 had the lowest preterm birth rate throughout the study period. Poisson regression analysis revealed that unemployed households were statistically significantly associated with a higher rate of preterm births. In addition, the preterm birth rate adjusted for maternal age did not increase over the study period regardless of household occupation. Further studies should be conducted to investigate the reasons for the high preterm birth rate associated with unemployed households.
DISCUSSION
-
CONFLICT OF INTEREST
The authors have no conflicts of interest associated with the material presented in this paper.
-
FUNDING
This work was supported by JSPS KAKENHI grant No. 22K- 17372.
Notes
ACKNOWLEDGEMENTS
-
AUTHOR CONTRIBUTIONS
Both authors contributed equally to conceiving the study, analyzing the data, and writing this paper.
Notes
Figure 1(A) Crude preterm birth rates (%) and (B) rates adjusted for maternal age by household occupation and year. 1Full-time worker 1 refers to full-time workers at companies with fewer than 100 employees. 2Full-time worker 2 refers to full-time workers at a large company, civil servants, and board members.
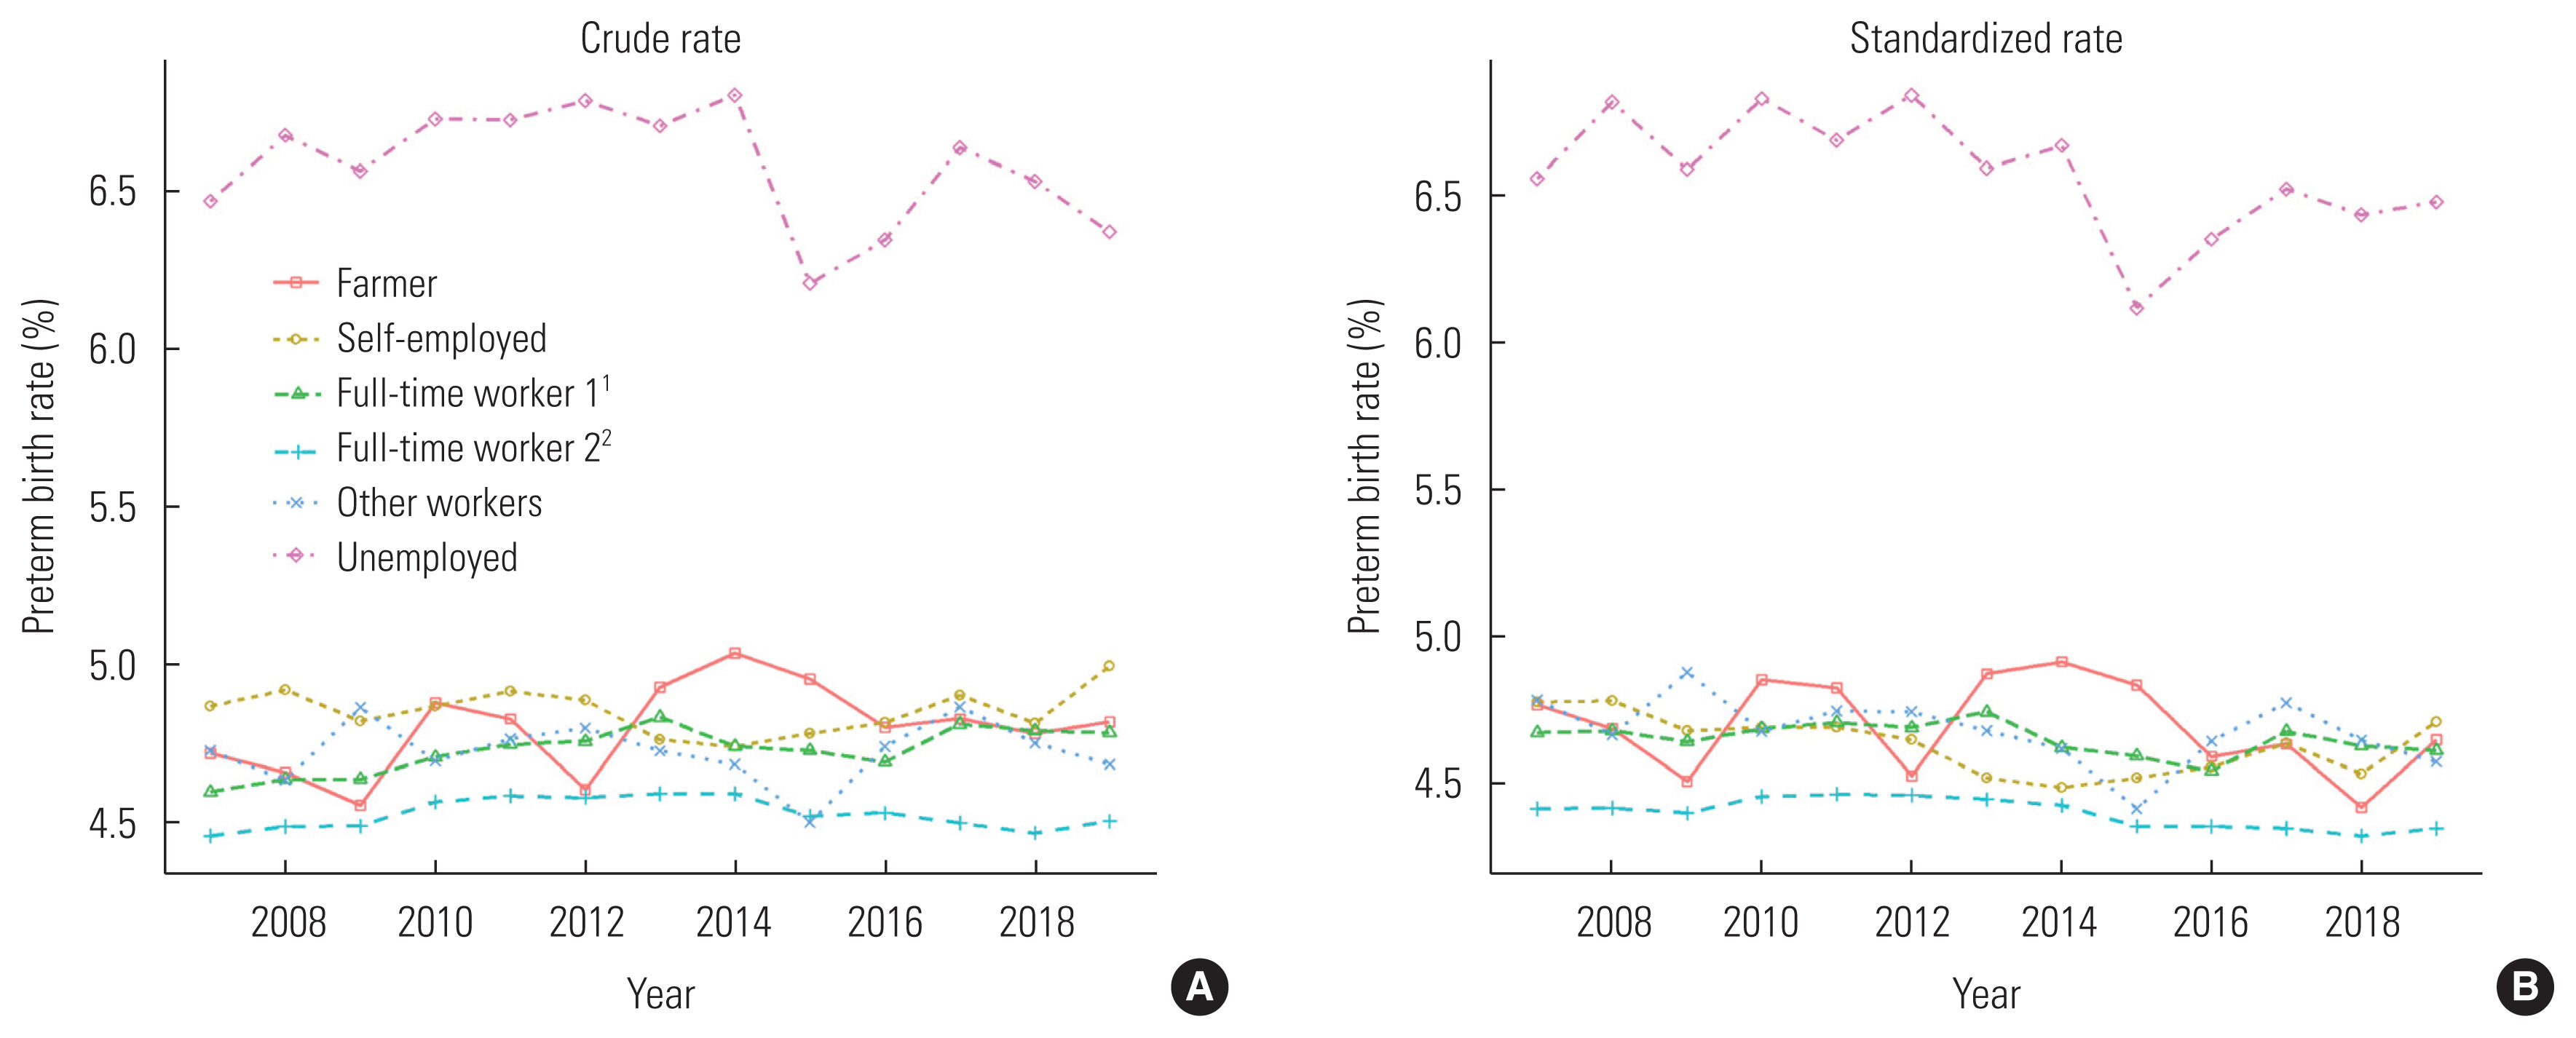
Table 1Annual numbers of births by household occupation
| Year | Household occupation, n | |||||
|---|---|---|---|---|---|---|
| Farmer | Self-employed | Full-time worker 11 | Full-time worker 22 | Other worker | Unemployed | |
| 2007 | 19 895 | 81 632 | 373 173 | 424 171 | 91 472 | 19 408 |
| 2008 | 18 649 | 80 786 | 369 947 | 432 548 | 88 809 | 19 270 |
| 2009 | 18 018 | 76 964 | 360 363 | 428 088 | 88 182 | 20 685 |
| 2010 | 17 845 | 76 397 | 361 286 | 436 347 | 92 741 | 21 886 |
| 2011 | 16 193 | 72 880 | 353 464 | 430 716 | 89 436 | 20 411 |
| 2012 | 15 026 | 71 688 | 342 768 | 431 092 | 88 088 | 19 005 |
| 2013 | 14 198 | 71 535 | 336 010 | 435 790 | 85 303 | 17 411 |
| 2014 | 13 162 | 69 857 | 322 974 | 430 559 | 81 473 | 16 164 |
| 2015 | 12 734 | 69 331 | 323 473 | 446 204 | 81 252 | 16 699 |
| 2016 | 11 579 | 67 079 | 308 976 | 436 390 | 77 400 | 15 092 |
| 2017 | 10 788 | 63 820 | 293 077 | 431 803 | 72 562 | 13 723 |
| 2018 | 9972 | 60 801 | 281 555 | 423 117 | 71 187 | 12 398 |
| 2019 | 8736 | 57 248 | 259 752 | 400 801 | 70 202 | 11 281 |
Table 2Preterm birth rate (%) by household occupation, age group, and year
| Household occupation and age group (y) | 2007 | 2008 | 2009 | 2010 | 2011 | 2012 | 2013 | 2014 | 2015 | 2016 | 2017 | 2018 | 2019 |
|---|---|---|---|---|---|---|---|---|---|---|---|---|---|
| Farmer | |||||||||||||
| 20–24 | 4.22 | 4.64 | 4.82 | 4.07 | 3.72 | 4.51 | 4.91 | 3.68 | 4.86 | 4.27 | 3.95 | 3.02 | 4.37 |
| 25–29 | 4.33 | 3.74 | 4.23 | 4.31 | 4.04 | 3.31 | 4.13 | 4.43 | 3.87 | 3.90 | 3.78 | 3.72 | 3.94 |
| 30–34 | 4.57 | 4.75 | 4.00 | 4.46 | 4.96 | 4.26 | 4.94 | 5.11 | 4.89 | 4.45 | 4.89 | 4.52 | 4.87 |
| 35–39 | 5.87 | 5.73 | 5.48 | 6.56 | 6.28 | 7.00 | 5.78 | 5.73 | 6.18 | 5.95 | 5.84 | 5.81 | 5.39 |
| 40–44 | 8.37 | 8.51 | 7.74 | 9.84 | 7.66 | 6.27 | 6.58 | 8.05 | 6.38 | 7.51 | 5.97 | 8.46 | 6.01 |
|
|
|||||||||||||
| Self-employed | |||||||||||||
| 20–24 | 4.10 | 4.18 | 4.17 | 4.00 | 3.98 | 4.46 | 4.30 | 4.09 | 4.53 | 4.41 | 4.38 | 4.25 | 4.49 |
| 25–29 | 4.28 | 4.19 | 4.20 | 4.27 | 3.97 | 3.89 | 3.98 | 4.06 | 3.99 | 4.09 | 4.12 | 4.13 | 4.15 |
| 30–34 | 4.63 | 4.66 | 4.60 | 4.64 | 4.77 | 4.61 | 4.45 | 4.36 | 4.39 | 4.43 | 4.61 | 4.42 | 4.64 |
| 35–39 | 6.05 | 6.03 | 5.69 | 5.60 | 5.90 | 5.87 | 5.38 | 5.46 | 5.39 | 5.48 | 5.51 | 5.37 | 5.74 |
| 40–44 | 7.78 | 8.36 | 7.22 | 7.84 | 7.36 | 7.07 | 7.37 | 6.87 | 7.00 | 6.57 | 6.74 | 6.97 | 6.59 |
|
|
|||||||||||||
| Full-time worker 11 | |||||||||||||
| 20–24 | 4.09 | 4.17 | 4.13 | 4.29 | 4.14 | 4.13 | 4.28 | 4.28 | 4.08 | 3.96 | 4.26 | 4.28 | 4.12 |
| 25–29 | 4.02 | 3.99 | 4.12 | 4.16 | 4.17 | 4.09 | 4.20 | 4.14 | 4.02 | 3.95 | 4.07 | 4.06 | 4.16 |
| 30–34 | 4.61 | 4.59 | 4.54 | 4.61 | 4.68 | 4.71 | 4.75 | 4.52 | 4.59 | 4.55 | 4.72 | 4.62 | 4.52 |
| 35–39 | 5.91 | 5.94 | 5.72 | 5.65 | 5.72 | 5.73 | 5.66 | 5.57 | 5.60 | 5.65 | 5.68 | 5.52 | 5.57 |
| 40–44 | 8.02 | 8.42 | 7.70 | 7.68 | 7.48 | 7.30 | 7.35 | 7.34 | 7.21 | 6.98 | 6.53 | 7.34 | 7.35 |
|
|
|||||||||||||
| Full-time worker 22 | |||||||||||||
| 20–24 | 4.00 | 3.94 | 3.91 | 4.03 | 4.05 | 4.19 | 4.23 | 4.00 | 4.12 | 3.84 | 4.12 | 4.03 | 4.19 |
| 25–29 | 3.93 | 3.90 | 4.05 | 3.96 | 3.93 | 4.01 | 3.95 | 3.94 | 3.78 | 3.89 | 3.91 | 3.90 | 3.81 |
| 30–34 | 4.40 | 4.37 | 4.25 | 4.41 | 4.45 | 4.41 | 4.34 | 4.38 | 4.32 | 4.36 | 4.30 | 4.26 | 4.27 |
| 35–39 | 5.25 | 5.39 | 5.35 | 5.34 | 5.40 | 5.22 | 5.40 | 5.39 | 5.29 | 5.21 | 5.07 | 5.14 | 5.28 |
| 40–44 | 6.85 | 7.20 | 6.95 | 7.15 | 6.82 | 6.74 | 6.71 | 6.57 | 6.58 | 6.54 | 6.73 | 6.30 | 6.41 |
|
|
|||||||||||||
| Other worker | |||||||||||||
| 20–24 | 4.14 | 4.16 | 4.22 | 3.86 | 4.25 | 4.78 | 3.93 | 4.36 | 4.41 | 4.07 | 4.88 | 4.25 | 4.06 |
| 25–29 | 4.30 | 4.11 | 4.30 | 4.24 | 4.10 | 4.10 | 4.18 | 4.09 | 3.90 | 4.00 | 4.29 | 4.08 | 4.08 |
| 30–34 | 4.69 | 4.56 | 4.86 | 4.51 | 4.72 | 4.51 | 4.74 | 4.50 | 4.22 | 4.74 | 4.58 | 4.60 | 4.44 |
| 35–39 | 5.77 | 5.67 | 5.90 | 5.84 | 5.87 | 5.97 | 5.58 | 5.69 | 5.36 | 5.56 | 5.64 | 5.71 | 5.75 |
| 40–44 | 8.60 | 8.64 | 8.57 | 8.62 | 7.78 | 7.69 | 7.30 | 6.74 | 7.33 | 7.52 | 7.34 | 7.10 | 7.14 |
|
|
|||||||||||||
| Unemployed | |||||||||||||
| 20–24 | 5.32 | 5.21 | 5.36 | 5.25 | 5.80 | 5.05 | 6.22 | 6.01 | 5.14 | 5.09 | 6.26 | 5.47 | 5.43 |
| 25–29 | 5.57 | 5.56 | 6.34 | 5.61 | 5.65 | 5.74 | 5.58 | 5.81 | 5.32 | 5.92 | 5.72 | 5.48 | 5.13 |
| 30–34 | 6.20 | 7.08 | 6.20 | 7.06 | 6.52 | 7.16 | 6.77 | 6.65 | 6.02 | 6.29 | 6.44 | 6.23 | 7.15 |
| 35–39 | 9.56 | 9.08 | 8.25 | 9.09 | 9.01 | 8.65 | 7.71 | 8.09 | 7.74 | 7.61 | 8.06 | 8.72 | 7.79 |
| 40–44 | 9.53 | 10.56 | 10.47 | 10.47 | 10.65 | 11.84 | 10.71 | 11.47 | 11.17 | 10.24 | 8.55 | 10.51 | 8.74 |
Table 3Results of Poisson regression analysis
| Variables | RR (95% CI) | p-value |
|---|---|---|
| Year | 0.998 (0.997, 0.998) | <0.001 |
|
|
||
| Age (y) | ||
| 20–24 | 1.019 (1.008, 1.029) | <0.001 |
| 25–29 | 1.000 (reference) | |
| 30–34 | 1.119 (1.111, 1.126) | <0.001 |
| 35–39 | 1.374 (1.364, 1.385) | <0.001 |
| 40–44 | 1.760 (1.739, 1.780) | <0.001 |
|
|
||
| Household occupation | ||
| Unemployed | 1.000 (reference) | |
| Farmer | 0.721 (0.702, 0.740) | <0.001 |
| Self-employed | 0.708 (0.695, 0.721) | <0.001 |
| Full-time worker 11 | 0.711 (0.699, 0.723) | <0.001 |
| Full-time worker 22 | 0.671 (0.660, 0.682) | <0.001 |
| Other worker | 0.716 (0.703, 0.730) | <0.001 |
- 1. Zou L, Wang X, Ruan Y, Li G, Chen Y, Zhang W. Preterm birth and neonatal mortality in China in 2011. Int J Gynaecol Obstet 2014;127(3):243-247ArticlePubMedPDF
- 2. Callaghan WM, MacDorman MF, Rasmussen SA, Qin C, Lackritz EM. The contribution of preterm birth to infant mortality rates in the United States. Pediatrics 2006;118(4):1566-1573ArticlePubMedPDF
- 3. Crump C. Preterm birth and mortality in adulthood: a systematic review. J Perinatol 2020;40(6):833-843ArticlePubMedPMCPDF
- 4. Zeitlin J, Szamotulska K, Drewniak N, Mohangoo AD, Chalmers J, Sakkeus L, et al. Preterm birth time trends in Europe: a study of 19 countries. BJOG 2013;120(11):1356-1365ArticlePubMedPMCPDF
- 5. Ma R, Luo Y, Wang J, Zhou Y, Sun H, Ren X, et al. Ten-year time trends in preterm birth during a sociodemographic transition period: a retrospective cohort study in Shenzhen, China. BMJ Open 2020;10(10):e037266ArticlePubMedPMC
- 6. Chawanpaiboon S, Vogel JP, Moller AB, Lumbiganon P, Petzold M, Hogan D, et al. Global, regional, and national estimates of levels of preterm birth in 2014: a systematic review and modelling analysis. Lancet Glob Health 2019;7(1):e37-e46ArticlePubMed
- 7. Isayama T. The clinical management and outcomes of extremely preterm infants in Japan: past, present, and future. Transl Pediatr 2019;8(3):199-211ArticlePubMedPMC
- 8. Sakata S, Konishi S, Ng CF, Watanabe C. Preterm birth rates in Japan from 1979 to 2014: analysis of national vital statistics. J Obstet Gynaecol Res 2018;44(3):390-396ArticlePubMedPDF
- 9. Yorifuji T, Naruse H, Kashima S, Murakoshi T, Kato T, Inoue S, et al. Trends of preterm birth and low birth weight in Japan: a one hospital-based study. BMC Pregnancy Childbirth 2012;12: 162ArticlePubMedPMCPDF
- 10. Thoma ME, Drew LB, Hirai AH, Kim TY, Fenelon A, Shenassa ED. Black-White disparities in preterm birth: geographic, social, and health determinants. Am J Prev Med 2019;57(5):675-686ArticlePubMed
- 11. Kramer MR, Hogue CR. Place matters: variation in the black/white very preterm birth rate across U.S. metropolitan areas, 2002–2004. Public Health Rep 2008;123(5):576-585ArticlePubMedPMCPDF
- 12. Ruiz M, Goldblatt P, Morrison J, Kukla L, Švancara J, Riitta-Järvelin M, et al. Mother’s education and the risk of preterm and small for gestational age birth: a DRIVERS meta-analysis of 12 European cohorts. J Epidemiol Community Health 2015;69(9):826-833ArticlePubMedPMC
- 13. Tamura N, Hanaoka T, Ito K, Araki A, Miyashita C, Ito S, et al. Different risk factors for very low birth weight, term-small-for-gestational-age, or preterm birth in Japan. Int J Environ Res Public Health 2018;15(2):369ArticlePubMedPMC
- 14. Fujiwara T, Ito J, Kawachi I. Income inequality, parental socioeconomic status, and birth outcomes in Japan. Am J Epidemiol 2013;177(10):1042-1052ArticlePubMed
- 15. Shiozaki A, Yoneda S, Nakabayashi M, Takeda Y, Takeda S, Sugimura M, et al. Multiple pregnancy, short cervix, part-time worker, steroid use, low educational level and male fetus are risk factors for preterm birth in Japan: a multicenter, prospective study. J Obstet Gynaecol Res 2014;40(1):53-61ArticlePubMedPDF
- 16. Sugai MK, Gilmour S, Ota E, Shibuya K. Trends in perinatal mortality and its risk factors in Japan: analysis of vital registration data, 1979–2010. Sci Rep 2017;7: 46681ArticlePubMedPMCPDF
- 17. Kanamori M, Kondo N, Nakamura Y. Infant mortality rates for farming and unemployed households in the Japanese prefectures: an ecological time trend analysis, 1999–2017. J Epidemiol 2021;31(1):43-51ArticlePubMedPMC
- 18. van Zon SK, Reijneveld SA, Mendes de Leon CF, Bültmann U. The impact of low education and poor health on unemployment varies by work life stage. Int J Public Health 2017;62(9):997-1006ArticlePubMedPMCPDF
- 19. Doku DT, Acacio-Claro PJ, Koivusilta L, Rimpelä A. Health and socioeconomic circumstances over three generations as predictors of youth unemployment trajectories. Eur J Public Health 2019;29(3):517-523ArticlePubMedPMC
- 20. Portal Site of Official Statistics of Japan. Vital Statistics; [cited 2022 May 28]. Available from: https://www.e-stat.go.jp/stat-search/files?page=1&toukei=00450011
- 21. Nakata K. Single mother’s poverty and the effects of government’s policy. Setsunan Econ Rev 2018;8(1–2):49-60. (Japanese)
- 22. Tama Y. Unwed mothers and their agenda in Japan. Womens Stud Rev 2018;25: 66-81. (Japanese)
- 23. Ohshio M. Poverty among women: current state and issues in Japan. Jpn J Hum Welf Stud 2017;10(1):37-51. (Japanese)
- 24. Ministry of Health, Labour and Welfare of Japan. Overview of the basic survey on wage structure in the second year of Reiwa era; [cited 2022 May 26]. Available from: https://www.mhlw.go.jp/toukei/itiran/roudou/chingin/kouzou/z2020/dl/13.pdf (Japanese)
- 25. Stock SJ, Bauld L. Maternal smoking and preterm birth: an unresolved health challenge. PLoS Med 2020;17(9):e1003386ArticlePubMedPMC
- 26. Soneji S, Beltrán-Sánchez H. Association of maternal cigarette smoking and smoking cessation with preterm birth. JAMA Netw Open 2019;2(4):e192514ArticlePubMedPMC
- 27. Fukuda Y, Nakamura K, Takano T. Accumulation of health risk behaviours is associated with lower socioeconomic status and women’s urban residence: a multilevel analysis in Japan. BMC Public Health 2005;5: 53ArticlePubMedPMCPDF
- 28. Tanaka H, Mackenbach JP, Kobayashi Y. Widening socioeconomic inequalities in smoking in Japan, 2001–2016. J Epidemiol 2021;31(6):369-377ArticlePubMedPMC
- 29. Vintzileos AM, Ananth CV, Smulian JC, Scorza WE, Knuppel RA. The impact of prenatal care in the United States on preterm births in the presence and absence of antenatal high-risk conditions. Am J Obstet Gynecol 2002;187(5):1254-1257ArticlePubMed
- 30. Pervin J, Rahman SM, Rahman M, Aktar S, Rahman A. Association between antenatal care visit and preterm birth: a cohort study in rural Bangladesh. BMJ Open 2020;10(7):e036699ArticlePubMedPMC
- 31. Daniels P, Noe GF, Mayberry R. Barriers to prenatal care among Black women of low socioeconomic status. Am J Health Behav 2006;30(2):188-198ArticlePubMed
- 32. Milcent C, Zbiri S. Prenatal care and socioeconomic status: effect on cesarean delivery. Health Econ Rev 2018;8(1):7ArticlePubMedPMCPDF
- 33. Nakano R, Sato T, Iso H. An ecological study for public subsidies in prenatal checkups and maternal and child health. J Health Welf Stat 2015;62(6):10-15. (Japanese)
- 34. Noh JW, Kim YE, Park J, Oh IH, Kwon YD. Impact of parental socioeconomic status on childhood and adolescent overweight and underweight in Korea. J Epidemiol 2014;24(3):221-229ArticlePubMedPMC
- 35. Rai A, Gurung S, Thapa S, Saville NM. Correlates and inequality of underweight and overweight among women of reproductive age: evidence from the 2016 Nepal Demographic Health Survey. PLoS One 2019;14(5):e0216644ArticlePubMedPMC
- 36. Nakamura T, Nakamura Y, Saitoh S, Okamura T, Yanagita M, Yoshita K, et al. Relationship between socioeconomic status and the prevalence of underweight, overweight or obesity in a general Japanese population: NIPPON DATA2010. J Epidemiol 2018;28(Suppl 3):S10-S16ArticlePubMedPMC
- 37. Toma R, Aoki S, Fujiwara K, Hirahara F. Associations of pre-pregnancy obesity with adverse pregnancy outcomes and the optimal gestational weight gain in Japanese women. Clin Exp Obstet Gynecol 2017;44(2):190-194ArticlePubMed
- 38. Cobo T, Kacerovsky M, Jacobsson B. Risk factors for spontaneous preterm delivery. Int J Gynaecol Obstet 2020;150(1):17-23ArticlePubMedPMCPDF
- 39. Fukuda Y, Hiyoshi A. Influences of income and employment on psychological distress and depression treatment in Japanese adults. Environ Health Prev Med 2012;17(1):10-17ArticlePubMedPMCPDF
- 40. Ministry of Health, Labour and Welfare of Japan. Overview of the survey of medical institutions and the hospital report; 2017 [cited 2022 Apr 16]. Available from: https://www.mhlw.go.jp/toukei/saikin/hw/iryosd/17/dl/09gaikyo29.pdf (Japanese)
REFERENCES
Figure & Data
References
Citations
Citations to this article as recorded by 
- Analysis of an Association between Preterm Birth and Parental Educational Level in Japan Using National Data
Tasuku Okui
Children.2023; 10(2): 342. CrossRef - Association of maternal nationality with preterm birth and low birth weight rates: analysis of nationwide data in Japan from 2016 to 2020
Tasuku Okui, Yoko Sato, Seiichi Morokuma, Naoki Nakashima
Maternal Health, Neonatology and Perinatology.2023;[Epub] CrossRef - Does the father’s job matter? Parental occupation and preterm birth in Korea
Taemi Kim, Eunseon Gwak, Bolormaa Erdenetuya, Jeong-Won Oh, Jung-won Yoon, Myoung-Hee Kim, Jia Ryu, Seung-Ah Choe
Epidemiology and Health.2023; 45: e2023078. CrossRef
 PubReader
 ePub Link
 Cite
Cite

