Social Network Characteristics and Body Mass Index in an Elderly Korean Population
Article information
Abstract
Objectives
Research has shown that obesity appears to spread through social ties. However, the association between other characteristics of social networks and obesity is unclear. This study aimed to identify the association between social network characteristics and body mass index (BMI, kg/m2) in an elderly Korean population.
Methods
This cross-sectional study analyzed data from 657 Koreans (273 men, 384 women) aged 60 years or older who participated in the Korean Social Life, Health, and Aging Project. Network size is a count of the number of friends. Density of communication network is the number of connections in the social network reported as a fraction of the total links possible in the personal (ego-centric) network. Average frequency of communication (or meeting) measures how often network members communicate (or meet) each other. The association of each social network measure with BMI was investigated by multiple linear regression analysis.
Results
After adjusting for potential confounders, the men with lower density (<0.71) and higher network size (4-6) had the higher BMI (β=1.089, p=0.037) compared to the men with higher density (>0.83) and lower size (1-2), but not in the women (p=0.393). The lowest tertile of communication frequency was associated with higher BMI in the women (β=0.885, p=0.049), but not in the men (p=0.140).
Conclusions
Our study suggests that social network structure (network size and density) and activation (communication frequency and meeting frequency) are associated with obesity among the elderly. There may also be gender differences in this association.
INTRODUCTION
The study of the effects of social networks on health rose to the surface in the 1970s through pioneers such as Cassel, Cobb, and Berkman, who theorized or proved empirically that social networks could affect mortality [1-6]. After those mortality studies, several studies have reported that social networks are related to infectious diseases, such as sexually transmitted disease [7-9], tuberculosis [10], severe acute respiratory syndrome [11], and pneumonia [12]. Additionally, evidence suggests that emotions and related behaviors such as depression [13], suicide [14], and happiness [15] are also associated with social networks. Social networks affect health through several mechanisms, including the provision of social support (both perceived and actual), social influence (e.g., norms, social control), social engagement, person-to-person contact (e.g., pathogen exposure, secondhand cigarette smoke), and access to resources (e.g., money, jobs, information) [16].
Obesity is a well-known risk factor for cardiovascular diseases [6]. Adipose tissue has been recognized as an active endocrine organ, capable of releasing many cytokines that play parts in the pathogenesis of many obesity-related diseases [17]. Social network assessment over 32 years in the Framingham Heart Study found that obesity tended to spread through intimate friends [18]. It found that an individual chances of being obese increased by 57% if she or he had a friend who also be obese. Additionally, the evidence for influence of friends on body weight comes from other studies examining the relationships between the weight of individuals and their friends [19-23]. These studies tested the relationship between the body mass index (BMI, kg/m2) of individuals and their friends in order to address the peer effect.
It is known that obesity appears to spread through social ties. However, the association between other characteristics of social networks and obesity is unclear. Thus, we investigated whether social network characteristics such as network size, density of communication network, average frequency of communication, and average frequency of meeting were associated with BMI in an elderly Korean population.
METHODS
The Korean Social Life, Health, and Aging Project (KSHAP) conducted a social network survey and health examination from November 2011 through July 2012 among 860 community-dwelling adults aged 60 or older and their spouses living in Yangsa-myeon, Ganghwa-gun, Incheon, Korea. The institutional review board of Yonsei University approved this study (YUIRB-2011-012-01) and informed consent was obtained from all of the participants. A total of 814 people responded to the social network survey (response rate 94.7%). Potentially confounding factors were assessed as well, including age, education, smoking status (never or ever smoker), alcohol drinking status (non-drinker or drinker), depression score (Center for Epidemiologic Studies-Depression Scale, CES-D), and self-reported comorbidity (hypertension, diabetes, stroke, and arthritis). Among them, 657 participants (80.7%) were examined for height and weight in a public health center or at home. BMI was calculated from measured weight and height.
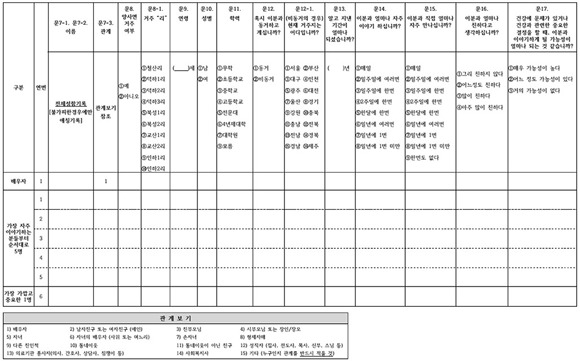
In order to collect social network data, KSHAP adopted a model similar to that of the National Social Life, Health, and Aging Project (NSHAP) [24]. On 'Social network card I' (Appendix 1), a respondent (ego) was asked questions about three types of alters: their spouse (roster A), a maximum of five people with whom the respondents discussed things that were important to them (roster B), and someone to whom the respondents felt especially close (roster C). On 'Social network card II' (Appendix 2), the respondent answered questions about the relationships among alters listed on the rosters, and this information was used to build up egocentric network variables. The difference between egocentric data and common survey questions is that egocentric questionnaires collect data on the characteristics of the persons named, that is, on the respondent's personal network. The additional network information provides some insight into personal network characteristics and their potential influence on behavior [25].
Social network characteristics are composed of network structure (network size, density, etc.) and network activation (frequency of nonvisual contact, frequency of face-to-face interaction, etc.) [16,26]. The following are the four social network measures we used.
Network Size
The egocentric network was composed of rosters A and B. Network size was simply a count of the number of alters provided in response to questions on 'Social network card I.'
Density of Communication Network
KSHAP data can be used to construct a personal (ego-centric) network density variable that reflects the extent to which someone's closest contacts are connected to one another. Density of communication network (or density) is calculated as:

Node nj and nk represent the adjoined nodes connected to node ni and 'e' represents the number of adjoined nodes connected to ni. If node nj and nk are connected, d(nj, nk) becomes 1 and if not, it becomes 0. After summing and dividing by every possible number of connections between adjoined nodes, this becomes the density of the communication network. Figure 1 shows examples of various personal network densities.
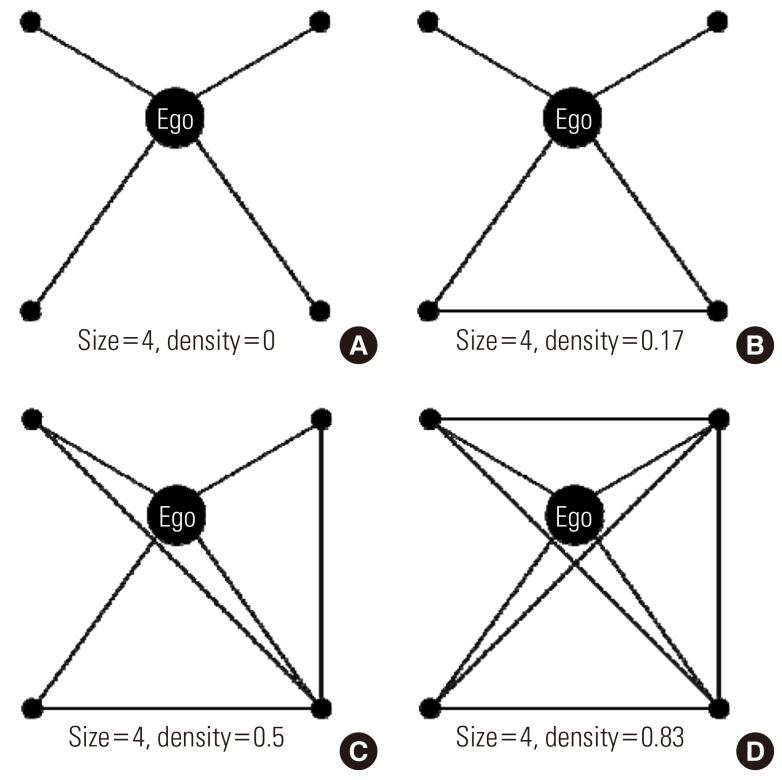
Personal network density. (A-D) According to the connections among friends (alters), it is possible that personal (egocentric [Ego]) social networks with same size have different kinds of densities. size, network size; density, density of communication network.
Average Frequency of Communication and Meeting
Respondents were asked to rate how often they talked to each network member on an 8-point scale, ranging from 'everyday' to 'less than once per year'. The scores were coded by assigning the approximate number of times per year egos interacted with alters (e.g., 'everyday'=365; 'once a month'=12) and the scores were summed across all alters on roster A and roster B to obtain a measure of the overall volume of contact with network members. Then, the scores were summed and divided by the network size. The average frequency of communication (or "communication frequency") indicates how often network members communicated. The average frequency of meeting (or "meeting frequency") was likewise calculated to determine how often network members met.
Statistical Analysis
All analyses were performed separately for the men and women. To gain information on the distribution of the continuous variables (age, depression score, BMI, network size, density of communication network, and average frequency of communication and meeting), we drew a histogram and calculated the minimum, lower quartile, median, upper quartile, maximum, and mean values. In order to solve the problem of non-normal distribution, we used two approaches before multiple linear regression analyses. One was the rank transformation approach and the other was the tertile method. The Spearman correlation test was used to examine the possibility of multicollinearity among social network measures. Network size and density were strongly and inversely correlated in the men (Spearman correlation coefficient (rs)=-0.98, p<0.001) and women (rs=-0.97, p<0.001). We created three groups of social network structure: 'higher density (>0.83) and lower size (1-2)', 'middle density (0.71-0.83) and size (3)', and 'lower density (<0.71) and higher size (4-6)' (Appendix 3). Before the regression analysis, unclassified individuals (3 men and 8 women) were removed. For univariate analysis, the trend test was used. For the continuous variables, p-values were calculated by using a contrast to test for a linear trend. For the categorical variables, the Cochran-Armitage test was used. Multiple linear regression analyses were performed to assess the linear relationship between each of the social network measures and BMI. In the matter of network activation, communication frequency was more significant than meeting frequency from the aforementioned analyses. Lastly, both the group of social network structure (density and size) and communication frequency were included in the multiple regression model. All statistical tests were performed with SAS version 9.2 (SAS Inc., Cary, NC, USA). All analyses were two-sided and p-values <0.05 were regarded as statistically significant.
RESULTS
The characteristics of the study population are summarized in Table 1. We assessed the linear trends between the social network measures and BMI (Appendices 4-6). The group of social network structure and communication frequency were significantly associated with BMI in both the men and women. However, meeting frequency was only significant in the women.

Characteristics of the study population
Multiple linear regression analyses were performed to assess the relationship between each social network measure and BMI (Table 2). As regards network structure, rank-transformed network size and density were only associated with the men's BMI in model 3, while the group of network structure was significantly associated with BMI among all of the models in the men. The men with lower density and higher size had a higher BMI (β=1.253, p=0.014) than the men with higher density and lower size, while the men with middle density and size also had a higher BMI (β=1.022, p=0.044) compared with the reference group. We did not observe a significant association between network structure and BMI in the women. As regards network activation, communication frequency was significantly associated with the women's BMI among all of the models. The association between rank-transformed meeting frequency and the women's BMI was significant, but the tertile of meeting frequency was only associated in model 3. We did not observe such an association between network activation and BMI in the men.
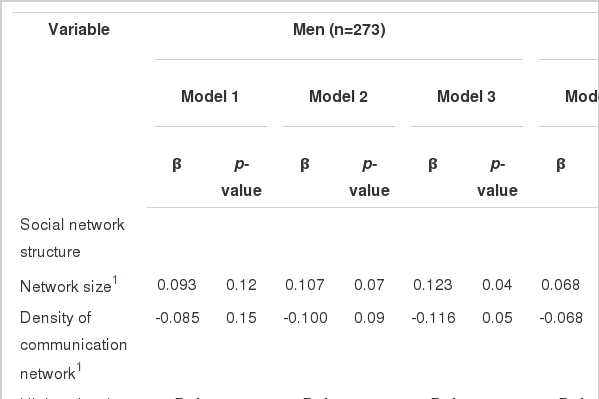
Social network measures and body mass index: multiple linear regression
The group of social network structure and the communication frequency as an index of network activation were further analyzed for the association with BMI in the men and women (Table 3). After adjusting for age, education, smoking, alcohol drinking, depression score, comorbidity (hypertension, diabetes, stroke, and arthritis), and communication frequency, the men with lower density (<0.71) and higher size (4-6) had a higher BMI (β=1.089, p=0.037) than the men with higher density (>0.83) and lower size (1-2), but this was not the case in the women (β=0.391, p=0.393). In contrast, after adjusting for potential confounders and social network structure, the lower tertile of communication frequency was associated with a higher BMI in the women (β=0.885, p=0.049), but not in the men (β=0.702, p=0.140). In the women, less education was prominently related with a higher BMI among potential confounders.

Social network characteristics and body mass index: multiple linear regression
DISCUSSION
The present study examined the association between social network measures and BMI in an elderly Korean population. The men with a sparse and large communication network had a higher BMI compared with the men embedded in dense and small communication networks. The women in networks with a low frequency of communication had a higher BMI than the women in networks with a high frequency of communication.
Social contacts can promote, discourage, and sanction attitudes and behaviors [27,28]. Social contacts may influence participation in organized sports [29], dieting [30], and food choices [31]. A study has linked unhealthy weight-control behaviors among adolescent girls to the dieting behaviors of their peers [32]. We found that the men's BMI was more strongly associated with network structure, that is, network size and density, than communication frequency as an index of network activation. KSHAP data from a restricted rural area had a simpler network structure than the NSHAP data because the NSHAP study population was a nationally representative sample [24]. Almost the entire KSHAP study population existed in three of the nine possible density and size groups. Therefore, it was difficult to discriminate statistically the effect of density from the association between social network structure and BMI, because network size and density were strongly correlated. We postulate a possible explanation for the association between network structure and the men's BMI. Dense personal networks provide reinforcement for prevailing norms and practices and can provide protection from outside sources of influence or risk [25]. The greater the density, the more likely a network is to be considered a cohesive community, a source of social support, and an effective transmitter [33]. By contrast, the women's BMI was more strongly associated with network activation such as communication frequency than network structure. In the women, education was prominently related with BMI among potential confounders, such that more advanced education correlated with lower BMI. The well-educated have a healthier lifestyle [34]. They are more likely to exercise, less likely to smoke, and more likely to drink moderately rather than abstain or drink heavily. It could be inferred that individual attributes such as education level may be most important in determining women's BMI. A previous study explained possible reasons for gender differences in factors associated with BMI [35]. Social contact among friends may be qualitatively different for the men and women in relation to how they affect health behavior. Although not statistically significant in interaction terms (social network measures by gender), β-coefficient estimates that are markedly different from each other suggest the possibility of true interaction between gender and social network characteristics [36].
Previous studies have been mainly interested in the peer effect on obesity. There have been few reports about the association between other characteristics of social networks and obesity. Our findings were not definite, but might illuminate the novel association between social network structure or activation and BMI.
This study has several limitations. First, because of the cross-sectional design, this study could not establish a temporal relationship between BMI and social network characteristics. Second, the survey data were open to measurement error. In particular, the reported relationships among alters might differ from actual relationships. It is important to determine not only the association between an ego's health behavior and an actual social network, but the perceived social network as well. Third, we assumed an inverse linear relationship between BMI and health. However, an increased risk of death has been observed to be associated with a low BMI in other studies [37,38]. Inadequate or incomplete control for confounding or reverse-causation bias could in part explain the increased risk [39]. A low BMI can be an indicator of certain other chronic medical conditions [40]. We adjusted for comorbidities, such as hypertension, diabetes, stroke, and arthritis, in order to overcome this unintended effect. This study population was dwelling in the community, not institutions, and they completely responded to the long survey (mean response time: 70 minutes). It can thus be concluded that they were not unhealthy enough to induce a reverse-causation bias. Fourth, the questionnaires did not measure diet and physical activity. These factors are determinants for obesity, and taking them into account may be necessary to identify the behavioral process (indirect effect) of social networks on BMI [26]. We could not distinguish behavioral processes from psychological processes in this study. Fifth, external validity could be limited because all of the subjects in the study population resided in a single rural community. Accordingly, further longitudinal studies in urban and rural areas are needed.
Our study suggests that social network structure (network size and density) and activation (communication frequency and meeting frequency) are associated with obesity among the elderly. Lower density of communication network and higher network size may be associated with higher BMI in men, while lower frequency of communication may be associated with higher BMI in women.
ACKNOWLEDGEMENTS
This study was supported by the National Research Foundation of Korea Grant funded by the Korean Government (NRF-2011-330-B00137).
Notes
The authors have no conflicts of interest with the material presented in this paper.
Appendices
Appendix 1
Social network card I.
Appendix 2
Social network card II.


