Cardiovascular Health Metrics and All-cause and Cardiovascular Disease Mortality Among Middle-aged Men in Korea: The Seoul Male Cohort Study
Article information
Abstract
Objectives
This study estimated the association of cardiovascular health behaviors with the risk of all-cause and cardiovascular disease (CVD) mortality in middle-aged men in Korea.
Methods
In total, 12 538 men aged 40 to 59 years were enrolled in 1993 and followed up through 2011. Cardiovascular health metrics defined the following lifestyle behaviors proposed by the American Heart Association: smoking, physical activity, body mass index, diet habit score, total cholesterol, blood pressure, and fasting blood glucose. The cardiovascular health metrics score was calculated as a single categorical variable, by assigning 1 point to each ideal healthy behavior. A Cox proportional hazards regression model was used to estimate the hazard ratio of cardiovascular health behavior. Population attributable risks (PARs) were calculated from the significant cardiovascular health metrics.
Results
There were 1054 total and 171 CVD deaths over 230 690 person-years of follow-up. The prevalence of meeting all 7 cardiovascular health metrics was 0.67%. Current smoking, elevated blood pressure, and high fasting blood glucose were significantly associated with all-cause and CVD mortality. The adjusted PARs for the 3 significant metrics combined were 35.2% (95% confidence interval [CI], 21.7 to 47.4) and 52.8% (95% CI, 22.0 to 74.0) for all-cause and CVD mortality, respectively. The adjusted hazard ratios of the groups with a 6-7 vs. 0-2 cardiovascular health metrics score were 0.42 (95% CI, 0.31 to 0.59) for all-cause mortality and 0.10 (95% CI, 0.03 to 0.29) for CVD mortality.
Conclusions
Among cardiovascular health behaviors, not smoking, normal blood pressure, and recommended fasting blood glucose levels were associated with reduced risks of all-cause and CVD mortality. Meeting a greater number of cardiovascular health metrics was associated with a lower risk of all-cause and CVD mortality.
INTRODUCTION
The leading causes of death globally are non-communicable diseases (NCD) including cardiovascular disease (CVD), cancer, diabetes, and chronic respiratory disease, which accounted for 63% of 57 million deaths total worldwide in 2008. The largest proportion (48%) of NCD deaths globally is caused by CVD (International Classification of Disease, tenth revision [ICD-10] codes I01-I99) [1]. In Korea, circulatory system diseases are the second most common cause of death, accounting for an even greater proportion of the mortality rate in each of the last 2 years. Cardio-cerebrovascular diseases were the leading causes of circulatory system disease deaths in 2011 [2].
Behavioral risk factors including current smoking, physical inactivity, unhealthy diet, and excessive alcohol consumption are responsible for about 80% of cases of coronary heart disease and cerebrovascular disease [3]. These CVD risk factors are related to 4 major physio-metabolic changes: elevated blood pressure, increased weight, hyperglycemia, and dyslipidemia [1]. Meanwhile, individuals with a greater number of cardiovascular health habits have a significantly lower CVD mortality rate than those with fewer such health habits [4-6].
In 2010, the American Heart Association (AHA) published recommendations aimed at reducing deaths from all CVDs and stroke, and at improving the cardiovascular health of the population as a whole. To measure progress toward these prevention-related goals, the AHA defined the construct of "ideal cardiovascular health" on the basis of 7 metrics: smoking habit, body mass index (BMI), nutritional intake, physical activity level, blood pressure, blood glucose level, and total cholesterol level [7].
In Korea in 2009, the Korea Centers for Disease Control Prevention proposed "Nine healthy life habits for prevention and management of cardio-cerebrovascular diseases" [8]. However, these recommendations have insufficiently detailed goals for and quantitative measures of a healthy lifestyle to evaluate the effectiveness of preventive measures at the individual and population levels. In 2012, using data from US-National Health and Nutritional Examination Surveys (NHANES) linked to mortality, Yang et al. [9] categorized the population by awarding up to 7 cardiovascular health scores on the basis of healthy behaviors; thus, ≥6 points reflects the increasingly well recognized low-risk group. The emphasis on maintaining healthy habits rather than recognizing and treating high-risk individuals offers a highly desirable message for health promotion for the general population. Despite their implications, the AHA's metrics have not been broadly studied or previously applied to an Asian population. Therefore, in this study, we assessed the 7 cardiovascular health metrics among middle-aged men in Korea and estimated the combined association and population-attributable risk (PAR) of these cardiovascular health behaviors with respect to the risks of all-cause and CVD mortality.
METHODS
Study Population
The study cohort was taken from the Seoul Male Cohort Study, which was initiated in January 1993. Detailed descriptions of the design of the Seoul Male Cohort Study have been reported previously [10-13]. A total 14 533 cohort participants, male sex, 40 to 59 years of age, and residing in or near Seoul, South Korea, completed comprehensive baseline surveys and conducted health examinations of the Korea Medical Insurance Corporation in 1992 [13]. Survey questionnaires were only measured once at the cohort construction. Of the 14 533 subjects, we excluded subjects who self-reported having a medical history of cerebrovascular disease (n=86) or myocardial infarction (n=243), or a BMI <18.5 at baseline (n=191) [9]. Regarding the health behavior, we also excluded participants missing data on 1 or more of the cardiovascular health metrics (n=1475). In the end, 12 538 subjects were included among the study participants. This study was approved by the institutional review board of Seoul National University College of Medicine/Seoul National University Hospital (C-1301-015-454).
Mortality Assessment
Participants were followed from January 1, 1993 to December 31, 2011. Information on the date and causes of death was obtained from mortality microdata by the National Statistics Office. Causes of death are indicated by ICD-10 codes. Mortality from total CVD was defined by the ICD-10 codes, I01-I99 [1,14].
Definitions of Cardiovascular Health Metrics
To define cardiovascular health metrics, the following 7 cardiovascular health behaviors proposed by the AHA were applied and modified for our analysis [7]: smoking, physical activity, BMI, healthy diet score, total cholesterol, blood pressure, and fasting blood glucose. All 7 cardiovascular health behaviors were measured once at the time of the baseline surveys in cohort recruitment.
Smoking
We used the categories of never, former and current smoker [7]. Time since smoking cessation was assessed at baseline in 1992.
Physical activity
To assess physical activity, the following question was asked during the baseline survey: "In the past year, how many hours a week have you spent on vigorous and moderate exercise?" We classified the subjects as ideal level if they engaged in any physical activity for ≥150 min/wk at moderate intensity, ≥75 min/wk at vigorous intensity, or ≥150 min/wk at moderate or vigorous intensity [7,9].
Body mass index
BMI (kg/m2) was calculated as weight (kg) divided by the squared height (m2). For the BMI, intermediate and poor health were defined by overweight (25> BMI ≥23) and obesity (BMI ≥25), respectively [15].
Healthy diet score
We modified healthy diet components on the basis of Korean dietary pattern. The healthy diet score (range, 0 to 5) was calculated by summing the following dietary items, assigning 1 point each for the consumption of fruits or vegetables (≥450 g/d), fish (≥2 times/wk), brown rice (≥1 serving/d), sodium (≤ 2000 mg/d), and sugar-sweetened beverages (sugar-sweetened coffee ≤1 time/d and soft drink ≤1 L/wk). The healthy diet score was estimated on the basis of the semi-quantitative food frequency questionnaire (FFQ) and the Korean Nutrient Database compiled by the Korean Nutrition Society to estimate the daily sodium intake [16]. The development and validation of the FFQ are described elsewhere [17]. For analyses, we dichotomized the scores as <2 or ≥2 components [9] because of the small number of participants with scores ≥3 (n=32).
Total cholesterol, blood pressure, and fasting blood glucose
The ideal levels of total cholesterol, blood pressure, and fasting blood glucose were defined according to current clinical practice guidelines. We classified the total cholesterol level into 3 categories: <200, 200-239, and ≥240 mg/dL [18]. Ideal blood pressure was <120/80 mmHg, and ideal fasting blood glucose was <100 mg/dL, which are consistent with their respective optimal threshold levels [19,20].
Cardiovascular health metrics score
We calculated a cardiovascular health metrics score by recoding the 7 metrics as dichotomous variables, awarding 1 point for ideal vs. 0 points otherwise with the exception of the healthy diet score: (healthy diet components ≥2 [1 point] vs. <2 [0 points]) [9]. All of the subjects were classified as meeting 0-7 cardiovascular health metrics. The sum of these scores indicates how many individual measures a participant had at the ideal level.
Other Lifestyle Factors
Other demographic and lifestyle factors included in our analyses were age, education attainment, alcohol consumption, sleep hours, and family history of CVD (yes/no). The subjects were divided into 5-year cohorts at entry: 40 to 44, 45 to 49, 50 to 54, and 55 to 59 years. Educational attainment was classified as high school or lower, and some college or higher. Alcohol consumption was assessed at the baseline survey: "Have you ever drunk alcohol?" Alcohol drinking was classified as current, former, and never. For sleep hours, participants were asked to report their mean daily sleep hours in the past year; responses were classified into 3 categories: ≤5, 6-7, and ≥8 hours. There were also questions about past medical history, including whether the subjects had CVD or myocardial infarction.
Statistical Analyses
To evaluate associations and compare differences between 2 groups, we used the χ2 test or t-test. We used Cox proportional hazards regression models to estimate the hazard ratios (HRs) for all-cause and CVD mortality associated with cardiovascular health metrics. Multivariable HRs were adjusted for age, educational attainment, alcohol drinking, sleep hours, family history of CVD, and other cardiovascular health metrics. Variables with p<0.1 in the univariate analysis were selected as potential confounders. We calculated adjusted PARs using available macro estimates of the proportions of all-cause and CVD mortality in this cohort that would have hypothetically been avoided [21-23]. To calculate the HRs with the cardiovascular health metrics score, we used participants with a score of 0-2 as the reference because of few of the participants who had a score of 0 (n=6) or 1 (n=77); we also combined participants with a score of 6 or 7 (n=84) into a single group for robust estimation. The person-years of follow-up were measured from the time of entry into the study until the date of death or December 31, 2011. Age-adjusted all-cause and CVD mortality rates (per 1000 person-years) were calculated using the direct method of standardization with age distribution of the whole cohort as the standard. A p-value for trends was calculated using a Satterthwaite adjusted F-test. Kaplan-Meier survival curves were drawn for cumulative all-cause and CVD mortality according to the cardiovascular health metrics scores. All of the tests were 2-tailed, and the level of significance was set at p<0.05. Analyses were conducted using SAS version 9.3 (SAS Inc., Cary, NC, USA).
RESULTS
The general characteristics of the subjects and the 7 cardiovascular health metrics are shown in Table 1. Smoking, physical activity, blood pressure, and fasting blood glucose were significantly different between the living and deceased cohorts. There were 1054 deaths in total, 564 (53.5%) due to cancer (C00-C97), and 171 (16.2%) due to CVD during 230 690 person-years of follow-up. Non-smoking, normal blood pressure, and fasting blood glucose <100 mg/dL were independently associated with significantly lower risks of all-cause and CVD mortality (Table 2). Adjusted PARs for all-cause mortality ranged from 1.2% (95% confidence interval [CI], 0% to 2.9%) for fasting blood glucose (≥100 mg/dL) to 29.2% (95% CI, 22.2% to 35.9%) for current smoking. The adjusted PARs for the 3 significant metrics combined were 35.2% (95% CI, 21.7% to 47.4%) and 52.8% (95% CI, 22.0% to 74.0%) for all-cause and CVD mortality, respectively (Table 3). Among participants who had ≤2 cardiovascular health metrics, the age-standardized absolute risks were 6.83 deaths per 1000 person-years for all-cause mortality and 1.62 for CVD mortality; among participants who had ≥6 cardiovascular health metrics, the corresponding risks were 2.52 deaths per 1000 person-years for all-cause mortality and 0.16 for CVD mortality (p<0.001 for trend). The adjusted HRs for the cardiovascular health metrics scores of the participants with the highest scores compared to those with the lowest scores were 0.42 (95% CI, 0.31 to 0.59) and 0.10 (95% CI, 0.03 to 0.29) for all-cause and CVD mortality, respectively (Table 4). Figure 1 shows the Kaplan-Meier curves for cumulative all-cause and CVD mortality among participants with cardiovascular health metrics scores of 0-2, 3, 4, 5, and ≥6. A greater number of cardiovascular health metrics was associated with lower risks of all-cause and CVD mortality (p<0.001 for trend). Regarding the risk of cancer death, participants without current smoking status had a significantly lower risk of all-cancer mortality (adjusted HR, 0.60; 95% CI, 0.50 to 0.72). However, a greater number of cardiovascular health metrics was not associated with lower risk of all-cancer mortality (data not shown).

General characteristics of the study population, Seoul Male Cohort Study, 1993 to 2011

Adjusted hazard ratio of cardiovascular health metrics and risk of all-cause and CVD mortality, Seoul Male Cohort Study
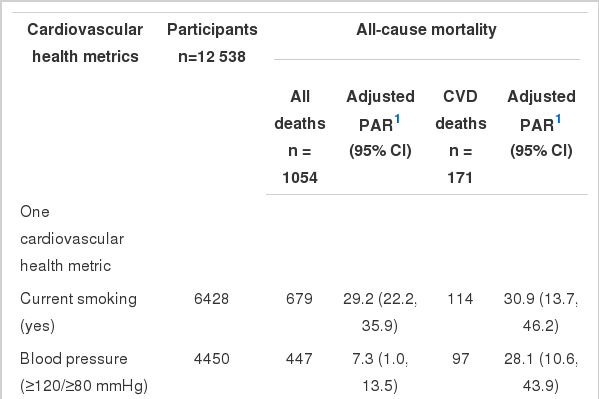
Adjusted PARs of all-cause and CVD mortality with respect to cardiovascular health metrics, Seoul Male Cohort Study

Age-adjusted mortality rates and adjusted HRs of all-cause and CVD mortality by number of cardiovascular health metrics, Seoul Male Cohort Study

Kaplan-Meier curves for cumulative all-cause and cardiovascular disease mortality by number of cardiovascular health metrics, Seoul Male Cohort Study. (A) All-cause mortality. (B) Cardiovascular disease mortality. Y-axis segments shown in bold indicate range from 0 to 0.03.
DISCUSSION
In this prospective cohort study, we evaluated the associations of individual and combined cardiovascular health metrics based on the definitions of the AHA with all-cause and total CVD mortality in healthy middle-aged men in Korea participating in the Seoul Male Cohort Study. Three of the 7 cardiovascular health behaviors-non-smoking status, normal blood pressure, and ideal fasting blood glucose-were significantly associated with reduced risks of all-cause and total CVD mortality compared to the presence of none of these factors. Furthermore, having a greater number of cardiovascular health metrics reduced the risk of all-cause and CVD mortality.
Our findings are concordant with those of previous studies on the association between combined low-risk lifestyle factors and all-cause or CVD mortality [9,14,24-26]. In their recent analyses of 13 312 American adults aged ≥20 years using data from the US-NHANES, Yang et al. [9] report that among the 7 cardiovascular health metrics recommended by the AHA, not smoking, ideal and intermediate physical activity, normal blood pressure, and HbA1c <5.7% were independently associated with significant reductions of all-cause and CVD mortality. Yang et al. [9] also reported the adjusted HRs of all-cause and CVD mortality comparing participants who met ≥6 vs. ≤1 cardiovascular health metrics as 0.49 (95% CI, 0.33 to 0.74) and 0.24 (95% CI, 0.13 to 0.47), respectively. These results are very similar to the magnitudes of association in the present study. However, comparing the participants of both studies, a significantly higher proportion of participants met ≥6 cardiovascular health metrics in the present study than in the previous study (n=1451/12 538 [11.6%] vs. n=957/13 312 [7.2%]). In contrast, the proportion of participants who met 0-1 metric was lower in the present study (n=83/12 538 [0.66%] vs. n=1236/13 312 [9.3%]). Furthermore, the proportion of subjects with ideal cardiovascular health was higher in the present population than in the US-NHANES population [9]. This difference could be accounted for by differences in gender, mean age, and racial diversity. In addition, participants of the present study were government employees, school teachers, and pensioners at the time of the recruitment. Although the subjects of this study were part of general population in Korea, they might have had more healthy behaviors or higher socioeconomic status than the US-NHANES population. Nevertheless, the simple cardiovascular health metrics score was closely related to all-cause and total CVD mortality in both studies.
The EPIC-Norfolk study reported that the combination of four healthy behaviors (i.e., non-smoking, being physically active, having moderate alcohol intake, and plasma vitamin C >50 mmol/L) is associated with lower risks of all-cause and CVD mortality [24]. Yun et al. [25] report that among 59 941 Koreans who visited a health promotion center, having a high unhealthy lifestyle score increased the risk of all-cause mortality. Further, current smoking and physical inactivity were independently associated with an increased risk of mortality. In the Japan Collaborative Cohort study, Eguchi et al. [14] report that the HRs of total CVD mortality for 7-8 vs. 0-2 points for combined healthy lifestyle behaviors on a scale of 0 to 8 were 0.36 (95% CI, 0.22 to 0.58) for men. In the Singapore Chinese Health Study, CVD mortality rates decreased sharply with an increasing number of protective lifestyle behaviors (i.e., dietary habit pattern, physical activity, alcohol intake, usual sleep time, smoking status, and BMI) [26].
Not all of the individual metrics contributed to the reduction in risk. Physical activity, BMI, healthy diet, and total cholesterol were not significantly associated to all-cause or CVD mortality in the present study. However, some studies have provided evidence supporting the benefits of a healthy diet and physical activity for all-cause mortality or CVD incidence [27-29]. For the healthy dietary habits, few participants (n=547/12 538 [4.4%]) had the intermediate level of healthy diet (≥2 components) and only 1 participant had the ideal healthy diet (≥4 components). A significantly larger proportion of US-NHANES participants (n=3067/13 312 [23.0%]) achieved the intermediate dietary health level than our study participants [9]. However, the AHA's healthy diet recommendation based on the Dietary Approaches to Stop Hypertension-type eating plan was different from the Korean food items and diet pattern. The use of a simple index of minimum daily intake of fruits and milk or maximum daily intake of sodium could be easy to apply [14]. To develop a more valid and suitable healthy diet score related to CVD, further studies are required among Koreans. Regarding the BMI, a recent meta-analysis indicates that the BMI does not improve risk prediction for first-onset CVD when additional information exists on blood pressure, diabetes mellitus history, and cholesterol measures [30]. Jee et al. [31] reported that smoking was an independent risk factor for CVD and that a low cholesterol level had no protective benefit against smoking-related atherosclerotic CVD. Eguchi et al. [14] found that the protective effect of each health behavior in men is generally larger among non-smokers than in smokers. The prevalence of current smokers among our participants (51.3%) is nearly twice that reported in the US-NHANES population (26.6%) [9]. Lack of a protective benefit of some healthy behaviors could potentially be explained by remarkably higher proportions of current smokers in the present study.
In the present study, smoking was associated with the largest PARs for all-cause and CVD mortality. Even though the prevalence of smoking among Koreans has declined over the last 15 years, nearly half (47.3%) of Korean men aged ≥19 years were still current cigarette smokers in 2011 [32]. Focusing on promoting smoking cessations would further reduce CVD death. Based on our analysis, if all cohort members quit smoking, and decreased their blood pressure and fasting blood glucose, an estimated 52.8% of CVD s death would be avoided.
It should be noted that when estimating the combined effect of the 7 cardiovascular health metrics on mortality risk, we categorized participants on the basis of their number of healthy lifestyle factors independent of statistical significance. Lifestyle behaviors may act synergistically to increase or reduce the risk of disease or death. However, existing biological or epidemiological evidence is not enough to measure these synergistic mechanisms into reliable estimates [33]. Health behaviors comprise multiple dimensions and causal processes. Thus, using a combined lifestyle analysis may elucidate the relationships between individual health behaviors [34].
The present study has certain limitations. First, the baseline measurements of the survey questionnaire including cardiovascular health metrics were only performed once at the time of cohort recruitment. We were unable to quantify the effects of changes in these lifestyle habits on all-cause and CVD mortality during follow-up. This could lead to non-differential misclassifications, resulting in the underestimation of associations. Second, our study evaluated the associations between cardiovascular health metrics and CVD mortality, and not incidence. CVDs or other diseases may induce lifestyle changes and consequently mortality risks. To minimize this effect, we excluded subjects with a history of myocardial infarction or CVDs. Third, when calculating the cardiovascular health metrics score, we excluded 1705 subjects who had missing information on ≥1 metric. This is likely to result in a selection bias. However, there was no significant difference in risk factors between individuals with complete and incomplete health metrics scores. Fourth, the baseline FFQ was not consistent with the AHA's healthy diet definition. There is insufficient information about the standard ideal healthy diet associated with CVD mortality in the Korean population. Fifth, individual cardiovascular health metrics risks were dichotomized, which could limit the interpretation of the effects of different healthy behaviors. However, applying equivalent weights to these health factors may have resulted in conservative estimates. The use of the simple score algorithm facilitated study interpretation and provided clear information about the general population.
Despite these limitations, our study has several advantages. First, this was a prospective cohort study of mortality with a long follow-up (19 years). Second, the results of a baseline questionnaire survey administered to disease-free participants at health examinations were analyzed, allowing the determination of clear causal relationships. Third, our study surveyed a number of detailed health behavior variables and potential confounders for CVD at baseline recruitment, including family history of CVD. Fourth, we estimated adjusted PARs for individual and combined cardiovascular health metrics significantly reducing the risks of all-cause and CVD mortality. These findings suggest that health gains are achievable when adults move from poor to intermediate and intermediate to ideal health with respect to most health metrics at the population level.
In conclusion, in this prospective cohort study, 3 individual cardiovascular health behaviors-non-smoking status, normal blood pressure, and recommended fasting blood glucose level-were significantly associated with reduced risks of all-cause and total CVD mortality. Meeting a greater number of cardiovascular health metrics was reduced the risk of all-cause and CVD mortality, but the prevalence of having all 7 cardiovascular health behaviors was low in the study population. Comprehensive primordial and primary prevention strategies promoting healthy lifestyles by increasing the prevalence of desirable healthy behaviors will improve the cardiovascular health status of the general population.
ACKNOWLEDGEMENTS
The Seoul Male Cohort Study was supported by a grant from the National R&D Program for Cancer Control, Ministry of Health & Welfare, Republic of Korea (0520160-1).
Notes
The authors have no conflicts of interest with the material presented in this paper.