Socio-demographic Characteristics and Leading Causes of Death Among the Casualties of Meteorological Events Compared With All-cause Deaths in Korea, 2000-2011
Article information
Abstract
Objectives
This study investigated the socio-demographic characteristics and medical causes of death among meteorological disaster casualties and compared them with deaths from all causes.
Methods
Based on the death data provided by the National Statistical Office from 2000 to 2011, the authors analyzed the gender, age, and region of 709 casualties whose external causes were recorded as natural events (X330-X389). Exact matching was applied to compare between deaths from meteorological disasters and all deaths.
Results
The total number of deaths for last 12 years was 2 728 505. After exact matching, 642 casualties of meteorological disasters were matched to 6815 all-cause deaths, which were defined as general deaths. The mean age of the meteorological disaster casualties was 51.56, which was lower than that of the general deaths by 17.02 (p<0.001). As for the gender ratio, 62.34% of the meteorological event casualties were male. While 54.09% of the matched all-cause deaths occurred at a medical institution, only 7.6% of casualties from meteorological events did. As for occupation, the rate of those working in agriculture, forestry, and fishery jobs was twice as high in the casualties from meteorological disasters as that in the general deaths (p<0.001). Meteorological disaster-related injuries like drowning were more prevalent in the casualties of meteorological events (57.48%). The rate of amputation and crushing injury in deaths from meteorological disasters was three times as high as in the general deaths.
Conclusions
The new information gained on the particular characteristics contributing to casualties from meteorological events will be useful for developing prevention policies.
INTRODUCTION
An extreme abnormal climate is a phenomenon in which meteorological elements exceed certain ranges observed previously [1]. Due to the effects of global climate change, the death rate caused by floods and landslides has been increasing worldwide [2,3], and in the Republic of Korea (hereafter, "Korea"), more than 60 deaths have been occurring annually from meteorological disasters [4]. In 2011, particularly, 16 died within the metropolitan area of Seoul due to localized heavy rain, indicating that there is no safe zone in Korea from meteorological disasters [5].
In addition to death and injury, meteorological disasters have wide-ranging health effects such as exacerbation of chronic diseases and transmission of infectious diseases by destruction of health infrastructure [6,7]. However, few studies of vulnerable groups in meteorological disasters have been published in the health sciences, and most of the related previous studies were limited to specific disaster events, resulting in difficulty in identifying groups vulnerable to meteorological disasters and their sociodemographic characteristics [8,9]. In Korea, health surveys related to meteorological disasters have only computed the total number of deaths, and these calculations have a risk of underestimation because they depend on residents' reports. In addition, the reliability of the results of the reports from researchers is not guaranteed as the computing data have not been formally shared after statistical processing [4,10].
As death is the most serious result in the health sector for all risk factors, death investigation is not only a process of identifying vulnerable groups but also the essential factors of health evaluation to measure the impacts of meteorological disasters on individuals and society. Furthermore, the results of analyzing deaths play an important role in establishing prevention programs and ensuring their efficient operation [11], and thus studies are needed that investigate the characteristics of those who have died in meteorological disasters based on reliable data including sociodemographic factors. In this context, the authors of this study, using statistical data on deaths nationwide, analyzed the sociodemographic characteristics and causes of death of those who had died in meteorological disasters for the last 12 years and compared the results with those of a control group of those who died from all causes during the same period in order to identify any unique characteristics of weather-related deaths.
METHODS
Population Sampling
Among 2 729 214 deaths recorded in the statistical data on deaths by all causes between 2000 and 2011 presented by the National Statistical Office, 709 people who died from external causes such as lightning, landslides, and floods (X330-X389) were defined to have died by meteorological disasters based on the Korean Standard Classification of Diseases (KCD, the fifth revised version), and all others who died were classified into a general death group [12]. As for the deaths by meteorological disasters classification using external causes of death, the classification system used by Thacker et al. [12] was applied to this study, except for heat waves and cold waves, which have different mechanisms leading to death. While death mechanisms by hydrological disasters such as floods, landslides, and typhoons are highly related to the death on the spot based on a rapid increase in rainfall and exposure to it, heat waves and cold waves are related to delayed and indirect deaths after being exposed to extreme temperatures [4,13,14].
Among the general deaths, members of a control group was selected among whom gender, age, date of death, and location of residence were controlled to be similar to those of the group of deaths by meteorological disasters. This is to control for the effects of variables that may affect the comparison: educational years, marital status, type of job, location of death, and medical cause of death between the groups of deaths. After stratifying the data on the general deaths by year of death and cities and provinces, the control group was sampled by using exact matching with the group of deaths by meteorological disasters for sex, age, and month of death.
Variables
In order to compare the characteristics among the matched control group, the group of general deaths, and the group of deaths by meteorological disasters, they were classified according to sociodemographic characteristics and medical cause of death for analysis. For the sociodemographic variables, years of education, occupation, marital status, and type of location of death were re-classified among the variables recorded in the statistics of death by causes. The regions were divided into two groups: metropolitan cities and provinces. For the education level, subjects were classified into one of four groups: elementary school and under, middle school, high school, and college and over based on the highest level of education completed. As for the type of occupation, technicians and quasiprofessionals were included in the professional group in the data before 2007 based on international job classification criteria; nine types of jobs were classified and described, including managers, professionals and technical staff, clerical support workers, sales and service workers, skilled workers in agriculture, forestry, and fishery, workers in crafts and related trades, plant and machine operators and assemblers, elementary workers, and the unemployed (including students and homemakers). Marital status was divided into single, married, and other (divorced or bereaved). As for the type of location of death, with care facilities included in hospital facilities, the classification included home, hospital facilities, workplace, during transfer, streets and roads, other, and unknown. When other sociodemographic variables besides type of location of death were recorded as no response or unknown, those were excluded in analysis. As for medical causes of death, cause of death data were first examined from the main diagnosis of death, and all the death causes beginning with S or T in the classification codes were included in the injury group and all other codes were included in the non-injury group, based on the KCD. For specific establishment of causes of death in the group of deaths by meteorological disasters, in the injury group was subdivided into superficial injuries, open wounds, fractures (including dislocations), amputations, crush injuries (including injuries to vessels and nerves), and poisoning, with representative mechanisms of death by meteorological disasters such as drowning, suffocation, and the effects of lightning.
Statistical Analysis
In order to compare the sociodemographic characteristics and medical causes of death between the group of deaths by meteorological disasters and the group of general deaths, the Mann-Whitney test and Pearson's chi-squared test were used, and SPSS version 19.0 (IBM Corp., Armonk, NY, USA) was used for analysis. For sampling the control group from the general deaths, matching was conducted using the propensity score, in which data were stratified by year of death and cities and provinces, and then binary logistic regression was applied for prediction of when variables of gender, age, and date of death (month) were defined as explanatory variables. Using the matchIt package of the R 2.1.5 program (The Comprehensive R Archive Network, http://cran.r-project.org), the group of deaths by meteorological disasters and the group of all-cause deaths were matched and extracted by the exact matching function [15]. The Hosmer-Lemeshow test and C statistic test were conducted for prediction models applied to the matching by years and cities and provinces in order that all of them were at least 0.9 and determined to be of model fitness. All the variables were analyzed after weighting by the numbers in the control groups matched to each dead person by meteorological disasters when the causes of death and sociodemographic factors were compared.
RESULTS
Among the dead recorded in the death statistics by causes between 2001 and 2011 presented by the National Statistical Office, 709 cases were classified into the group of deaths by meteorological disasters, and 2 728 505 all-cause deaths during the same period, excluding the meteorological deaths, were defined as the group of general deaths. When factors that may have effects on the comparison of sociodemographic characteristics, type of location of death, and mechanism of death were matched (date of death, region of death, gender, and age), 642 of the group of meteorological deaths were matched to 6815 of the control group.
Table 1 shows differences in distribution of age, gender, and regions between the group of the general deaths and the group of deaths by meteorological disasters. The mean age of death in the group of deaths by meteorological disasters was 51.6 years old, 17 years less than that of the group of the general deaths (68.6 years old), with a statistically significant difference (p<0.001). The rate of male deaths in the group of deaths by meteorological disasters (62.3%) was significantly higher than that of the group of general deaths (55.4%) (p<0.001), and 75.3% of the deaths by meteorological disasters were located in rural regions, significantly higher than the rate of the general deaths located in rural regions (61.1%) (p<0.001).
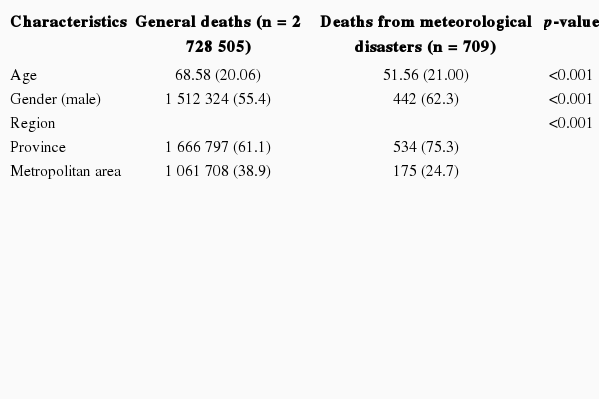
Baseline distribution of age, sex, and region in both groups of total deaths and deaths from meteorological events in Korea, 2000-2011
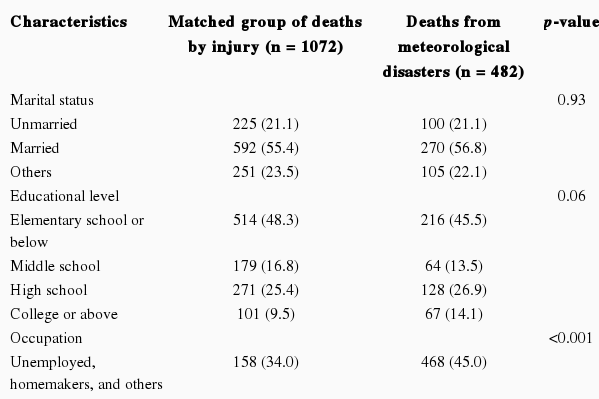
Table 2 shows differences the marital status, the highest level of education, and types of occupations among the groups matched by date of death, location of death, gender, and age. As for the highest level of education, the rates of elementary school and under, middle school, high school, and college and over were 51.2%, 12.3%, 23.7%, and 12.8%, respectively, in the group of the deaths by meteorological disasters, while those rates were 49.9%, 16.2 %, 22.8%, and 11.1%, respectively, in the control group of the general deaths, indicating that secondary educational years was higher in the group of the deaths by meteorological disasters, while the proportion of those with an elementary education and under was higher in the group of the deaths by meteorological disasters (p=0.060).
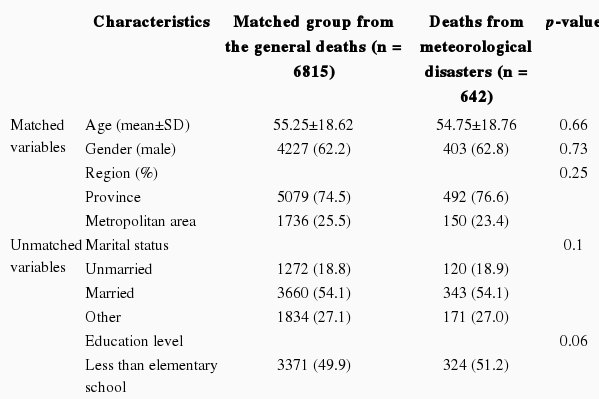
As for the type of occupation, 62.5% of the group of deaths by meteorological disasters conducted activities related to income but 40.3% of the matched group from the general deaths conducted such activities, indicating that the ratio of working population was relatively higher in the former group. The proportion of workers in agriculture, forestry, and fishery jobs was 32.05% in the group of deaths by meteorological disasters, two-fold higher than that of the matched group from the general deaths, with a significant difference (p<0.001). In addition, elementary workers and clerical support staff showed higher rates in the group of the deaths by meteorological disasters, at 5.6% and 6.1%, respectively. There was no significant difference in the marital status between the control and study groups.
The type of location of death showed large differences among the groups of deaths (Table 3). 54.1% of the deaths occurred in medical facilities in the group of general deaths, only 7.6% of the group of the deaths by meteorological disasters died in hospital facilities. Meanwhile, 47.5% of the group of deaths by meteorological disasters had an unknown type of location of death, a higher proportion than any specified type of location. 2.3% and 1.1% of the group of the deaths by meteorological disasters died on the road and the workplace, respectively, these rates were higher than those of the control group of general deaths. In particular, 5.3% of the group of deaths by meteorological disasters died during transfer to the hospital, which was at least two-fold higher than the proportion of the control group of general deaths.

Differences in type of location of death between groups of deaths from meteorological events and control deaths from all causes in Korea, 2000-2011
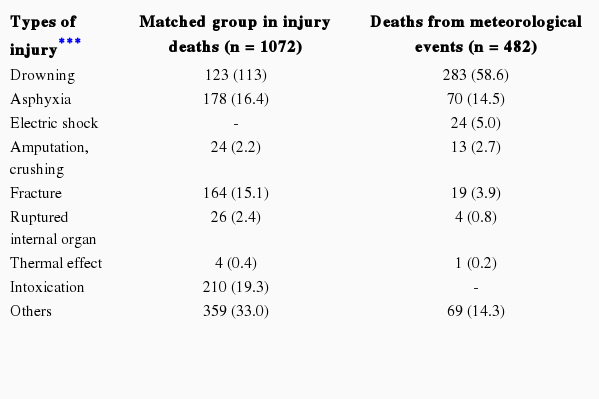
Table 4 shows the differences in the causes of death between the deaths by meteorological disasters and the group of general deaths. The entire group of deaths by meteorological disasters had injuries as the main cause of death, while 76.4% of the matched group from the general deaths were caused by non-injury, showing a significant difference in the causes of death by group. As for the injuries of the group of deaths by meteorological disasters, 369 cases, or at least half of the deaths, were caused by drowning (57.5%), followed by suffocation and poisoning. Amputation and crush injury caused 2.8% of the deaths within the group of meteorological deaths; the absolute number of cases was not higher, but the rate of occurrence was four-fold higher when compared with that of the control group of the general deaths. Meanwhile, 256 cases of poisoning by drugs and toxic substances occurred in the control group of the general deaths, tied for the third-highest rate with fracture, demonstrating the difference in mechanisms of deaths by injuries.
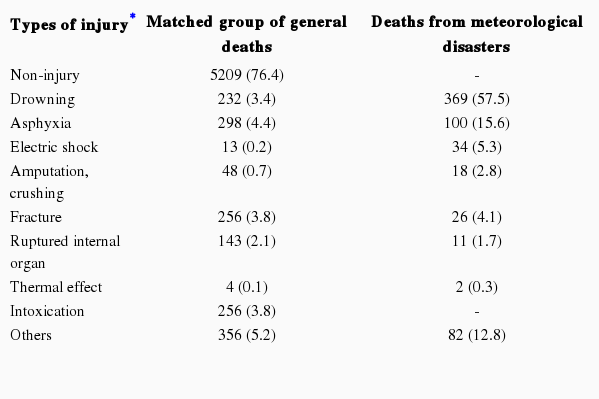
Leading causes of death comparing deaths from meteorological events and control deaths from all causes in Korea, 2000-2011
DISCUSSION
This study examined the deaths by meteorological disasters in Korea between 2000 and 2011, and was the first study to analyze sociodemographic characteristics and causes of death from meteorological disasters by using formal national statistical data for causes of death. Deaths by natural disaster have increased at least three-fold during the last 20 years, the highest rate of increase among all the diseases and injuries [16], and despite this rapid increase in the effects of meteorological disasters, few health science studies have been performed to identify groups vulnerable to meteorological disasters. The existing studies of deaths by meteorological disasters have focused on a single large-scale disaster or quantitative subjects such as changes in the death rate or morbidity of diseases, and few studies have performed a comprehensive analysis of sociodemographic characteristics or causes of death of vulnerable groups in meteorological disasters over the period of a decade or so [8,10]. Myung and Jang [4] reported on an analysis of the characteristics of groups of individuals who died in meteorological disasters in Korea between 1998 and 2008 using the data of reports on damage to humans by the National Emergency Management Agency, but the study was limited in that it did not analyze sociodemographic characteristics of those who died beyond gender and age.
A mean of 64.45 deaths occurred annually from meteorological disasters in Korea for the past 12 years, with the highest numbers in 2002 and 2003, at 235 and 153, respectively. The highest number of deaths for these two years may have been caused by the large typhoons named Rusa and Maemi in 2002 and 2003, and the results were significantly similar to the rate of death by natural disaster in Korea reported in the Emergency Events Database (EM-DAT) supported by the Université Catholique de Louvain in Belgium [17]. Furthermore, the number of deaths by meteorological disasters has been consistently increasing since 2008, emphasizing the necessity of health responses to minimize damage to humans.
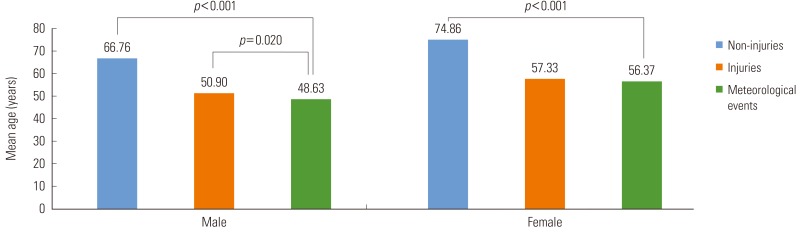
This study is different from existing research in that the sociodemographic characteristics and medical causes of death of vulnerable groups in meteorological disasters were specifically established by comparing them with general deaths. The age of death of the group of deaths by meteorological disasters was 51.56 years, showing a difference of 17.02 years when compared with that of the group of general deaths. Although not presented in the result tables, even when the deaths by injury in the group of general deaths were compared separately, the mean age of death of the group who died by meteorological disasters was lower. In particular, the age difference in the group of deaths by meteorological disasters for the males was significant, indicating that meteorological disasters, rather than general injuries as well as all causes of death, had greater effects on personal life span (Appendix 1). The mean age of death is an indicator directly showing the health effects on individuals, and it may be interpreted that the health impact by meteorological disasters was higher as the mean age of death of that group differed from that of the group of general deaths. Contrary to existing studies showing a higher death rate in the elderly group, the age of death of the elderly in this study was lower than that of the group of general deaths because the deaths under 65 years old were sufficiently greater in number, or 70% and over in the entire group [4]. Although the proportion of deaths by meteorological disasters in the group under 65 years of age was lower than that of the group of those 65 years old and over, the attributable mortality by meteorological disasters in the group under 65 years of age was higher than that of the group of those 65 years old and over. Because the number of all-cause death in the group under 65 years was much smaller than that of all-cause death in the group of 65 years old and over.
In this study, vulnerability based on gender and region was identified, as the deaths by meteorological disasters were more common in males than females and in the provinces than the metropolitan areas. The results were in accordance with those of other studies in which the deaths by meteorological disasters were higher in regions of small cities with less infrastructure and income rather than in metropolitan cities with higher income [2,4]. A study in Bangladesh and Nepal reported that the risk of death by flood after adjusting for age was two-fold higher in females than in males (relative risk, 1.5; 95% confidence interval [CI], 1.1 to 2.1), and a study in Sri Lanka reported that the death rate of females was higher (odds ratio, 2.17; 95% CI, 1.92 to 2.94), a result opposite that of this study [18,19]. However, the two above-mentioned studies investigated meteorological disasters in low-income nations, and the vulnerability factors may be different in mid- or high income nations such as Korea. As in studies conducted in the southeast area of the United States and in Fiji, where more males died, most of the studies in nations whose economic standards were similar to that of Korea reported that the males were at greater risk of death by meteorological disasters than females [20,21].
The sociodemographic characteristic of the dead that was newly established in this study was the type of occupation. The proportion of workers in the group of deaths by meteorological disasters (62.5%) was sufficiently higher than that in the group of general deaths, and the proportion of workers in primary industries such as agriculture, fishery, and forestry was two-fold higher, with a significant difference (p<0.001). In Vietnam, families working for agriculture showed more physical and economic damage by natural disaster [18] and in Sri Lanka, the death rate after a tsunami was highest in fishery workers [19], showing results in accordance with those of this study. These results may be interpreted as showing that the workers for primary industries have a relatively higher direct exposure to meteorological factors, indicating the necessity for studies of vulnerability considering more details on the specific type of job in order to develop specific behavior responses in the face of meteorological disasters.
As for the main causes of death, 76.4% of the group of general deaths were non-injury, while all of the group of deaths by meteorological disasters were caused by injuries and 57.5% died by drowning (Table 4). The results were in accordance with those of a study analyzing the causes of death by meteorological disasters in Korea between 1990 and 2008 and reporting that drowning explained 60.3% [4]. This may be interpreted as the result of Korean meteorological disaster characteristics mainly composed of rainfall-related disasters such as floods and typhoons. When the injuries of the group of deaths were classified based on mechanisms affecting the human body, injuries by direct exposure to meteorological factors such as drowning, suffocation, hypothermia, and the effects of lightning were overwhelmingly more common in the group of deaths by meteorological disasters, and amputation and crushing injury among other injury mechanisms occupied 4.5%, seven-fold higher than in the group of general deaths. Crushing injury indicates injuries that have occurred by being hit by a huge object and pressed by its weight during a meteorological disaster; it is accompanied by wide-ranging tissue damage and serves as one of the main causes of increasing delayed death by meteorological disasters [22]. Minimizing complications such as compartment syndrome or secondary infection by rapid transfer and first aid is the best way to prevent crushing injury progressing to death, but it is possible to develop additional deaths by delayed treatment because the proportion of deaths during transfer or in an unknown location were higher in the group of the deaths by meteorological disasters (19- and 4.6-fold, respectively) than in the group of general deaths (Table 3). Additionally, when the causes of death were compared by selecting a control group for only the deaths by injuries among the general deaths, the results were similar to the above-mentioned conditions and the difference was also significant (Appendices 2 and 3).
As seen in Table 3, only 8% of the group of deaths by meteorological disasters died in hospitals, and the proportion of deaths on streets & roads, other unspecified locations, and unknown locations was significantly higher than that of the group of general deaths, indicating that most of the dead lost their lives before being rescued and transferred to hospital facilities. In this context, in order to reduce the deaths by meteorological disasters, it is important to develop an emergency system for rapid identifying patients and early intervention. This is needed to prepare portable treatment facilities and distribute appropriate medical providers for severe diseases that may occur in meteorological disasters.
This study is significant as the first one performed in Korea and establishing sociodemographic characteristics and causes of deaths of the group of deaths by meteorological disasters using formal national data, but has limitations as secondary data. It does not reflect individual behaviors or specific details of an accident as factors increasing vulnerability to deaths by meteorological disasters. As in the results of existing studies in which at least 90% of the causes of death by flood were related to personal decisions regarding risk-taking behaviors such as rescue, river-crossing, and swimming, the conditions or behavior factors at the time of meteorological disasters are significant death risk factors, requiring further studies of behavior-related factors in meteorological disasters [23].
In addition, the statistical data on deaths by causes are based on the diagnosis of doctors, and thus there may be errors by underestimation of the death toll according to the determination and types of reporting of doctors. The data were measured to be appropriate as estimation data because the conditions in which deaths occurred are sufficiently similar to those of the data of reports on damage to humans by meteorological disasters presented by the National Emergency Management Agency but did not show complete accordance, and thus uncertainty in the data based on the reporting of the types of causes of death or data collection system cannot be excluded. Such uncertainty may induce under- or over-estimation of the characteristics of the deaths by meteorological disasters by regions, but this study aimed to analyze the characteristics of the deaths nationwide, requiring further studies to identify sociodemographic characteristics of deaths by region. Meanwhile, this study may not be affected by the uncertainty because it serves as a qualitative estimation of the vulnerability of the group of deaths by meteorological disasters and uses national data with representativeness accessed through a computer network. Rather, collection of data on deaths by meteorological disasters based on the diagnosis of death may serve as an advantage because it may include delayed or indirect deaths that are excluded in the reports of damage to humans by the National Emergency Management Agency. This may contribute to a new estimation of the deaths by meteorological disasters that can supplement the existing understanding and estimate errors in data that may occur in the existing surveillance data of deaths by the National Emergency Management Agency depending on the reports of local governments.
Investigations of deaths by meteorological disasters in Korea have not previously used systematic epidemiological surveys or surveillance systems; cities and provinces investigate the deaths and report to the National Emergency Management Agency. However, the reports of damage to humans are sufficiently restricted with regard to personal data and do not include health data such as disease histories or cause of death, which means they are limited as potential health assessment data. Above all, the various descriptive types of reports from many regions make it difficult to integrate the records of the deaths with consistency and it is easy to make errors in collection, thus resulting in obstructing the appropriate assessment of the deaths by meteorological disasters. However, the statistical data on the death by cause serves as a national death report based on death certificates by doctors, which is significant in that it may provide representative results.
Thus, the results of the newly identified characteristics of vulnerable groups in this study with the existing reports of damage to humans by the National Emergency Management Agency reflecting relatively well the details and causes of accidents that may contribute to the development of specific, efficient targeted prevention programs including the identification of vulnerable populations and behavior responses in meteorological disasters.
Notes
The authors have no conflicts of interest with the material presented in this paper.
Appendices
Appendix 1
Comparison of mean age of death among deaths from non-injuries, injuries, and meteorological events in Korea, 2000-2011. The mean age of each group of deaths was statistically analyzed using the Mann-Whitney test with the level of significance set at p=0.025.