Drinking Patterns Among Korean Adults: Results of the 2009 Korean Community Health Survey
Article information
Abstract
Objectives
In Korea, the proportion of deaths due to alcohol is estimated at 8.9%, far exceeding the global estimate of 3.8%. Therefore, this study was performed to examine the factors associated with low-risk, moderate-risk, and high-risk drinking patterns in Korean adults and to identify target populations for prevention and control of alcohol-related diseases and deaths.
Methods
We analyzed data from 230 715 Korean adults aged 19 years and older who participated in the 2009 Korean Community Health Survey. Multinomial logistic regression analysis was used to examine associations between socio-demographic and health-related factors and patterns of alcohol use.
Results
A substantially larger proportion of men than women engaged in high risk (21.2% vs. 3.4%) and moderate-risk alcohol use (15.5% vs. 8.2%). In both sexes, moderate- and high-risk uses were associated with younger age, higher income, being currently employed, smoking, being overweight/obese, and good self-rated health.
Conclusions
Given the large proportion of the population that is engaging in moderate- and high-risk drinking and given the social norms that support this behavior, public health policies and campaigns to reduce alcohol consumption targeting the entire population are indicated.
INTRODUCTION
Alcohol use has been recognized as one of the major risk factors worldwide of preventable mortality and morbidity [1]. Alcohol use is the third greatest contributor to the global burden of disease, and is estimated to cause 3.8% of all deaths and to result in 4.6% of all disability-adjusted life years lost and a disproportionate number of fatal injuries [2]. In Korea, alcohol use is estimated to cause 8.9% of all deaths [3]. More than half of these deaths are associated with binge drinking [4].
Alcohol use is associated with a variety of health outcomes that vary with the level of consumption [5]. In some studies, alcohol use in light to moderate quantities has been associated with better self-perceived health status, improved cardiovascular health, lower risk of osteoporosis in women, and lower rates of hospitalization [6,7]. In contrast, heavy drinking and binge drinking have been associated with unintentional and/or intentional injuries, interpersonal violence, human immunodeficiency virus infections, sexually transmitted infections, neurological damage, poor control of diabetes, hepatitis, hypertension, gastrointestinal and heart problem, liver cirrhosis, cancers such as oral, rectal, and liver cancer, stroke, and alcohol dependence [4,5,8-10].
In a recent large nationally representative survey in Korea, the Korea National Health and Nutrition Examination Survey (KNHANES)-IV, monthly alcohol drinking of adults was reported to be 59.0%, and the prevalence of high-risk alcohol drinking was 18.0%. These rates show an increasing trend compared with that of the previous year [11]. Besides this statistical report, many epidemiologic studies in Korea have focused on the health effects of alcohol drinking [12-16].
It is important to understand and monitor alcohol use patterns to assess the public health influences of this behavior, to identify target groups for public health programs addressing alcohol use, and to plan and evaluate evidence-based strategies to reduce risky use. Although several previous studies in Korea, to some extent, have explained alcohol consumption, they did not successfully describe overall drinking patterns in Korea because of a small-sized population, the use of old data or some restricted sample such as older adults, adolescents, or college students [17-21]. To our knowledge, there is still a lack of evidence on alcohol use patterns in Korea, especially at the national level.
Therefore, this analysis was conducted to investigate alcohol use patterns based on the level of alcohol drinking, specifically, non-use, low-risk use, moderate-risk use, and high-risk use, in a nationally representative sample of Korean adults from the 2009 Community Health Survey, and to examine comprehensively the multiple factors, including socio-demographic characteristics, health behaviors, and health status, associated with alcohol use patterns relative to alcohol non-use.
METHODS
Subjects
This study used data from the public use files of the 2009 Korea Community Health Survey (KCHS) conducted by the Korea Centers for Disease Control and Prevention. The KCHS is an annual nationwide health survey conducted since 2008 to provide population-based estimates of health indicators to be used for the development and assessment of public health policies and programs. The 2009 KCHS used a multistage sampling design to obtain a representative sample of adults aged 19 years or older. Within each of 253 communities, 90 primary sampling units (PSUs) corresponding to smaller geographic entities were randomly selected, followed by the random selection of 5 to 8 households within each PSU and an in-person interview of all adults in the household. Households were sampled from a registry of residents. To guarantee an adequate sample size in each community (about 900 persons in each community), when interviewers could not reach the sampled household after at least three visits, a replacement method was used, in which a randomly substituted household was selected [22]. The 2009 KCHS interviewed a total of 230 715 individuals.
Study Variables
The dependent variable in this study was the category of alcohol use pattern. Persons who had ever drunk any kind of alcoholic beverage during the past 12 months were classified as current drinkers and were asked more questions on the quantity consumed in a typical day and the drinking frequency in one time. We created categories of alcohol use patterns using the official definitions of KCHS to identify subgroups of individuals who used alcohol and whose drinking pattern may have been putting them at greater risk of harm relative to individuals in other groups [11]. We classified respondents into four categories: non-use, high-risk use (seven or more drinks in men or five or more drinks in women on the same occasion on at least 2 days within the past 7 days), moderate-risk use (seven or more drinks in men or five or more drinks in women on the same occasion on at least 1 day within the past 30 days), and low-risk use (some alcohol consumption but less than moderate-risk use).
For the comprehensive analysis of multiple factors associated with alcohol use, we selected socio-demographic variables, health behaviors, and health status including self-rated and mental health as independent variables. These variables have been associated with alcohol use in prior studies [6,20,23-26]. Socio-demographic variables included sex, age (19-44, 45-64, ≥65 years), marital status (never married, married/live with partner, formerly married [divorced/separated/widowed]), educational attainment (no formal education, elementary school, middle school, high school, college and above), monthly household income (1.49 million Korean won [KRW] or less, 1.50-2.99 million KRW, 3 million KRW or more), and current employment status (employed, unemployed). Health behavior variables were smoking status (current, former, non-smoking) and physical activity (participated in moderate physical activity for 5 days or more per week and for 30 minutes or more per activity or in vigorous activity for 3 days or more per week and for 20 minutes or more per activity). Health status-related characteristics included obese status (normal, body mass index [BMI] <25.0 kg/m2; overweight/obesity, BMI ≥25.0 kg/m2), self-rated health (good, fair, poor), and depressive symptoms evaluated by the Center for Epidemiological Studies Depression Scale (CES-D) (normal, CES-D score <21; high depressive symptoms, CES-D score ≥21).
Statistical Analysis
SAS version 9.2 (SAS Inc., Cary, NC, USA) was used for all statistical analysis; the analyses used sampling weights to account for the complex sampling design of the KCHS. The level of significance was set to 0.05. To control for potential sex-related differences in risk of alcohol use, sex-stratified analyses were conducted. We assessed the association of the alcohol use pattern with socio-demographic and health-related characteristics using chi-square tests. Multinomial logistic regression analyses were used to identify correlates of low-risk, moderate-risk, and high-risk use relative to non-use with adjustment for all variables.
RESULTS
Table 1 shows the characteristics of the study population. Of the population, 49.4% were men and 50.6% were women. Overall, 69.3% of the respondents were current drinkers (82.2% in men, 56.8% in women). The men had statistically significantly higher prevalence rates of moderate-risk use (15.5% vs. 8.2%) and of high-risk use (21.2% vs. 3.4%) relative to women (Table 1).
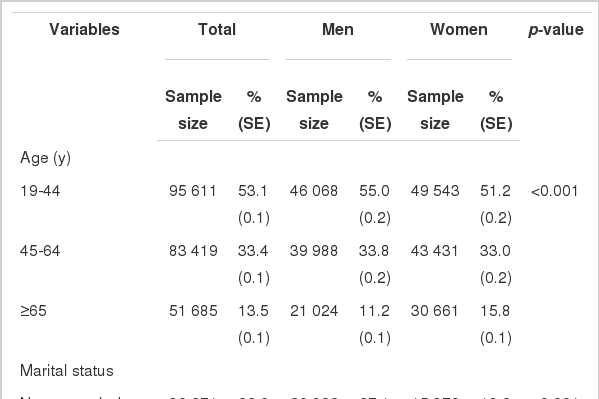
Characteristics of the study population
In both sexes, significant associations between alcohol use patterns and age group, marital status, educational attainment, monthly income, and employment status were found. Any alcohol use was more prevalent among individuals with higher educational level, higher income level, and employed status in both sexes. A higher prevalence of high-risk use was evident among middle-aged (45 to 64 years) and married men; higher prevalence rates of current drinking, low-risk, and moderate use were evident among younger aged and unmarried men. In contrast to men, in women, higher prevalence rates of drinking in any use pattern were evident among younger aged and unmarried persons (Table 2).
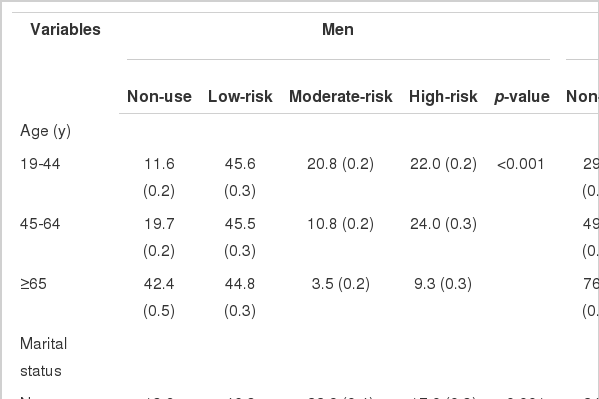
Association between alcohol use patterns and socio-demographic characteristics according to sex
In both sexes, certain health-related characteristics were significantly associated with alcohol use patterns. In men, the prevalence rates of high-risk use were higher among current smokers, persons who participated in physical activity, persons who were overweight or obese, those with relatively good self-rated health, and those with depressive symptoms. In women, the prevalence rates of high-risk use were higher among current smokers, persons who were not overweight, those with relatively good self-rated health, and those with depressive symptoms (Table 3).
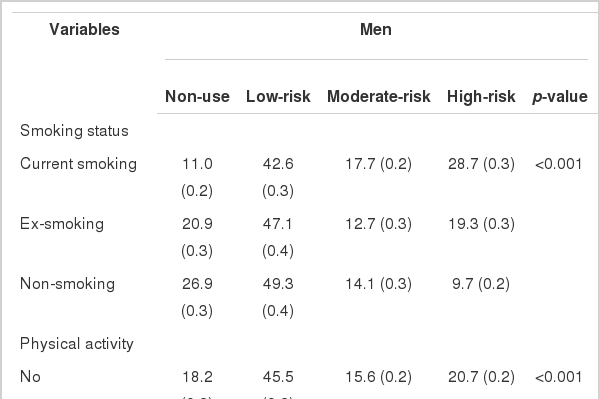
Associations between alcohol use patterns and health-related characteristics according to sex
The adjusted odds ratios (ORs) for low-, moderate-, and high-risk alcohol use relative to non-use are shown in Table 4. In both sexes, the ORs of persons who were younger, had a higher monthly income, were currently employed, were current or former smokers, and had good or fair self-rated health relative to their reference groups were significantly higher in low-, moderate-, and high-risk use. Also, in both sexes, being overweight or obese was associated with moderate- and high-risk use.

Multinomial logistic regression results for the relationship between alcohol use patterns and socio-demographic and health-related characteristics in Korean adults
There were sex-specific associations for some characteristics. For the men, higher educational attainment was significantly associated with low- and moderate-risk use. The ORs of the men who were married or formerly married relative to the never married were lower in moderate-risk use, but higher in high-risk use. The OR of the men who participated in physical activity was higher in high-risk use relative to that for physically inactive men, and those with high depressive symptoms had lower odds of low- and moderate-risk use. For women, the ORs of low-, moderate-, and high-risk drinking of persons who were married or formerly married were significantly lower compared to those of never-married women. The ORs of low-, moderate-, and high-risk use of women who had graduated from middle and high school were higher than those of uneducated women. The ORs of moderate- and high-risk drinking of women with high depressive symptoms were higher than those of women without depressive symptoms.
DISCUSSION
Using a representative population-based sample, we examined the rates of alcohol use and factors associated with low-, moderate-, and high-risk use. Overall, 69.3% of the population (82.2% of men, 56.8% of women) reported alcohol use during the previous year, and the rate of high-risk drinking was 12.0% (21.2% of men, 3.4% of women). These results are to some degree different from those of some restricted area studies and similar national surveys. For example, in the 2009 Korea National Health and Nutrition Examination Survey, which shared the same definition of yearly drinking and high-risk drinking with this study, the overall prevalence of past-year alcohol use among adults was slightly higher, at 75.7% (86.0% of men, 68.4% of women), and the rates of high-risk alcohol use were 24.6% in men and 7.3% in women [12]. These discrepancies may be due to differences between age and sex distributions of samples and weighting methods between the KCHS and KNHANES.
However, these rates of alcohol use in Korea are still higher than those in other countries, including China, the US, and Brazil [6,24,25,27,28], and reflect cultural norms about drinking in Korea [29,30]. In Korea, alcohol use is widely considered to be an important means of social relationships, and it is accepted, or even encouraged, to drink during social interactions, accompanied by a meal, in order to enhance relations with friends or business partners, and to establish a happy and congenial mood for adults, especially men [29]. In this study, intake of alcohol at any level, including low-, moderate-, and high-risk drinking, was more prevalent among men than among women.
Furthermore, the Korean culture of drinking may explain the association between alcohol drinking and socio-demographic factors including age, marital status, educational level, monthly income, and employment status. These findings are largely consistent with previous studies [7,23-27,31,32]. In men, the risk of high-risk drinking was higher at relatively younger ages, among the married or the formerly married, among those with higher monthly income, and among the employed. In Korea, persons with the above-mentioned factors are more likely to become involved in social relationships, which could increase the likelihood of high-risk drinking. One additional reason why high-risk drinking was associated with these factors among men is that alcohol drinking, even if it is high-risk drinking, has not been recognized widely among Koreans to be a health risk [4,27].
Unlike the other factors, marital status showed different results for the two levels of moderate- and high-risk drinking in this study. Married or formerly married men were less likely than never-married men to engage in moderate-risk drinking; however, they were more likely to engage in high-risk drinking. In contrast to men, women who were married were less likely to report high-risk drinking. The explanation of this result might be both social and biological. The married women's drinking may be discouraged because of the women's expected roles as housewives or mothers, including child delivery and rearing and maintaining relationships with their husband and family [33]. On the other hand, employment increased alcohol consumption among the women.
The associations between high-risk drinking and health behaviors including smoking and obesity found in this study are consistent with those found in previous studies [8,9,25]. Even though causal relationships between these factors cannot be determined, these factors are highly interrelated, and health education and campaigns should be used to publicize these problems more comprehensively [25].
Contrary to expectations, high-risk drinking was associated with some positive health behaviors and health status including physical activity and good perception of self-rated health. Interestingly, this result is consistent with previous studies [25,34], which showed that heavy drinkers perceived lower health risks related to drinking than persons who drank less than them.
In men, depressive symptoms were negatively associated with low- and moderate-risk drinking, but not high-risk drinking; in women, depressive symptoms were positively associated with moderate- and high-risk drinking. Several previous studies have found that alcohol drinking was associated with poor mental health, including higher perceived stress and depressive symptoms [32-37]. These studies have suggested that high levels of stress or depressive symptoms were associated with alcohol use because alcohol was perceived to reduce tension in tension-producing circumstances [38]. In our study, the results for women were consistent with previous studies. However, the men with high levels of depressive symptoms were more likely to report non-use of alcohol than men with lower levels of depressive symptoms. Further research is needed to explain these gender differences and the associations between alcohol use and mental health among Koreans.
This study has several limitations. First, the data were self-reported. Health behaviors including alcohol drinking, smoking, and obesity may be underreported in surveys because of recall bias and social desirability bias [39,40]. Second, to ensure an adequate sample size for the KCHS, the replacement method was used when sampled households declined to participate in this survey, and this was not considered in the weight calculation for ease of computation. Third, the KCHS did not collect information from persons living in institutional settings, and so the data might not be representative of those populations. Fourth, the data were cross-sectional, which limits the ability to infer causal relations between alcohol drinking and the associated factors.
In conclusion, alcohol use, and especially high-risk drinking, is prevalent among Korean adults, which is a major public health concern. Culturally appropriate programs for specific at-risk groups (e.g., currently smoking employed men, never-married women who are employed) may be useful to reduce high-risk behaviors. However, given the large proportion of the population that is engaging in moderate-risk and high-risk drinking and given the social norms that support this behavior, public health policies and campaigns to reduce alcohol consumption targeting the entire population are indicated.
ACKNOWLEDGEMENTS
This study was supported by the research fund of Chosun University, 2012.
Notes
The authors have no conflicts of interest related to the material presented in this paper.