PM10 Exposure and Non-accidental Mortality in Asian Populations: A Meta-analysis of Time-series and Case-crossover Studies
Article information
Abstract
Objectives
We investigated the association between particulate matter less than 10 µm in aerodynamic diameter (PM10) exposure and non-accidental mortality in Asian populations by meta-analysis, using both time-series and case-crossover analysis.
Methods
Among the 819 published studies searched from PubMed and EMBASE using key words related to PM10 exposure and non-accidental mortality in Asian countries, 8 time-series and 4 case-crossover studies were selected for meta-analysis after exclusion by selection criteria. We obtained the relative risk (RR) and 95% confidence intervals (CI) of non-accidental mortality per 10 µg/m3 increase of daily PM10 from each study. We used Q statistics to test the heterogeneity of the results among the different studies and evaluated for publication bias using Begg funnel plot and Egger test.
Results
Testing for heterogeneity showed significance (p<0.001); thus, we applied a random-effects model. RR (95% CI) per 10 µg/m3 increase of daily PM10 for both the time-series and case-crossover studies combined, time-series studies relative risk only, and case-crossover studies only, were 1.0047 (1.0033 to 1.0062), 1.0057 (1.0029 to 1.0086), and 1.0027 (1.0010 to 1.0043), respectively. The non-significant Egger test suggested that this analysis was not likely to have a publication bias.
Conclusions
We found a significant positive association between PM10 exposure and non-accidental mortality among Asian populations. Continued investigations are encouraged to contribute to the health impact assessment and public health management of air pollution in Asian countries.
INTRODUCTION
Associations between air pollution and daily mortality outcomes have been well-documented by numerous studies [1-4], and it has been reported that, among the ambient air pollutants, particulate matter (PM) has shown the most consistent associations with mortality [5-7]. Thus PM10 (defined as PM less than 10 µm in aerodynamic diameter) concentration is monitored in most countries. As epidemiologic evidence is crucial for managing air pollution control-related policies, studies of the health effect of PM on the general and susceptible population at large are ongoing.
However, most air pollution studies and their recommendations have been conducted in developed countries such as North America and Europe. Therefore, there is a need for studies designed for Asian countries, with their different meteorological and socio-demographic conditions, as has been emphasized in Health Effects Institute (HEI) report [8]. Much attention has been focused on fast-developing Asian cities with rapid industrialization, urbanization, and motorization, and attempts are being made to assess the health impact of air pollution by considering their unique characteristics. The HEI has also reported that PM may also be associated with total or non-accidental mortality in Asian cities of the more developed countries.
Since its introduction in 1990, time-series analysis has been the method of choice in air pollution epidemiology. This method examines the same population repeatedly under various exposure conditions, thereby allowing for time-invariant confounders, such as age and diet, to be adjusted for. Also, the introduction of generalized additive models has enabled adjustment for the confounding effects of trends and seasonality and has boosted research on air pollution and health effect associations [9]. However, time-series analysis has also been criticized for model complexity and the possibility of producing incorrect standard errors upon correlation between nonlinear functions [10,11].
Case-crossover analysis, designed to investigate the association between intermittent short-term exposure and rare acute-onset events within close temporal proximity, provides an alternative Poisson time-regression model for studying the short-term effects of air pollution. It has the advantage of controlling time-invariant individual confounders, and by matching case and control days within a short interval of usually within 28 days or a month, time-variant confounders are also removed. Thus, both time-series and case-crossover analyses are commonly used and are viewed as competing methods in air pollution epidemiology [12].
Thus, in this study, we attempt to investigate the association between PM10 exposure and non-accidental mortality in Asian countries by including both designs in searching the literature.
METHODS
Study Selection
Literature searches were conducted using a combination of three groups of keywords: Asian country names (Korea, Japan, China, Mongolia, Thailand, Malaysia, Indonesia, Vietnam, Papua New Guinea, Philippines, Singapore, and Taiwan); PM10, as exposure; and non-accidental mortality, as outcome. Thus, using PubMed, EMBASE, and the Cochran Library, the searched keywords were [Korea OR Japan OR China OR Mongolia OR Thailand OR Malaysia OR Indonesia OR "Vietnam" OR "Papua New Guinea" OR Philippines OR Singapore OR Taiwan AND (PM10 OR "air pollution" OR particulate) AND mortality]. The study collection included all published papers until August 2012. Two authors (HYP and SB) independently evaluated the eligibility of all the studies searched by the keywords from the databases based on predetermined selection criteria, and agreement was found between the evaluators. In all the studies, daily PM10 was measured at public monitoring stations, and 24-h concentrations were provided. Non-accidental mortality data was obtained using the International Classification of Diseases (ICD)-9 (001-799) or ICD-10 (A00-R99) codes reported by a government or district institution. We only chose those results without co-pollutant effects. In the time-series studies, lag days of 0 to 1 (2 day average of lag 0 and lag of 1 day) were selected a priori according to the literature [13,14]; if a study did not have results with a lag of 0 to 1 days, results with lag days of 0 to 2 were chosen as a second option, followed by lag of 1 day.
Statistical Analysis
We obtained the relative risk (RR) and the 95% confidence intervals (CI) of non-accidental mortality per 10 µg/m3 increase of daily PM10 from each study. Our main analysis included eight studies representing each study region, and we also performed separate meta-analyses with six time-series and four case-crossover studies. For sensitivity analysis, we performed meta-analyses with all ten of the chosen studies and compared the overall estimate with the main results in eight studies.
We used Q statistics in a log odds scale with unequal weight for testing the heterogeneity of the results among the different studies, and considered a significance level of <0.1 as rejecting the null hypothesis that the studies are homogeneous. We chose a fixed effects model on observing the homogeneity among the studies, and a random effects model on observing the heterogeneity. Evaluation for publication bias was performed using Begg funnel plot and Egger test. For both tests for heterogeneity and publication bias, longitude and latitude information were used as modifiers. Meta-analyses were carried out using R software version. 2.14.2 "metaphor" package (Wolfgang Viechtbauer, Maastricht, The Netherlands).
Throughout the study process, we referred to the Meta-analysis of Observational Studies in Epidemiology guidelines.
RESULTS
Of the 819 studies searched by the keywords, 186 duplicates were removed, after which those studies not presented in English or not on human subjects were filtered. Studies with exposures other than PM10 (e.g., suspended particulate matter (SPM) and other air pollutants such as NO2, SO2, CO, O3) and mortality outcomes that did not include non-accidental mortality were excluded.
The 48 filtered studies were reviewed thoroughly, including the entire text, and the study details were recorded. The title, authors and other details of publication, study period and city/region, statistical method used, adjusted covariates, stated lag days, presentation of the results, geographical position (in longitude and latitude), and population size, if available were included. Further exclusions were carried out using the following criteria: other than time-series or case-crossover analysis (n=8), unfit population (n=7), insufficient accuracy (n=3), or overlapping dataset, period, or region (n=18). In the case of selecting studies from overlapping datasets, periods or regions, studies with results from more recent and longer periods were selected. In total, eight time-series studies [14-21] and four case-crossover studies [22-25] were finally selected for the meta-analysis (Figure 1).
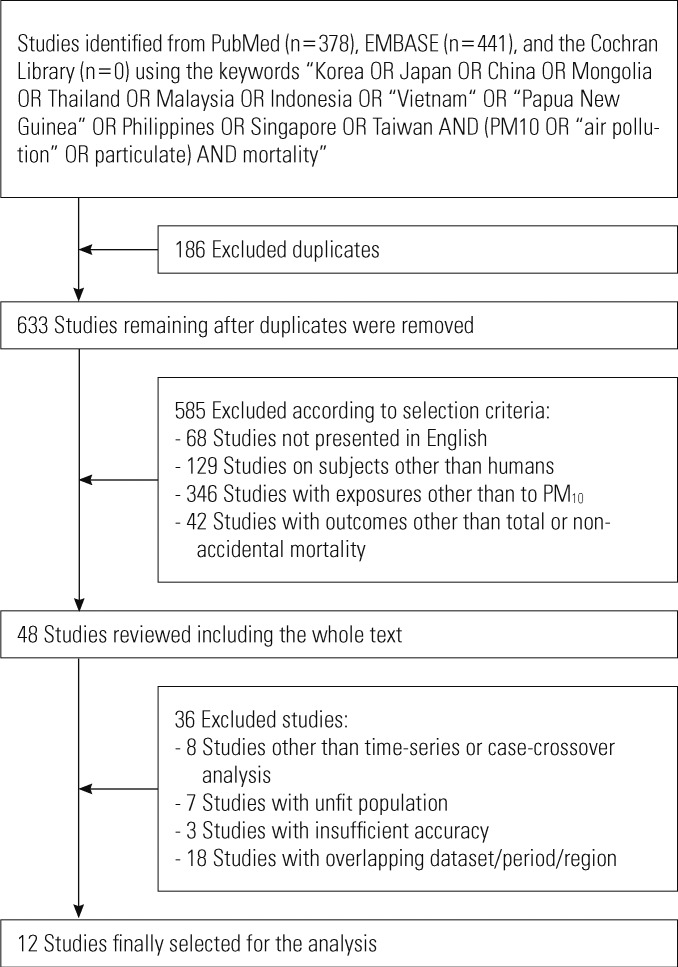
Selection process of the relevant studies for meta-analysis. PM10, particulate matter less than 10 µm in aerodynamic diameter.
Table 1 shows the main characteristics of the studies included in the meta-analysis for PM10-mortality association. We selected eight time-series studies (Wuhan, China; Shanghai, China; Seoul, Korea; Incheon, Korea; Hong Kong, China; Bangkok, Thailand; Guangzhou, China; and Tianjin, China) and four case-crossover studies (Shanghai, China; Anshan, China; Seoul, Korea; and Kaohsiung, Taiwan) for separate group analysis. For estimating the combined effect of both time-series and case-crossover studies, we excluded studies by Bae and Park [17] and Kan and Chen [22] as there was an overlap of region (Seoul and Shanghai, respectively). Studies by Yi et al. [24] and Kan et al. [16] were selected over the two excluded studies due to prioritization for recent data analysis.
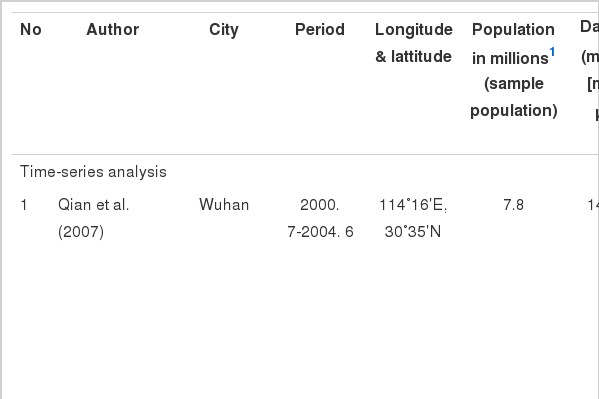
Description of the time-series and case-crossover studies used in the analysis
Before the main analysis, we tested the results from the studies for heterogeneity for each of the groups of time-series and case-crossover studies only, and both studies combined (Table 2). Statistical significance was observed for the 8 time-series studies (p<0.001), but not for the 4 case-crossover studies (p=0.65). For the combined studies, we found heterogeneity with the 10 studies for the main analysis (p<0.001) as well as all the 12 studies (p<0.001). Thus, we applied random-effects model to the time-series studies and combined analysis, and fixed-effects model to the case-crossover studies.

Meta-analysis results for the selected studies
Figure 2 shows the forest plots of (A) 10 studies for both the time-series and case-crossover studies combined and (B) the 8 time-series and 4 case-crossover studies separately analyzed and then the 12 studies all combined. All the results showed a significant positive association between PM10 exposure and non-accidental mortality (RR [95% CI]): (A) 1.0044 (1.0033 to 1.0062); (B) 1.0057 (1.0029 to 1.0086) for the time-series studies, 1.0027 (1.0010 to 1.0043) for the case-crossover studies, and 1.0044 (1.0032 to 1.0056) for all the 12 studies combined.

Forest plot of the studies used in the meta-analysis of particulate matter less than 10 µm in aerodynamic diameter exposure and non-accidental mortality: (A) 10 studies for both time-series and case-crossover studies combined; (B) The 8 time-series and 4 case-crossover studies, separated and combined. RR, relative risk; CI, confidence interval.
By symmetric Begg funnel plots and non-significant Egger tests (p=0.08) on the 12 studies, we assessed that this analysis was not likely to have publication bias (Figure 3).
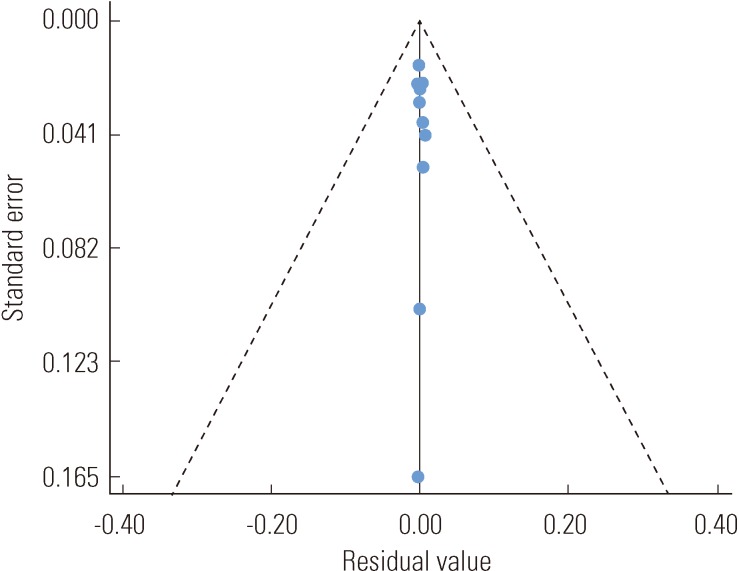
Funnel plot of all 12 of the studies in the meta-analysis.
DISCUSSION
The estimated association between PM10 exposure and non-accidental mortality in Asian countries shows a significant positive relationship, by time-series studies, case-crossover studies, and also by combined analysis. RR ranged from 1.0019 (1.0005 to 1.0033) to 1.0049 (1.0020 to 1.0077), implying that the percentage change of risk per 10 µg/m3 increase in PM10 ranged from 0.19% to 0.49%.
Although influenced by the same general trends of modernization and industrialization, socio-economic changes in Asian countries have occurred differently from North American and European countries. Asian countries have unique cultural and socio-demographic factors as well as different meteorological conditions and climate change, and therefore have important differences in outdoor air pollution exposure and susceptibility.
Evaluating the health impact of air pollution in Asian populations has been previously attempted by the Public Health and Air Pollution in Asia (PAPA) study, where they focused on the association between four air pollutants (NO2, SO2, PM10, and O3) and mortality (non-accidental, cardiovascular, and respiratory) in four Asian cities from 1996 to 2004: Bangkok (1999 to 2003), Hong Kong (1996 to 2002), Shanghai (2001 to 2004), and Wuhan (2001 to 2004) [13]. Their reported percentage change or risk per 10 µg/m3 increase in PM10, for all four cities combined, was 0.55% (0.26 to 0.85), which is larger than our estimated effect of 0.33%; however, our study covered more regions than the PAPA study and used results from studies from a more recent period except for Hong Kong, where results reported by the PAPA study were selected. The China Air Pollution and Health Effects study on association of PM10 and daily mortality in 16 Chinese cities which followed the PAPA study protocols reported that the pooled estimate for the increase in total mortality was 0.35% (0.18 to 0.52), which is similar to our results [26]. Another recently-published study that systemically reviewed the association between air pollution and health outcomes in Asia estimated the effect of PM10 on all-cause mortality from a meta-analysis of eight studies as a 0.14% (0.09 to 0.19) change in the fixed-effect summary estimate and 0.27% (0.12 to 0.42) as the random-effect [27]. This study is similar to our study with some overlapping studies, but it is limited to time-series designs only, while our study also includes a case-crossover analysis. We have also used more recent studies for Seoul and Bangkok and have included study results from the novel regions, Tianjin and Guangzhou. Our summary estimate of 0.47% (0.33 to 0.62) is comparable with these previous publications in Asia as well as reports from the United States (0.29% [0.18 to 0.40] in lag 1, 0.14% [-0.12 to 0.40] in lag 0 to 1), Canada (0.84% [0.30 to 1.40] in lag 1) and Europe (0.33% [0.22 to 0.44] in lag 1, 0.29% [0.14 to 0.45] in lag 0 to 1) [13,28].
The World Health Organization has recommended air quality guidelines based on extensive scientific review of air pollution and its health effects in order to provide useful means to protect public health worldwide [29]. As an extension to this work, the Thematic Working Group on Air Quality has been set up among Asian countries to find practical means for health impact assessment of air pollution indigenous to Asian countries. Efforts have been made to apply research results to policies, and our study may contribute to instituting guidelines for PM10 exposure levels in Asian countries.
The toxicological mechanisms for the effect of ambient air pollution, including PM10 exposure, on humans has been explained by pro-inflammatory reaction from increased free radical activity by oxidative stress, and increased plasma viscosity by stimulation of the mediators for blood coagulation [30-33]. Authors have proposed that these systemic reactions may extend to non-accidental mortality, including cardiovascular and respiratory mortality. Nonetheless, further research is needed to elucidate the exact pathological mechanism linking PM10 exposure to mortality.
Reports of studies comparing results from both time-series and case-crossover analysis have been inconsistent. While similar results have been produced in studies on total suspended particles and total mortality [34,35], a study on the association between PM10 exposure and cardiovascular mortality showed that results differed greatly with changing strata lengths [36]. Another study on the association between PM10 and hospital admissions for cardiovascular diseases also showed that results were less robust when analyzed by a case-crossover design than by using a time-series model [37]. Although with different exposures and outcomes (i.e., diurnal temperature range or extreme high temperatures and hospital admissions for cardiovascular and respiratory diseases), two other studies that compared time-series and case-crossover analyses results reported that the estimated effects showed wider CIs in the case-crossover analyses than the time-series analyses, and the superiority of effect sizes was also inconsistent [38,39].
In our results, a higher effect size was estimated from the time-series studies than the case-crossover studies, and the results were statistically significant in both groups. Due to the low number of studies used in the meta-analysis, our findings may not be the definitive supplement to comparisons of the two study designs. However, it is still meaningful to compare the two designs, not by examining the superiority of one design over another, but by merely comparing the differences in the results of the two designs.
The results from each study varied in population size, mean PM10 concentrations, and daily mortality count, and therefore the size estimate. Low levels of daily PM10 levels were reported in Hong Kong and Bangkok (51.6 µg/m3, 52.1 µg/m3), while Wuhan, Shanghai and Anshan in China reported high levels (141.8 µg/m3, 107.9 µg/m3, 110.9 µg/m3) which were still below the US Environmental Protection Agency air quality standards (24-h average of 150 µg/m3). The percentage change in non-accidental mortality per 10 µg/m3 increase in PM10 was as high as 1.3% and 1.26% in Bangkok and Guangzhou, and as low as 0.16% and even 0% in Shanghai and Kaohsiung. Although we adjusted for the longitude and latitude in our test for heterogeneity and publication bias, it should be noted that the differences in each region or city should be taken into consideration in the interpretation of the meta-analysis results.
The exposure and outcome measures used in all the studies are in agreement, i.e., they all used daily monitored data from designated monitoring stations as PM10 measurement and used death data recorded by district institutions based on ICD-9 (001 to 799) or ICD-10 (A00 to R99) classification. In terms of exposure measurement, use of environmental monitoring data may not fully represent individual exposure. The results may not be exempt from non-directional misclassification, and it is likely that the magnitude of the association may have been underestimated. Also, as some studies have found that indoor and outdoor PM10 levels are highly correlated [13], outdoor measurements, to some extent, can also represent more personalized indoor exposure. In terms of outcome measurement, studies selected for meta-analyses used either ICD-9 or ICD-10, which may have contributed to measurement bias; however, a study with a similar design and on a similar subject population investigated the influence of change in ICD coding in association between air pollution and mortality, and found that there was no significant change in the estimated effects [14].
However, there are limitations to consider in our study results. First, we excluded results with adjustments for co-pollutants from the selected studies, due to a lack of, or different combinations of co-pollutants. As the combined effect of pollutants may be different in magnitude from the effect of PM10 alone and we cannot ignore possible interaction, further investigation is recommended with more research on co-pollutant effects over time. Also, we did not analyze for cardiovascular and respiratory mortality in our analysis, although many researchers have focused on the two outcomes. Compared to total or non-accidental mortality, the death count numbers for cardiovascular or respiratory mortality are small, and the results have been inconsistent in both direction and significance on many occasions. On summation of the results in the future, meta-analysis of the outcomes is therefore needed.
The subjects in our meta-analysis were the general population living in the areas studied with ungrouped age range and socioeconomic status. However, the effect of air pollution on mortality is more conspicuous in susceptible populations such as infants, the elderly, and socially deprived groups [19,40]. While our results may be generalizable to Asian countries and especially to residents of developing Asian cities, applying our results to susceptible populations may underestimate the effects.
In conclusion, we found a significant positive association between PM10 exposure and non-accidental mortality among Asian populations, and this association was confirmed in meta-analyses of time-series studies, case-crossover studies, and both study designs combined. We encourage further investigations to contribute to the health impact assessment and public health management of air pollution in Asian countries.
Notes
The authors have no conflicts of interest with the material presented in this paper.