Changes in Air Temperature and Its Relation to Ambulance Transports Due to Heat Stroke in All 47 Prefectures of Japan
Article information
Abstract
Objectives
Changes in air temperature and its relation to ambulance transports due to heat stroke in all 47 prefectures, in Japan were evaluated.
Methods
Data on air temperature were obtained from the Japanese Meteorological Agency. Data on ambulance transports due to heat stroke was directly obtained from the Fire and Disaster Management Agency, Japan. We also used the number of deaths due to heat stroke from the Ministry of Health, Labour and Welfare, Japan, and population data from the Ministry of Internal Affairs and Communications. Chronological changes in parameters of air temperature were analyzed. In addition, the relation between air temperature and ambulance transports due to heat stroke in August 2010 was also evaluated by using an ecological study.
Results
Positive and significant changes in the parameters of air temperature that is, the mean air temperature, mean of the highest air temperature, and mean of the lowest air temperature were noted in all 47 prefectures. In addition, changes in air temperature were accelerated when adjusted for observation years. Ambulance transports due to heat stroke was significantly correlated with air temperature in the ecological study. The highest air temperature was significantly linked to ambulance transports due to heat stroke, especially in elderly subjects.
Conclusions
Global warming was demonstrated in all 47 prefectures in Japan. In addition, the higher air temperature was closely associated with higher ambulance transports due to heat stroke in Japan.
INTRODUCTION
Global warming and its relation to heat stroke have become a public health challenge in Japan as well as in many parts of the world [1]. For example, we have previously reported that positive changes in air temperature were noted in some Japanese cities such as Takamatsu [2] and Okayama [3]. We have also previously shown that the estimated change in mean air temperature was 1.8℃ for 50 years in the Takamatsu area of Kagawa prefecture, Japan [2]. However, we were not able to show the presence of the global warming at Showa base in Antarctica [4] or Hachijo Island [3]. Therefore, accurate evaluation of changes in air temperature is urgently required in various sites in Japan.
In addition, using monthly data on total ambulance transports, higher air temperature was closely associated with higher total ambulance transports in the Okayama [5] and Takamatsu [6] areas of Japan. However, whether an increase in air temperature has been noted in various other sites in Japan, and what effects this would have on ambulance transports due to heat stroke remain to be investigated.
In this study, we explored the chronological changes in air temperature in all 47 prefectures in Japan, and the relationship between air temperature and ambulance transports due to heat stroke in August 2010, by using ecological analysis.
METHODS
Meteorological Parameters
Annual meteorological parameters for all 47 prefectures of Japan for the required period were obtained from the Japanese Meteorological Agency. The observation spots (the city of the prefectural government) were centrally located. However, Hikone in Shiga prefecture and Shimonoseki in Yamaguchi prefecture were used for this analysis because these spots were thought to be traditionally central cities and long-term observation data could be obtained. Annual meteorological parameters, that is, mean air temperature (℃), the mean of the highest air temperature (℃), the mean of the lowest air temperature (℃), the highest air temperature (℃) and the lowest air temperature (℃) were used for analysis [7].
Ambulance Data
Daily incidence data of ambulance transports due to heat stroke was obtained from the Fire and Disaster Management Agency in August 2010 for the 47 prefectures of Japan [8]. In addition, we also obtained data on deaths due to heat stroke and data on the population in all 47 prefectures in 2010 from Japan's Ministry of Health, Labour and Welfare of Japan [9] and Ministry of Internal Affairs and Communications [10]. The number of ambulance transports due to heat stroke (per thousand people and per total ambulance transports [%]) was used for analysis.
Statistical Analysis
A simple correlation analysis was used to test the significance of the linear relationship among continuous variables: p<0.05 was considered to be statistically significant. From a simple regression line, we estimated the changes in air temperatures.
RESULTS
Changes in air temperature, that is, the mean air temperature, the highest air temperature and the lowest air temperature in all 47 prefectures in Japan are summarized in Tables 1-3. The mean air temperature (Table 1) was positively and significantly correlated with years in all 47 prefectures. From the regression line, a positive change in mean air temperature was the highest (1.29℃ for 30 years) in Chiba prefecture, which is located next to the Tokyo metropolitan area. The mean of the highest air temperature and mean of the lowest air temperature were also positively and significantly correlated with years in all 47 prefectures in Japan, and the estimated changes in parameters were also the highest in Chiba prefecture, Japan (data not shown).

Changes in mean air temperature in all 47 prefectures in Japan

Profiles of ambulance transports and air temperature in all 47 prefectures in August 2010, Japan
There were differences by observation year in the prefectures. Therefore, we adjusted for observation years and compared the changes in mean air temperature in all 47 prefectures (Table 2). For 33 years, positive and significant changes in mean air temperature were noted in all 47 prefectures. Estimated positive changes in mean air temperature in Table 2 were higher than those in Table 1 in each prefecture, suggesting that changes in mean air temperature seem to have accelerated in all 47 Japanese prefectures. In addition, clear differences in the changes in mean air temperatures between metropolitan areas such as Tokyo (1.13℃) and Osaka (1.10℃) and other areas of Japan were not observed (Table 2).

Changes in mean air temperature in all 47 prefecture adjusting for observation period
We investigated the link between ambulance transports due to heat stroke and air temperature (Table 3). Clinical profiles of the 47 Japanese prefectures are summarized in Table 3. The number of ambulance transports due to heat stroke was 605.3±509.9 subjects and 0.25±0.06 per thousand people, (0.28 75th percentile) in all of the 47 prefectures in Japanese prefectures taken together. Ambulance transports due to heat stroke of those over 65 (per thousand people over 65) in metropolitan areas such as Tokyo(0.35) and Osaka (0.48) were not characteristic compared with other areas. The mean air temperature was 28.9±1.2℃ (24.8-30.5).
We investigated the relationship between ambulance transports due to heat stroke and various parameters of air temperature (Table 4). Ambulance transports due to heat stroke were significantly and positively correlated with mean air temperatures, the mean of the highest air temperatures and the highest air temperatures in August 2010 in Japan in all of the subjects taken together. The correlation coefficient between ambulance transports due to heat stroke (per thousand persons) and the mean of the highest air temperatures was the highest among parameters (r=0.417, p=0.004) (Figure 1).

Simple correlation analysis between heat stroke and air temperature in all 47 prefectures in August, 2010, Japan
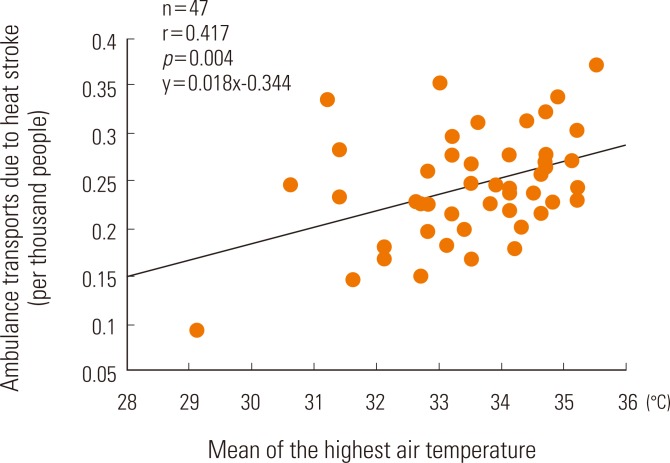
Simple correlation analysis between ambulance transports due to heat stroke and the mean of the highest air temperature in August 2010, in all 47 prefectures of Japan.
Finally, we further separately analyzed transports of subjects classified into age groups. For those 65 and over, ambulance transports due to heat stroke was significantly correlated with the highest air temperature (r=0.477) and the mean of the highest air temperature (r=0.416). However, for those under 65, ambulance transports due to heat stroke was correlated with the mean air temperature (r=0.430), mean of the highest air temperature (r=0.425), and mean of the lowest air temperature (r=0.310). Death due to heat stroke was correlated with the highest air temperature (r=0.417) in this analysis (Table 4).
DISCUSSION
In this study, we explored the changes in air temperature in all 47 Japanese prefectures and positive and significant changes in air temperature were noted and found to be accelerating. In addition, using an ecological study, it was found that higher ambulance transports due to heat stroke were closely linked to higher air temperature in all of the 47 prefectures combined.
Average temperatures are predicted to increase between 1.4℃ and 5.8℃ by the end of this century in the world [11]. On local and regional measurements, changes in land cover can sometimes exacerbate the effect of greenhouse-gas-induced warming, or even exert the largest impact on climatic conditions. Most cities are affected by a large heat island effect, registering 5℃ to 11℃ warmer than the surrounding rural areas [12]. We could not find a positive change in air temperature at Showa base in Antarctica [4] or Hachijo Island [3] in our previous reports. However, in this study, we observed positive and significant changes in air temperature in all of the 47 prefectures of Japan. In addition, the increases in air temperature seemed to be accelerating.
In some studies, a relationship between higher air temperature and heat stroke was reported. Qiu et al. [13] showed that an unusually hot days in 1999 was followed by a high mortality rate in Hokkaido, Japan. Nakai et al. [14] also reported that heat-related deaths in Japan from 1968 through 1994 and heat-related deaths were most prone to occur on days with a peak daily temperature over 38℃. Bai et al. [15] also reported that the number of subjects with unusual deaths in the summer of 1994 in Osaka of Japan was greater compared to those of previous years. We also explored, by ecological study, the link between high air temperatures and ambulance transports due to heat stroke in all subjects using data for August 2009 in Japan [16]. In this study, by an ecological study, we also found that the correlation coefficient between the mean of the highest air temperature and ambulance transports due to heat stroke in all 47 prefectures in August, 2010 was the highest. Our results in this study were almost the same as those of our previous reports [5,6,16] and the higher air temperature was critically involved in higher ambulance transports due to heat stroke. Accordingly, we found that a 1℃ increase in mean air temperatures in Japan corresponded to a 0.018 times per thousand persons increase in ambulance transports due to heat stroke in Japan. In addition, the correlation coefficient between the highest air temperature and ambulance transports due to heat stroke was the highest those 65 and over. However, under 65, the correlation coefficient between mean air temperature and ambulance transports due to heat stroke was the highest. Taken together, unexpectedly high air temperatures may be particularly difficult for the elderly.
Potential limitations still remain in this study. First, we used an ecological study. The link between ambulance transports due to heat stroke and air temperatures, which was noted in this study, may not apply for the link among individuals. We have also analyzed the link between ambulance transports due to heat stroke and air temperature in August 2009, Japan. However, the correlation coefficient between ambulance transports due to heat stroke and air temperature was higher in previous reports than that in this study by using data of 2010 [16]. Unexpectedly hot days in August 2010, and other social factors (information bias) may affect the results in this study. Second, detailed daily and individual (i.e., age and sex) data of ambulance transports due to heat stroke could not be obtained and analyzed in this study. Therefore, we could not evaluate the link between ambulance transports due to heat stroke and high air temperatures as accurately as we wished. Further ongoing studies are urgently required to prove such a link.
Notes
The authors have no conflicts of interest with the material presented in this paper.