Associations of Serum Ferritin and Transferrin % Saturation With All-cause, Cancer, and Cardiovascular Disease Mortality: Third National Health and Nutrition Examination Survey Follow-up Study
Article information
Abstract
Objectives
Even though experimental studies have suggested that iron can be involved in generating oxidative stress, epidemiologic studies on the association of markers of body iron stores with cardiovascular disease or cancer remain controversial. This study was performed to examine the association of serum ferritin and transferrin saturation (%TS) with all-cause, cancer, and cardiovascular mortality.
Methods
The study subjects were men aged 50 years or older and postmenopausal women of the Third National Health and Nutrition Examination Survey 1988-1994. Participants were followed-up for mortality through December 31, 2006.
Results
Serum ferritin was not associated with all-cause, cancer, or cardiovascular mortality for either men or postmenopausal women. However, all-cause, cancer, and cardiovascular mortality were inversely associated with %TS in men. Compared with men in the lowest quintile, adjusted hazard ratios for all-cause, cancer, and cardiovascular mortality were 0.85, 0.86, 0.76, and 0.74 (p for trend < 0.01), 0.82, 0.73, 0.75, and 0.63 (p for trend < 0.01), and 0.86, 0.81, 0.72, and 0.76 (p for trend < 0.01), respectively. For postmenopausal women, inverse associations were also observed for all-cause and cardiovascular mortality, but cancer mortality showed the significantly lower mortality only in the 2nd quintile of %TS compared with that of the 1st quintile.
Conclusions
Unlike speculation on the role of iron from experimental studies, %TS was inversely associated with all-cause, cancer and cardiovascular mortality in men and postmenopausal women. On the other hand, serum ferritin was not associated with all-cause, cancer, or cardiovascular mortality.
INTRODUCTION
Iron is a vital element for all living organisms because it is essential for many metabolic processes, such as oxygen transport, DNA synthesis, and electron transport [1]. However, redox active free iron can catalyze generation of highly reactive oxygen species, such as hydroxyl, alkoxyl, and peroxyl radicals via Fenton chemistry and Haber-Weiss reactions [2].
As an iron overload can increase the concentration of catalytically active free iron, it has been considered to be a possible risk factor of various chronic diseases including cancer and cardiovascular disease in which oxidative stress is closely involved in pathogenesis [3].
Despite the biological plausibility of the results of experimental studies, however, epidemiologic studies on associations between markers of body iron stores like serum ferritin or transferrin saturation (%TS) and mortality have yielded conflicting results [4-7]. For example, in the US general population using data from the third National Health and Nutrition Examination Survey (NHANES III), neither serum ferritin nor %TS was associated with all-cause mortality [7]. However, %TS was inversely associated with overall mortality and with mortality from cardiovascular causes in a study using earlier data from NHANES I [6], while another study using the same NHANES I data reported that subjects with a %TS ≥55% had an increased risk of all-cause mortality [5]. Other cohort studies have shown inconsistent results as well [8,9].
Interestingly, even though both serum ferritin and %TS have been commonly used as markers of body iron stores in epidemiological studies, our previous study using data from NHANES III observed that serum ferritin and %TS were differently associated with several markers of oxidative stress or inflammation [10]. For example, serum ferritin was inversely associated with several serum antioxidant vitamin levels and positively associated with C-reactive protein as an inflammatory marker, and %TS showed opposite results.
Therefore, even though a previous study reported no association of serum ferritin and %TS with mortality using data from NHANES III [7], considering the opposite associations of serum ferritin and %TS with markers of oxidative stress or inflammation in the same dataset [10], the association of serum ferritin and %TS with mortality needs to be carefully reevaluated. In particular, the previous study's design focusing on all-cause mortality among persons aged 20 years or older [7] may not be appropriate to investigate associations with mortality due to oxidative-stress related diseases because these kinds of diseases may mainly develop among the elderly or postmenopausal women. Therefore, we evaluated the associations of serum ferritin and %TS with all-cause, cancer, and cardiovascular mortality among subjects aged 50 years or older of the NHANES III dataset.
METHODS
I. Study Population
The NHANES III, conducted by the National Center for Health Statistics of the Centers for Disease Control and Prevention from 1988 through 1994, was a complex, multi-stage probability survey designed to provide national estimates of the health and nutritional status of the US civilian, noninstitutionalized population aged two months and older [11]. Of the 8654 NHANES III participants aged 50 years or older, 2959 were excluded for the following reasons: first, 1573 had missing serum ferritin or missing %TS; second, 1141 had missing covariate values; third, 2 had missing mortality follow-up data; finally, because serum ferritin and %TS status are substantially different by menopausal status, we also excluded 243 premenopausal women. The remaining 5695 NHANES III participants not having these exclusion criteria were available for the current analysis.
The NHANES institutional review board (IRB) approved the protocol for NHANES III and documented consent was obtained from all participants. A detailed description of the NHANES III IRB approval is available elsewhere [12].
II. Measurement
Data collection, quality control procedures, and laboratory methods are described in detail elsewhere [11]. Briefly, demographic characteristics and health-related information were collected using a standardized questionnaire during the in-home interview. In order to obtain physical examination data, participants visited a mobile examination center.
Serum ferritin was measured by a single-incubation two-site immunoradiometric assay (BioRad Laboratories, Hercules, CA, USA). Serum iron and total iron-binding capacity were measured by a modified automated AAII-25 colorimetric method using an RFA or RFA-300 automated ferrozine colorimetric analyzer system (Alpkem Inc., Clackams, OR, USA). %TS was calculated by dividing the serum iron concentration by the serum total iron-binding capacity and multiplying by 100.
III. Mortality Follow-up
NHANES III survey participants were followed for mortality through December 31, 2006. Mortality ascertainment is based upon the results from a probabilistic match between NHANES III and National Death Index death certificate records. Matching was based on 12 identifiers (e.g., social security number, first name, sex, and date of birth). A detailed description of the mortality linkage methodology is available elsewhere [13].
Cause of death coding for all US deaths occurring prior to 1999 follows the 9th revision of the International Statistical Classification of Disease, Injuries, and Causes of Death (ICD-9) guidelines, while that for all deaths after 1998 follows the ICD-10 guidelines. Therefore, the Underlying Cause of Death 113 Groups All Years (UCOD 113) variable was created as a recode of all deaths occurring prior to 1999 coded under ICD-9 guidelines into comparable ICD-10 based underlying cause of death groups. We used UCOD113 for the current analyses. UCOD 019 to 044 (ICD-10 code: C00-C97 and D00-D48) was defined as death because of cancer, and UCOD 054 to 075 (ICD-10 code: I00-I78 and I80-I99) was defined as death because of cardiovascular disease. A detailed description of UCOD113 is available elsewhere [14,15].
IV. Statistical Analysis
As serum ferritin and %TS status differ by gender, stratified analyses by gender were performed. Study subjects were categorized using gender specific quintiles of serum ferritin and %TS. Hazard ratios were estimated by Cox proportional hazard models. Adjusting variables were demographic characteristics, such as age in years (continuous), race-ethnicity (non-Hispanic white, non-Hispanic black, Mexican-American, and others), poverty income ratio (family income divided poverty threshold value, continuous), and years of education (continuous), and health related variables, such as smoking (never, former, and current), alcohol consumption (g/d, continuous), body mass index (BMI, kg/m2, continuous) and physical activity (none, moderate, and vigorous). We additionally adjusted for the Charlson comorbidity index (CCI, continuous). The CCI, which was developed by Charlson et al. [16], to classify comorbid conditions that might alter the risk of mortality, was found to be a valid method of estimating risk of death from comorbid disease in longitudinal studies [17,18]. Therefore, we used the CCI for adjusting for comorbidity. CCI calculation used the following data: self-reported personal disease history data by questionnaire (information on myocardial infarction, congestive heart failure, stroke, asthma, bronchitis, emphysema, arthritis, lupus, gout, stomach ulcer, liver disorder, cancer, cataract, thyroid disease, osteoporosis, dyslipidemia, gallbladder stone, kidney stone, diabetes, and hypertension); measured blood pressure and use of hypertension medication for defining hypertension; and measured plasma glucose and use of diabetic medication for defining diabetes.
All statistical analyses were performed with SAS version 9.2 (SAS Inc., Cary, NC, USA) and SUDAAN version 9.0 (RTI International, Research Triangle Park, NC, USA). Estimates of the main results were calculated accounting for stratification and clustering [19], adjusting for age, race-ethnicity, and poverty income ratio instead of using sample weights; this adjustment has been regarded as a good compromise between efficiency and bias [19,20]. As results were very similar with SAS and SUDAAN, we present the results based on SAS.
RESULTS
Demographic characteristics and health related information according to quintile of serum ferritin and %TS are shown in Tables 1 and 2, respectively. Subjects with high serum ferritin tended to have a higher BMI. In men, subjects with high serum ferritin consumed more alcohol, but there were no significant tendencies specific to the postmenopausal women. Subjects with high %TS showed tendencies opposite to those with high serum ferritin for BMI. Subjects with high %TS also consumed more alcohol, similarly to the results of ferritin. The correlation coefficients between serum ferritin and %TS were + 0.21 for both men and postmenopausal women.
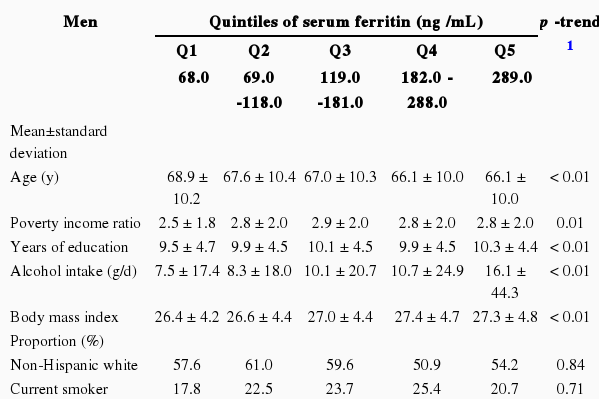
Demographic and health behavior variables of study participants according to quintiles of serum ferritin
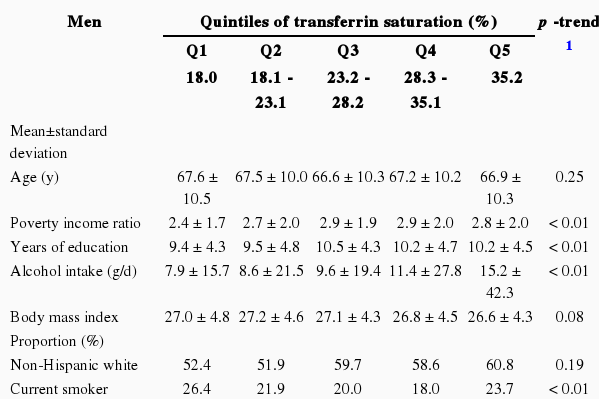
Demographic and health behavior variables of study participants according to quintiles of transferrin saturation
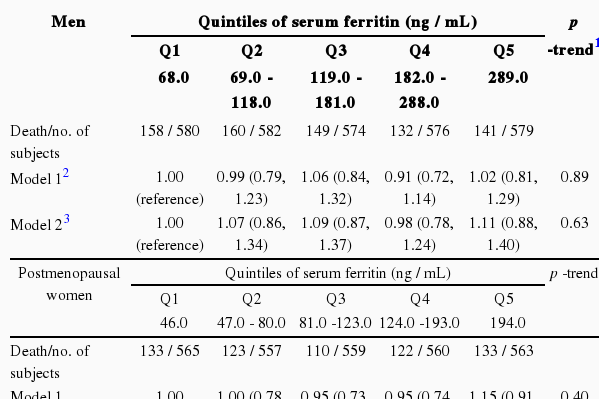
The hazard ratios for all-cause, cancer, and cardiovascular mortality are shown in Tables 3, 4, and 5, respectively. Serum ferritin was not associated with any mortality in either men or postmenopausal women. On the other hand, %TS showed strong inverse associations with all-cause, cancer, and cardiovascular mortality in men. Compared with men in the lowest quintile, adjusted hazard ratios for all-cause mortality were 0.85, 0.76, 0.76, and 0.74 (p for trend < 0.01), adjusted hazard ratios for cancer mortality were 0.82, 0.73, 0.75, and 0.63 (p for trend < 0.01), and adjusted hazard ratios for cardiovascular mortality were 0.86, 0.81, 0.72, and 0.76 (p for trend < 0.01). In postmenopausal women, %TS was also inversely associated with all-cause and cardiovascular mortality. Adjusted hazard ratios for all-cause and cardiovascular mortality across quintiles of %TS, compared with postmenopausal women in the lowest quintile, were 0.84, 0.85, 0.84, and 0.83 (p for trend < 0.05), and 0.97, 0.87, 0.76, and 0.73 (p for trend < 0.01), respectively. For cancer mortality in postmenopausal women, although a decreasing trend was not observed, the hazard ratio of the second quintile was 0.48 (95% confidence interval [CI], 0.30 to 0.76) compared with the ratio in the lowest quintile.
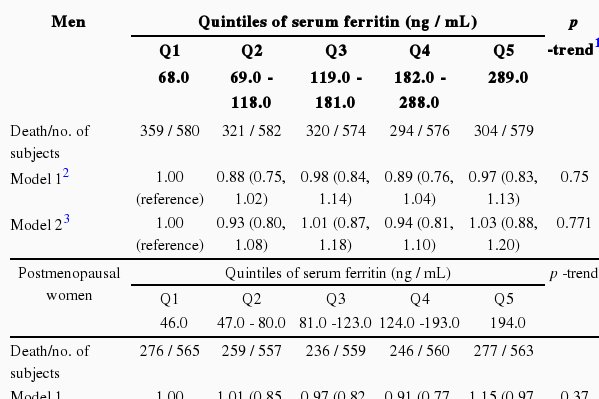
Hazard ratios (95% confidence intervals) of all-cause mortality across quintiles of serum ferritin and transferrin saturation

Hazard ratios (95% confidence intervals) of cancer mortality across quintiles of serum ferritin and transferrin saturation
Hazard ratios (95% confidence intervals) of cardiovascular mortality across quintiles of serum ferritin and transferrin saturation
DISCUSSION
In the current study, serum ferritin was not associated with all-cause, cancer, or cardiovascular mortality. As serum ferritin was positively associated with several markers of oxidative stress or inflammation in our previous study [10], we had hypothesized the positive associations between serum ferritin and mortality. However, the results did not support this hypothesis. On the other hand, consistent with the inverse associations between %TS and markers of oxidative stress or inflammation [10], %TS was inversely associated with all-cause and cardiovascular mortality in both men and postmenopausal women. Men also showed the inverse association between %TS and cancer mortality.
It is worthwhile to compare our results to those of Menke et al. [7] in more detail because both studies used the dataset from NHANES III. The lack of an association with serum ferritin was also observed by Menke et al., while the inverse association between %TS and mortality found in our study differed from the lack of association that they found. In spite of using the same dataset, the results differed primarily due to different inclusion criteria of study subjects. We analyzed only the subjects aged 50 years or older while Menke et al. analyzed the subjects aged 20 years or older. The possible harmful effect of iron that has been suspected to be caused by oxidative stress and the accumulation of oxidant-damage, which can cause chronic diseases such as cancer and cardiovascular disease or death, may require a long time. Therefore, we hypothesized that it would be more appropriate to study older persons to explore the associations between markers of iron and mortality because cancer or cardiovascular mortality are lower in young people [21,22]. In fact, the Menke et al. study [7] separately reported the results of postmenopausal women and found results similar to ours, but they interpreted the findings as being due to chance or remaining confounders. Unlike our hypothesis, however, mortality was found not to be positively associated with any marker of iron, even among subjects aged 50 years or older, but only %TS was inversely associated with mortality. In fact, the previous study reporting an inverse association between %TS and all-cause mortality using the NHANES I also had subjects aged 45 years or older [6]. At present, it is unclear why %TS inversely predicted mortality. One speculation is that moderately increased %TS may act as an antioxidant reaction through binding free iron because the generation of free radicals is caused only by catalytically active free iron.
However, one study using the data from NHANES I reported that subjects with a %TS ≥55% had an increased risk of all-cause mortality [5]. These conflicting results may be related to levels of %TS. %TS has been criticized as a poor measure of iron stores because it reflects iron stores only when it is fully depleted (%TS <16%) or fully overloaded (%TS >60%) [23,24]. From this viewpoint, only a very high %TS level can represent an iron overload and possibly increased free iron. In the current study, the cutoff points for %TS of the highest quintile in men and postmenopausal women were %TS ≥35.2% and %TS ≥30.2%, respectively. When we repeated the analyses to compare subjects with %TS ≥55% vs. < 55%, an increased risk of all-cause mortality was observed among men with an adjusted hazard ratio of 1.49 (95% CI, 1.07 to 2.08). However, risk of cancer and among subjects with %TS ≥55% (data not shown). As there were only small numbers of subjects with %TS ≥55% in this study (51 subjects in men, and 19 subjects in postmenopausal women), the association between very high %TS and mortality needs to be evaluated in future studies with a sufficient number of study subjects with %TS ≥55%.
Even though serum ferritin is used as the most reliable marker of stored iron [25], epidemiological findings on serum ferritin in relation to the risk of cancer or cardiovascular disease are inconsistent. Some studies have reported that elevated serum ferritin was associated with a high risk of cancer or cardiovascular disease [26-28] while other studies reported that there is no association between serum ferritin and cancer or cardiovascular disease [29,30]. Indeed, serum ferritin seems to be complicatedly connected with catalytically active free iron. Like transferrin, ferritin can act as an anti-oxidant by sequestering unbound or free iron [31,32]. However, there are studies showing that free iron may be more easily released and presumably more available for participation in redox reactions as ferritin iron content increases [31,33].
Our study has several limitations. First of all, even though we used serum ferritin and %TS as markers of body iron stores, iron-induced oxidative stress requires catalytically active free iron. Therefore, neither of these markers may be appropriate to reflect the levels of catalytically active free iron. As it would be practically very difficult to measure catalytically active free iron in human serum, the failure to find possible positive associations of serum ferritin or %TS should not be regarded as evidence of the lack of harmfulness of iron. Another limitation was that serum ferritin and transferrin saturation may be affected by within-individual variability even though NHANES III was conducted with a well-designed protocol and quality control to minimize flaws such as within-individual variability.
In conclusion, we found that ferritin was not associated with the risk of all-cause, cancer, or cardiovascular mortality in men or postmenopausal women aged 50 years or older while %TS was inversely associated with all-cause, cancer, and cardiovascular mortality. These results appear to show that a moderately high %TS may be protective against oxidative stress. These findings may be helpful in understanding the association between body iron and chronic disease which is related to oxidative stress.
Notes
This article is available at http://jpmph.org/.
The authors have no conflicts of interest with the material presented in this paper.