Association Between Serum Uric Acid Level and Metabolic Syndrome
Article information
Abstract
Objectives
Serum uric acid levels have been reported to be associated with a variety of cardiovascular conditions. However, the direct association between uric acid levels and metabolic syndrome remains controversial. Thus, we evaluated the association of serum uric acid levels and metabolic syndrome in a community-based cohort study in Korea.
Methods
We performed cross-sectional analysis of baseline data of 889 males and 1491 females (aged 38 to 87) who participated in baseline examinations of the Korean Genome and Epidemiology Study: Kanghwa study. Blood samples were collected after at least an 8 hour fast. Uric acid quartiles were defined as follows: <4.8, 4.8-<5.6, 5.6-<6.5, ≥6.5 mg/dL in males; and <3.8, 3.8-<4.3, 4.3-<5.1, ≥5.1 mg/dL in females. Metabolic syndrome was defined by the National Cholesterol Education Program Adult Treatment Panel III Criteria with adjusted waist circumference cutoffs (90 cm for males; 80 cm for females). The association between serum uric acid quartiles and metabolic syndrome was assessed using multivariate logistic regression.
Results
The odds ratio for having metabolic syndrome in the highest versus lowest quartiles of serum uric acid levels was 2.67 (95% confidence interval [CI], 1.60 to 4.46) in males and 2.14 (95% CI, 1.50 to 3.05) in females after adjusting for age, smoking, alcohol intake, body mass index, total cholesterol, HbA1c, albumin, γ-glutamyltransferase, blood urea nitrogen, and log C-reactive protein. The number of metabolic abnormalities also increased gradually with increasing serum uric acid levels (adjusted p for trend < 0.001 in both sexes).
Conclusions
Higher serum uric acid levels are positively associated with the presence of metabolic syndrome in Korean males and females.
INTRODUCTION
The relationship between serum uric acid levels and a variety of cardiovascular conditions have been reported since the early 1960s [1]. Metabolic syndrome is defined by a clustering of risk factors for cardiovascular disease [2,3]. An increasing prevalence of metabolic syndrome has been reported in Korea [4,5]. The higher serum uric acid level of hyperuricemia has been associated with metabolic syndrome in studies of health screenees [3,6-9] and in nationwide surveys [10,11]. However, the direct association between uric acid levels and metabolic syndrome remains controversial, and most clinical guidelines do not recommend treating asymptomatic hyperuricemia [12]. Moreover, serum uric acid levels within a normal to high range have not been fully evaluated in association with metabolic syndrome. Therefore, we evaluated the association of serum uric acid levels with metabolic syndrome in a rural population in Korea.
METHODS
I. Participants
This study is a cross-sectional analysis of baseline data of a community-based prospective cohort, which started in 2006 on Kanghwa Island, South Korea. This analysis enrolled participants who attended a health examination in 2008 or 2009 because serum uric acid testing has been available since 2008. Among the initial total of 2396 participants, we excluded 8 participants because their uric acid levels were not measured. An additional 8 participants were excluded for the following reasons: absence of systolic blood pressure (SBP) or <60 mmHg, absence of diastolic blood pressure (DBP) or <40 mmHg, absence of pulse rates or >700 beats/min or <30 beats/min, and triglycerides >1500 mg/dL. A final total of 2380 participants (male 889, female 1491) were enrolled in this study. All participants signed written informed consent forms, and the Institutional Review Board approved the study protocol.
II. Definition of Metabolic Syndrome
Metabolic syndrome was determined according to the criteria of the National Cholesterol Education Program Adult Treatment Panel III, except for waist circumference, where the Asian cutoffs were used. Thus, metabolic syndrome was defined as the presence of three or more of the following five criteria: 1) waist circumference ≥ 90 cm in males and ≥80 cm in females, 2) triglycerides ≥150 mg/dL or under treatment for elevated triglycerides, 3) high-density lipoprotein (HDL)-cholesterol < 40 mg/dL in males and < 50 mg/dL in females or under treatment for reduced HDL, 4) SBP ≥130 mmHg or DBP ≥85 mmHg or under treatment for hypertension, and 5) fasting glucose ≥100 mg/dL or under treatment for elevated glucose [13].
III. Measuring Study Variables
Detailed methods for the measurements used in the Korean Genome and Epidemiology Study: Kanghwa study were previously reported elsewhere [14-16]. Trained personnel measured the anthropometric variables according to the written protocol. Waist circumference was measured on a horizontal plane midway between the inferior margin of the ribs and the superior border of the iliac crest using a tape measure (SECA-200; SECA, Hamburg, Germany). Resting blood pressure was measured twice with at least 5 minute intervals using an automatic sphygmomanometer (Dinamap 1846 SX/P; GE Healthcare, Waukesha, WI, USA). If the difference between the first and second measurement was more than 10 mmHg, then repeated measurements were performed. The average of the last two measurements was used for the analysis. Blood samples were collected from the antecubital vein after at least an 8 hour fast. Enzymatic methods were applied to measure fasting plasma glucose, serum uric acid, triglycerides, total cholesterol, and HDL cholesterol (ADVIA 1650; Siemens Healthcare Diagnostics Inc., Deerfield, IL, USA). Serum uric acid levels were divided into separate quartiles for males and females. Sex-specific serum uric acid quartiles were used as follows: <4.8, 4.8-<5.6, 5.6-<6.5, ≥6.5 mg/dL in males; and <3.8, 3.8-<4.3, 4.3-<5.1, ≥5.1 mg/dL in females.
IV. Statistical Analysis
Prior to performing statistical analysis, the levels of triglycerides, fasting glucose, and C-reactive protein were log-transformed because of the skewed distribution. The differences between the investigated variables' means according to sex-specific serum uric acid quartiles were tested using the chi-squared test and analysis of variance. The relationships between serum uric acid levels and other variables were assessed using the Pearson's correlation coefficients. The trend test was performed to determine the trends with the number of metabolic abnormalities and prevalence of metabolic syndrome according to the serum uric acid quartile. The association between the sex-specific serum uric acid quartile and metabolic syndrome were tested using multivariate logistic regression analysis. We calculated the unadjusted and adjusted odds ratios (ORs) using the lowest quartile as the reference. In the adjusted model, we controlled age, smoking status (current smoker vs. others), alcohol intake (current drinker vs. others), body mass index (BMI), total cholesterol, HbA1c, albumin, blood urea nitrogen (BUN), γ-glutamyltransferase, and log C-reactive protein. Controlled variables were selected based on the following criteria. Age, smoking status, alcohol intake, and BMI were first selected after the literature had been reviewed, whereas sex was stratified. The variables that did not exceed 0.3 of the correlation p-value were then contained, after which the stepwise method was used. BUN was then additionally adjusted as a marker of kidney function. All statistical analyses were performed using SAS version 9.2.0 (SAS Inc., Cary, NC, USA). We used a two-tailed test, and a value of p<0.05 was considered to be statistically significant.
RESULTS
The characteristics of the study participants are summarized in Table 1 according to the sex-specific quartile of the serum uric acid levels. The age distribution was different for males and females. The higher quartiles of serum uric acid levels tended to be associated with younger ages in males, but older ages in females.

Characteristics of the participants according to serum uric acid level
I. Relationship Between Serum Uric Acid Level and Investigated Variables
Serum uric acid levels had positive correlations with waist circumference, BMI, SBP, total protein, albumin, aspartate aminotransferase, alanine aminotransferase, γ-glutamyltransferase, BUN, creatinine, log triglycerides, fasting insulin, and log C-reactive protein and an inverse correlation with HDL-cholesterol level in both sexes (Table 2). Age was negatively correlated with serum uric acid in males, but positively correlated in females. The pulse rate was positively correlated with serum uric acid in males (coefficient 0.087, p-value 0.010). However, total cholesterol, fasting glucose, and HbA1c were positively correlated with serum uric acid in females.
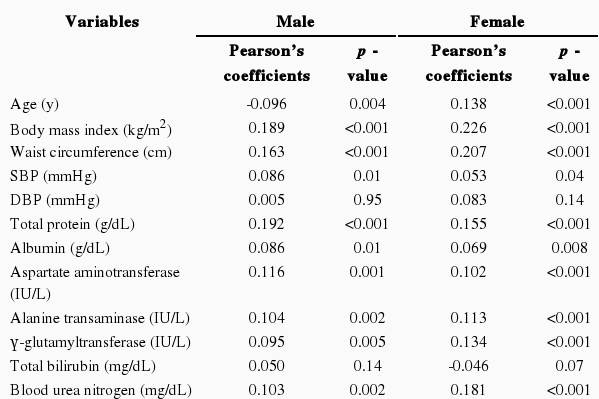
Correlation between serum uric acid and investigated variables
II. Association Between Serum Uric Acid Quartiles and Metabolic Syndrome
The number of metabolic abnormalities according to the serum uric acid quartile is shown in Figure 1. The number of metabolic syndrome components increased gradually with increasing serum uric acid quartile before (p for trend <0.001 in both sexes) and after adjustment (p for trend <0.001 in both sexes). The prevalence of metabolic syndrome also increased gradually with an increasing serum uric acid quartile before (p for trend <0.001 in both sexes) and after adjustment (p for trend <0.001 in both sexes) in Figure 2.
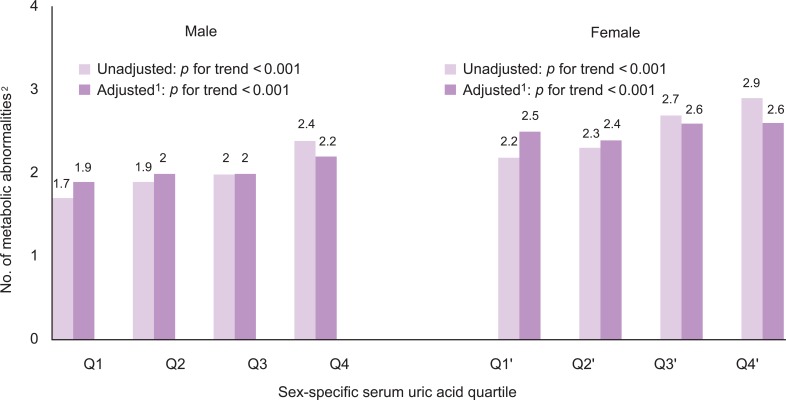
The number of metabolic abnormalities according to the serum uric acid quartile.
1Adjusted for age, smoking, alcohol intake, body mass index, total cholesterol, HbA1c, albumin, blood urea nitrogen, γ-glutamyltransferase, and log CRP.
2Number of following metabolic abnormalities: 1) waist circumstance ≥90 cm in male and ≥80 cm in female, 2) triglycerides ≥150 mg/dL or under treatment for elevated triglycerides, 3) high-density lipoprotein (HDL)-cholesterol <40 mg/dL in male and <50 mg/dL in female or under treatment for reduced HDL, 4) SBP ≥130 mmHg or DBP ≥85 mmHg or under treatment for hypertension, 5) fasting glucose ≥100 mg/dL or under.
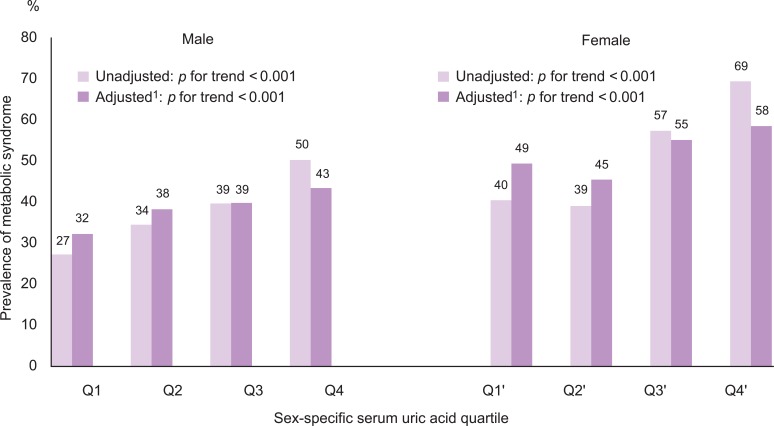
Prevalence of metabolic syndrome according to the serum uric acid quartile
1Adjusted for age, smoking, alcohol intake, body mass index, total cholesterol, HbA1c, albumin, blood urea nitrogen, γ-glutamyltransferase, and log CRP.
The highest quartile had a higher OR for metabolic syndrome than the lowest quartile after adjusting for age, smoking, alcohol intake, BMI, total cholesterol, HbA1c, albumin, BUN, γ-glutamyltransferase, and log C-reactive protein in both sexes (Table 3). Presence of metabolic syndrome significantly increased in the second, third, and fourth quartiles of serum uric acid levels in males, but at the third and fourth quartiles of serum uric acid levels in females.

The association between serum uric acid level quartiles and metabolic syndrome
DISCUSSION
We evaluated the associations of serum uric acid levels with metabolic syndrome in a rural population in Korea. We found that higher serum uric acid levels, even within the normal ranges, were associated with an increased prevalence of metabolic syndrome in both sexes even after adjusting for confounding factors.
Uric acid is the final product of purine metabolism and is excreted via the urine in higher primates [17,18]. Particularly in humans, over half of the antioxidant capacity of blood plasma comes from uric acid [18]. Reports have shown that serum uric acid levels have been increasing since 1960s in the US population, and this is possibly associated with the cardiovascular disease epidemic that has occurred over the last 100 years [19]. There is increasing evidence that uric acid plays a role in the development of metabolic syndrome. Animal studies have shown that decreasing uric acid levels may prevent or reverse the course of metabolic syndrome. One of the possible biological mechanisms is related to insulin-stimulated endothelial nitric oxide synthesis. Insulin-stimulated endothelial nitric oxide synthase (eNOS) regulates blood flow, influencing glucose uptake in skeletal muscle [1]. Animal studies have also shown that hyperuricemia caused by eNOS, and impaired eNOS, are associated with metabolic syndrome [1,20,21]. Another study showed that treatment for hyperuricemia patients improved endothelial dysfunction [1,22]. Therefore, we suggest that hyperuricemia could induce endothelial cell dysfunction and contribute to the development of metabolic syndrome. Another possible mechanism is related to inflammation and oxidative stress. Uric acid in adipocytes of obese mice induced inflammatory oxidative changes: hence the resulting development of metabolic syndrome [23-25].
Our findings are, in general, consistent with previous reports [3,6-11], but can be distinguished from them. First, our study population consisted of community-dwellers rather than institutionalized patients or health screenees, thereby potentially reducing selection bias.
Second, our study showed that higher serum uric acid levels, even within the normal ranges, were associated with metabolic syndrome. Serum uric acid levels ranged from 0.6 to 10.8 mg/dL in our participants. Most previous studies have investigated the association between frank hyperuricemia (defined as more than 6 mg/dL in females and more than 7 mg/dL in males) [1,9,10,26-28] with metabolic syndrome. Third, we investigated the association between serum uric acid level and metabolic syndrome in males and females separately, and the strength of association differed between sexes (Table 3). Fasting glucose and HbA1c were positively correlated with serum uric acid only in females, but not in males (Table 2). We cannot clearly explain these differences by sex; however, one of the possible explanations for the differences might be a nonlinear relationship between uric acid level and glucose metabolism. Serum uric acid levels have different distributions in males and females. The range of the second quartile in males (4.8-<5.6 mg/dL) is similar to that of the third quartile in females (4.3-<5.1 mg/dL). Moreover, there might be different distributions of serum uric acid levels for men and women with diabetes, prediabetes, and using anti-diabetic medication. If serum uric acid levels have non-linear relationships with diabetes or metabolic syndrome, then the direction and strength of association could be different for males and females. A previous study reported an inverse U-shaped association between fasting glucose and uric acid levels; fasting glucose levels lower than 8.0 mmol/L were positively associated with uric acid, but glucose levels higher than 8.0 mmol/L were inversely associated [29].
Because this study is limited due to its cross-sectional nature, we could not assess temporal relationships. It is also possible that residual or unmeasured confounding variables may exist. Some information was unavailable from the data used in this study, such as history of gout or kidney diseases, which might have influenced the serum uric acid levels. Therefore, we adjusted for BUN as an alternative marker of kidney function. However, further prospective investigations are required to fully understand the causal relationship between serum uric acid levels and the development of metabolic syndrome.
Our results suggest that individuals with high normal uric acid levels or asymptomatic hyperuricemia are at risk of metabolic syndrome. Intensive lifestyle modifications may be required for such individuals. Currently, most health screening examinations include a serum uric acid test, but physicians do not pay attention to uric acid levels unless the screenees have symptoms of gout. Physicians should explain the risks of metabolic syndrome or cardiovascular disease to individuals with high uric acid levels and recommend lifestyle modifications or consider preventive medical intervention.
In conclusion, higher serum uric acid levels are positively associated with the presence of metabolic syndrome in Korean males and females.
ACKNOWLEDGEMENTS
This study was supported by a grant of the Korea Centers for Disease Control and Prevention (2008-E71004-00, 2009-E71006-00) and the Korea Healthcare Technology R&D Project, Ministry of Health and Welfare, Republic of Korea (A102065).
Notes
The authors have no conflicts of interest with the material presented in this paper.
This article is available at http://jpmph.org/.