Variations in the Hospital Standardized Mortality Ratios in Korea
Article information
Abstract
Objectives:
The hospital standardized mortality ratio (HSMR) has been widely used because it allows for robust risk adjustment using administrative data and is important for improving the quality of patient care.
Methods:
All inpatients discharged from hospitals with more than 700 beds (66 hospitals) in 2008 were eligible for inclusion. Using the claims data, 29 most responsible diagnosis (MRDx), accounting for 80% of all inpatient deaths among these hospitals, were identified, and inpatients with those MRDx were selected. The final study population included 703 571 inpatients including 27 718 (3.9% of all inpatients) in-hospital deaths. Using logistic regression, risk-adjusted models for predicting in-hospital mortality were created for each MRDx. The HSMR of individual hospitals was calculated for each MRDx using the model coefficients. The models included age, gender, income level, urgency of admission, diagnosis codes, disease-specific risk factors, and comorbidities. The Elixhauser comorbidity index was used to adjust for comorbidities.
Results:
For 26 out of 29 MRDx, the c-statistics of these mortality prediction models were higher than 0.8 indicating excellent discriminative power. The HSMR greatly varied across hospitals and disease groups. The academic status of the hospital was the only factor significantly associated with the HSMR.
Conclusions:
We found a large variation in HSMR among hospitals; therefore, efforts to reduce these variations including continuous monitoring and regular disclosure of the HSMR are required.
INTRODUCTION
Measuring the quality of healthcare is a critical prerequisite for improvements to be achieved [1-3]. Among the three types of healthcare quality measures, outcome measures are of great intrinsic interest because they reflect all of the aspects of the services provided, unlike structure or process indicators [4]. Mortality is one of the most commonly used outcome measures because the data is readily available and very useful, but robust risk adjustment methodologies are required if mortality is used as a quality measure. Disease-specific risk adjustment models for mortality prediction have been developed and are available for various diseases such as cardiovascular diseases and cancers. Although disease-specific risk adjustment is useful for quality improvement in certain clinical areas, generic risk-adjustment methodology that encompasses all clinical conditions and reflects the overall quality of a hospital is more useful for hospital-wide quality improvement than disease-specific risk adjustment is.
Several generic risk-adjustment measures such as the MedisGroups and Disease Staging have been available for decades [5-7]. However, these generic measures require extensive efforts to collect detailed clinical data, thus are not widely used. In 1999, the hospital standardized mortality ratio (HSMR) was developed and is a generic risk-adjustment measure that can be calculated from administrative data [8]. After its introduction in the UK, the HSMR has been widely used in many countries including the US, Canada, and the Netherlands [9].
In Korea, disease-specific risk-adjusted mortality has been evaluated nationally for various clinical conditions such acute myocardial infarction and major cancers since 2005. However, to the best of our knowledge, hospital-wide overall mortality has never been assessed using adequate risk-adjustment methodology. Thus, we sought to measure and compare hospital inpatient mortality among Korean hospitals using HSMR methodology. Specifically, the aim of this study was to assess variations in hospital HSMRs overall and to compare hospital HSMRs across hospital characteristics and disease groups.
METHODS
Study Population
All inpatients who were discharged from any tertiary or general hospital in Korea with more than 700 beds between January 1 and December 31 in 2008 were eligible for this study. We chose 700-bed hospitals as the cutoff point for inclusion to increase the accuracy of the measured mortality rates using an adequate sample size. Sixty-six hospitals fit this description, and more than half of all Koreans admitted to a hospital have visited one of these hospitals.
Using the inpatient claims data from the National Health Insurance and Medical Aid from 2008, inpatients with conditions accounting for 80% of all inpatient deaths at these hospitals were selected. Our final study population included 703 571 patients, which includes 27 718 (3.94% of all patients) in-hospital deaths nested in 66 hospitals (Table 1). We excluded deaths due to respiratory failure, cardiac arrest, and ventricular fibrillation from the analysis because these deaths cannot be attributed to poor quality health care rather than disease characteristics. We also excluded patients who were transferred in and/or out of the hospital, those who were more than 100 years old, those who were less than 28 days old (neonates), and those who had a length of stay of less than one day or more than 365 days [9-16]. Patients admitted for palliative therapy were also excluded because their mortality correlates poorly with the quality of care received at the hospital. Patients who had inpatient claims within 7 days before or after the index admission were defined as transferred patients. We excluded transferred patients because they tended to be sicker than non-transferred patients were. According to these exclusion criteria, 2884 patients were excluded from the study population (Supplemental Figure 1).

Number of cases, fatalities, and the crude mortality rate for each MRDx
Variables
The patient outcome (alive and dead) and dates of death (if relevant), were obtained from the 2009 National Health Insurance registry. The patient characteristics required for calculating HSMRs were derived from the National Health Insurance and Medical Aid inpatient claims data. The claims data include patient demographic information such as age, gender, principal diagnosis, comorbidities, surgical procedures, and the whether admission was elective or emergency. Patient comorbidities were abstracted from secondary diagnoses codes. In addition, hospital characteristics such as academic status (academic vs. non-academic), ownership (public vs. private), bed size, and geographic location (metropolitan vs. non-metropolitan) were identified.
Hospital Standardized Mortality Ratio
The final outcome variable in this study was the HSMR, which represents hospital-wide inpatient mortality. The HSMR is the ratio of the actual number of in-hospital deaths to the expected number of in-hospital deaths, for the most responsible diagnosis (MRDx) accounting for 80% of inpatient mortality [16]. Patients were grouped according to their MRDx category using the HSMR methodology, and the Korean Classification of Diseases, 6th revision was used to map their principal diagnoses to MRDx. Among 258 MRDx of all inpatient, 29 MRDx accounted for 80% of all deaths in this study.
Using logistic regression, risk-adjusted mortality prediction models were built for each MRDx. Then, using model coefficients, the number of expected deaths was determined based on the sum of the probabilities of in-hospital death for patients from each hospital. The logistic regression models incorporated the factors affecting mortality, including age, gender, urgency of admission, income level (National Health Insurance vs. Medical Aid), and comorbidities. The Elixhauser comorbidity index was used to adjust for comorbidities [17-20]. The diagnosis related group (DRG) screening method embedded in the Elixhauser comorbidity index was used to differentiate comorbid conditions present on admission from complications that occurred during hospitalization. If the MRDx was a malignant neoplasm, variables reflecting cancer stage such as undergoing surgery, chemotherapy, and/or radiation were also included in the models. We also included principal diagnoses codes and disease-specific mortality risk factors for further risk adjustment. The predictive power of the model was assessed using the c-statistic and the fitness of the model was assessed using the Hosmer-Lemeshow (H-L) statistic [21]. To avoid over-fitting the model, the bootstrapping technique was applied to each model. In addition, 95% confidence intervals of the HSMRs were calculated using Byar’s approximation [22]. Further information about our risk-adjustment model can be found elsewhere [23].
Statistical Analyses
Variations in the hospital HSMRs across the included hospitals were assessed and their statistical significance was compared with the average HSMR, which is 100. In addition, multiple regression models were used to measure associations with hospital characteristics. To evaluate variations in hospital HSMR across different clinical conditions, we categorized hospitals into tertiles based on their overall HSMRs and the HSMRs of each MRDx group. Then, the HSMR distribution for each MRDx group across each tertile was analyzed within the tertile of the overall HSMR. Using the 6th edition of the Korean Classification of Diseases system, 29 MRDx were categorized into the following seven MRDx groups: particular infectious and parasitic diseases (A00-B99), neoplasms (C00-D48), and diseases of the circulatory system (I00-I99), respiratory system (J00-J99), digestive system (K00-K93), and genitourinary system (N00-N99) as well as injury, poisoning, and certain other consequences of external events (S00-T98). The institutional review board of Seoul National University College of Medicine (H-0910-015-296) approved this study. All data analyses were performed using SAS version 9.3 (SAS Inc., Cary, NC, USA).
RESULTS
Validity of Risk-adjusted Mortality Prediction Model
Table 2 shows the c-statistics and H-L statistics from the logistic regression models across the 29 MRDx. Except for the mortality prediction models of three MRDx, all of the models had c-statistics higher than 0.8. The c statistic was over 0.9 for five MRDx (17.2%) that included colon cancer, breast cancer, and pneumonia; between 0.9 and 0.8 in 21 MRDx (72.4%) that included acute cerebrovascular disease, acute myocardial infarction, and acute renal failure; and less than 0.8 in the remaining three MRDx (10.3%) that included poisoning, aspiration pneumonia, and congestive heart failure. However, in 14 out of 29 MRDx, the H-L statistics of these models were significant (p<0.05), which suggests poor model fitness.
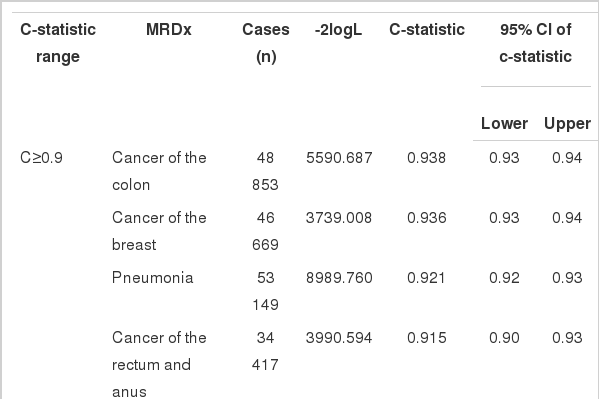
C-statistics and H-L statistics for each MRDx
Overall Variation Among Each Hospital’s Hospital Standardized Mortality Ratio
The HSMR widely varied across the hospitals included in this study (Figure 1). Of all of the hospitals, 25 (37.9%) had a significantly low HSMR and 17 hospitals (25.8%) had a significantly high HSMR. The remaining 24 hospitals (36.4%) showed an average HSMR. The highest hospital HSMR (189.0) was 4.1 times higher than the lowest HSMR was (46.0).

Caterpillar plot of the overall hospital standardized mortality ratio (HSMR) for large hospitals in 2008. Each hospital's HSMR is graphed as the upper and lower 95% confidence limits. ■17 Hospitals had a significantly high HSMR, ▲24 hospitals had a non-significant HSMR, ●25 hospitals had significantly low HSMR.
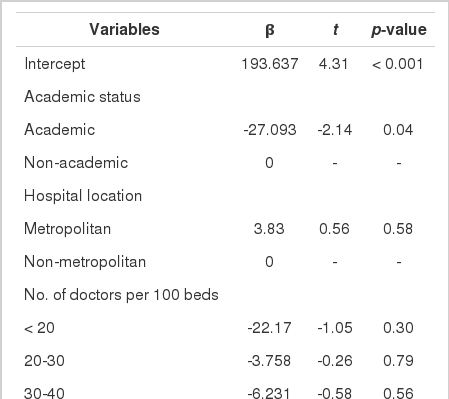
Variation Across Hospital Characteristics
The HSMR for different sub-groups of hospitals are presented in Table 3 and Supplemental Table 1. The academic status of the hospital and Medical Aid insurance status of the patients were significantly associated with HSMR; however, the other hospital characteristics such as hospital location, the number of doctors, having older age patients, having an emergency admission, having undergone surgical procedures, and having cancer patients were not related. Moreover, large variations were found among non-academic hospitals (vs. academic), public hospitals (vs. private hospitals), and hospitals with less than 800 beds (vs. those with 800 beds or more).
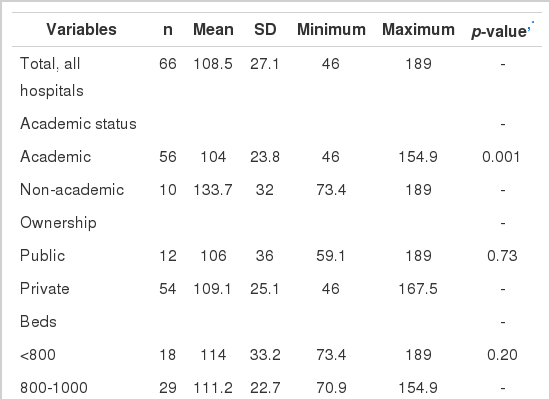
The hospital standardized mortality ratio for various hospital characteristics
Variation Across Most Responsible Diagnosis Groups
To evaluate agreement between overall HSMR and disease-specific HSMR among hospitals, hospitals were categorized into tertiles according to overall HSMR and HSMR by MRDx groups. The agreement between overall HSMR and disease-specific HSMR was limited (Table 4). In four out of seven MRDx groups, the MRDx group-specific HSMR showed fair agreement (kappa, 0.21 to 0.40) with the overall HSMR regarding the strength of the agreement. The level of agreement between the overall HSMR and HSMR by MRDx was fair and was highest among those with neoplasms (kappa, 0.682), yet lowest among those with injury, poisoning, and other external causes (kappa, 0.156).
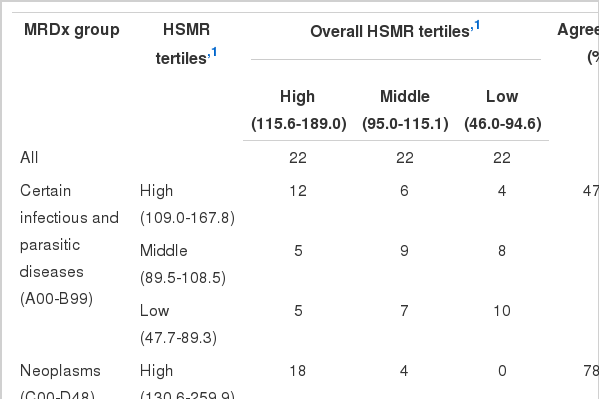
The number of hospitals across the tertiles of the standardized mortality ratio for each MRDx group
DISCUSSION
We found that the hospital HSMR among large hospitals in Korea varied greatly. The mortality of the highest HSMR was 4.1 times higher than that of the lowest HSMR. Out of the 66 hospitals, about two-thirds of them showed either significantly high or low mortality while only about one-third showed average mortality. The magnitude of variations in hospital HSMR was larger than those of previous studies were. The range of the HSMR in this study was larger (46 to 189) than that in the UK (53 to 137 in 1999), Canada (56 to 142 from 2004 to 2007), and the Netherlands (68 to 132 in 2009) [10,15,24,25]. We considered the HSMR of large hospitals in Korea only; therefore, the HSMR variation among Korean hospitals could be larger if all hospitals are compared. Hospitals with a high mortality rate should make efforts to reduce it, and at the national level, efforts should be made to decrease the large variation in the mortality rates of all hospitals.
Among hospital characteristics included in the analysis, the academic status of the hospital and Medical Aid insurance status of the patients were associated with hospital HSMR. This finding was consistent with those of previous studies. Teaching hospitals showed lower hospital mortality than non-teaching hospitals did [26-28]. In addition, Medical Aid patients generally have higher mortality rates than non-Medical Aid patients do [29,30]. However, hospital location, number of doctors, having older age patients, emergency admission, undergoing a surgical procedure, and having cancer patients were not associated with hospital HSMR. Nevertheless, hospital characteristics might differ in their association with hospital HSMR if small hospitals are added to the analysis. The hospital HSMR also showed a fair level of agreement in most MRDx groups; therefore, a hospital showing a low mortality for certain clinical conditions did not necessarily have low mortalities for other clinical conditions. For example, hospitals that had a low mortality for neoplasm tended to have a high mortality in other conditions such as digestive diseases. This finding indicates that there are disease-specific factors determining mortality in addition to generic factors and that disease-specific hospital mortality should be evaluated with overall hospital mortality. The limited agreement of hospital HSMR across the MRDx groups also suggests that disease group-specific mortality should be disclosed to facilitate targeted quality improvement effort in hospitals and informed choices among patients.
The c statistic and H-L statistic are generally used to evaluate the predictive power and robustness of risk-adjusted models. The predictive power of our mortality prediction models was high. For most models, the c statistic had excellent (0.8 to 0.9) or outstanding (≥0.9) discriminative value while only three models showed acceptable discriminative value (0.7 to 0.8). The prediction models of this study also had a better range of c statistics (0.706 to 0.938) than previous studies did. In the UK and the Netherlands, the range was 0.668 to 0.939 [31] and 0.677 to 0.957 [32], respectively. Approximately half of all mortality prediction models indicated poor fitness according to the H-L statistic. However, when mortality prediction models were rebuilt using a subset of the study population for each MRDx, the H-L statistics of the models were no longer significant except for three MRDx models. This finding suggests that the significant H-L statistics of these models might have resulted from our large sample size rather than from poor fitness.
This study has several limitations regarding use of claims data for risk adjustment. First, claims data may not be accurate enough for risk-adjusted mortality prediction because code creep in claims data has been known to be prevalent. Thus, to evaluate the accuracy of our claims data, we chose two MRDx (pneumonia and colon cancer), and then compared comorbidities obtained from the medical records of all inpatients with these diseases who were admitted at four randomly selected hospitals in our study. We found that only 6% of comorbid conditions that appeared in the claims data were not found in the medical records. Second, the DRG screening method embedded in the Elixhauser comorbidity index may not accurately differentiate comorbid conditions from complications that occurred during hospitalization. Thus, to evaluate the accuracy of the DRG screening method, we compared the results of the DRG screening with that of the medical records we reviewed using the inpatient episode to evaluate the accuracy of the claims data. We found that only 6% of comorbid conditions based on DRG screening were judged as complications according to the medical records. The rate of disagreement was 4.1% for pneumonia and 23.4% for colon cancer. However, to differentiate comorbid conditions from complications accurately, the diagnosis coding system for claims data should include flags to discern whether a disease developed before or after hospitalization [33]. Third, the predictive power of mortality prediction models using claims data may not be as robust as those made using clinical data are. Thus, to compare predictive power of the claim data based models and clinical data based models, c-statistics of the claim data based model and clinical based model (using the inpatient data) were calculated. The model based on clinical data included comprehensive risk factors such as vital signs (temperature, blood pressure, and respiration rate) and laboratory results (pH, hemoglobin, and creatinine). The c-statistic of the model based on clinical data for pneumonia was 0.005 higher than that of the model based on claims data (0.940 vs. 0.945). Because of the small sample size for this analysis, a model based on clinical data that incorporated all variables of the model based on claims data could not have been built.
This study also has several methodological limitations, which are common in studies using HSMR methodology. First, coding variations among hospitals can result in inappropriate risk adjustment [10,14,33]. Because the comorbidity index and emergency admission episodes are two important variables for risk adjustment in HSMR methodology, variations in coding practice for these variables may have a potentially large impact on the HSMR of individual hospitals. When we included the interaction term of the Elixhauser comorbidity index for each hospital and individual hospital in our mortality prediction models, the interaction terms were significant only in 20 hospitals out of the 66 total hospitals. In addition, the odds ratios were not large (0.713 to 1.382) across these hospitals with significant interaction terms. Hospitals that tend to treat emergency patients with mild symptoms may have a lower HSMR than those that tend to treat more severe emergency patients, regardless of their quality of care [14]. In this study, the emergency admission and number of transfer episodes with a 1-day length of stay had a low mortality of 2.19% compared to the overall mortality. Therefore, we included only patients who visited the emergency room if they were charged a fee for emergency medical service and had a length of stay longer than 1 day. By clearly those who visited the emergency room, we tried to minimize the potential impact of different case-mix of these emergency patients on the HSMR calculation of individual hospitals. Second, applying different mortality timeframes may result in discrepancies between the HSMR of individual hospitals, and previous studies have reported inconsistent findings regarding the consequences of applying different mortality timeframes on HSMR [34,35]. We used in-hospital mortality as the mortality timeframe because other countries have reported national HSMR using in-hospital mortality as the timeframe [9], and the c-statistics of the mortality prediction models used in calculating the in-hospital mortality timeframe were higher than those employing a different mortality timeframe were. Moreover, a patient’s cause of death post-discharge could have been unrelated to the patient’s reason for previous admission. Third, the exclusion criteria of the HSMR methodology might create a selection bias [33]. We excluded transferred patients, admissions with an extremely long length of stay, and patients older than 100 years old from the analysis. However, in our study, excluding these patients did not seem to cause a substantial selection bias because it required only approximately 0.4% of the study population (2884 out of 706 455) to be excluded from the analysis.
Notes
The authors have no conflicts of interest with the material presented in this paper.
References
SUPPLEMENTARY MATERIAL
Supplemental Figure 1.
Schematic representation of the study population selection an analysis process. LOS, length of stay; HSMR, hospital standardized mortality ratio.