The Relationship of Socioeconomic and Behavioral Risk Factors With Trends of Overweight in Korea
Article information
Abstract
Objectives:
Previous studies have shown that overweight (including obesity) has increased significantly in Korea in recent decades. However, it remains unclear whether this change has been uniform among all Koreans and to what extent socioeconomic and behavioral factors have contributed to this increase.
Methods:
Changes in overweight were estimated using data from the 1998, 2001, 2005, 2007-2009, and 2010-2012 Korea National Health and Nutrition Examination Survey (n=55 761).
Results:
Overweight increased significantly among men but not among women between 1998 and 2012. Changes in socioeconomic and behavioral factors over the time period were not associated with overall trends for both men and women. However, we found significant differences in the prevalence of overweight relative to key risk factors. For men, overweight increased at a significantly greater rate among the non-exercising (predicted probability [PP] from 0.23 to 0.32] and high-calorie (PP from 0.18 to 0.37) groups compared to their active and lower-calorie counterparts, respectively. For women, overweight increased only among the non-exercising (PP from 0.27 to 0.28) and low-income (PP from 0.31 to 0.36) groups during this period.
Conclusions:
These findings suggest that programs aimed at reducing overweight should target Korean men and women in specific socioeconomic and behavioral risk groups differentially.
INTRODUCTION
More than 1.4 billion individuals are currently overweight or obese worldwide [1]. Although increases in excess weight have been documented most extensively in Western nations, the increasing prevalence of overweight and obesity is a global problem. In the Republic of Korea (hereafter Korea), body mass index (BMI) is increasing at a rapid rate but patterns of weight change have not been uniform across society [2-5].
Increases in overweight and obesity in modern societies are often attributed to a complex interaction of environmental, social, and behavioral factors that promote the major determinants of excess body fat: higher caloric intake and less physical activity [6,7]. Despite evidence to suggest that the increasing prevalence of overweight differs by age, gender, and socioeconomic status (SES) in Korea [2-5], few studies have explored how multiple risk factors are simultaneously implicated in overweight. This study extends previous research by investigating profiles of social and behavioral factors associated with trends in Korean overweight.
Using five waves (1998 to 2012) of nationally representative data from Korea, the objectives of this study are threefold. First, we document changes in overweight (including obesity) and several key socioeconomic and behavioral factors previously linked to elevated BMI. Second, we examine the degree to which changes in these socioeconomic and behavioral factors may have accounted for changes in overweight in men and women. Third, we investigate whether increases in overweight during the last 14 years differed with these socioeconomic and behavioral risk factors.
METHODS
Data
Data were derived from five waves of the Korea National Health and Nutrition Examination Survey (KNHANES) conducted by the Korean Ministry of Health and Welfare. The KNHANES is a stratified, multistage probability sample of the civilian non-institutionalized population in Korea. Since 1998 (KNHANES I), data have been collected in 2001, 2005, 2007-2009 (hereafter referred to as 2009) and 2010-2012 (hereafter referred to as 2012) to assess the current health and nutritional status of the Korean population. The KNHANES consists of four modules—general health interview, risk behaviors, physical examination, and nutrition assessment—thus providing a comprehensive summary of the health of Koreans over time. Details of the study design, sampling, and response rates for the KNHANES I-V have been reported elsewhere [8].
The sample used for analysis includes adults aged 20 to 85 with data on weight and height obtained from the anthropometric examination (n=7935 in 1998, 6548 in 2001, 5433 in 2005, 17 014 in 2009, and 19 243 in 2011). After excluding pregnant women (n=412), the final analysis sample includes 55 761 subjects. All analyses take into account KNHANES sample weights based on primary sampling units, stratification, and respondent sampling for each interview. Human subjects approval was not required for this study because it used deidentified data that were publically available.
Measures
The main dependent variable for the study is overweight (including obesity). Body weight was measured (to the nearest 0.1 kg) using a standard balance beam scale with subjects wearing light clothing and no shoes. Height was measured using a vertical stadiometer to the nearest 0.1 cm. Based on the World Health Organization (WHO) and US National Institutes of Health conventions [9], overweight is defined by BMI ≥25 kg/m2. Preliminary analyses also examined obesity (BMI ≥30 kg/m2) as a separate outcome; however, the low prevalence of obesity in this population (2% to 4%) did not allow for robust comparisons among men and women, and associated risk factors.
Three measures of SES were included. Educational attainment was categorized as less than high school education (coded 1) and high school or more education (coded 0). Household income was categorized based on year-specific quartiles and categorized as low income (lowest quartile; coded 1) and higher income (upper quartiles; coded 0). Marital status was categorized as married (coded 0) and non-married (coded 1). Occupational status was examined in preliminary analyses but did not have explanatory power independent of education and income. Alternative categorizations for education and income were also considered but did not improve estimation. Behavioral factors were measured based on smoking, diet, and exercise. Smoking status was categorized as current smokers (coded 1) and non-smokers (coded 0); a category for former smokers did not have a significant effect and former smokers were subsequently included among non-smokers. Total caloric intake was assessed using 24-hour recall and a food intake questionnaire to quantify kcal/d. We used gender-specific quartiles to categorize high caloric intake (highest quartile; coded 1) and non-high intake (lower quartiles; coded 0). Physical activity was categorized as non-exercise (no reported exercise; coded 1) and exercise (moderate or strenuous exercise; coded 0)—with exercise defined as engaging in > 30 minutes of perceived exertion that produces increased respiration, heart rate, or sweating once per week or more [10,11]. Finally, several factors potentially confounding the association between BMI and socioeconomic and behavioral factors were included in the analyses: Age (year) was included using both linear and quadratic terms and health status was included using two measures. First, chronic disease was measured as a dichotomous variable to indicate whether subjects had ever been diagnosed with any of the following conditions: hypertension, diabetes, or heart disease. Diagnoses of cancer and chronic obstructive pulmonary disease were rare (<1%) and not included in this measure. Second, based on previous KNHANES research [12], disability was assessed by whether subjects reported any limitations in their daily activities (coded 1 if any limitation noted). An adjustment for urban/rural residence also was considered but subsequently omitted because it was not associated with the outcome.
Overall, there were few missing data for the study variables (≤3%). However, information on caloric intake and disability status was missing in approximately 14% of participants. Sensitivity analyses showed that respondents with missing data on caloric intake and disability were not significantly different in terms of BMI from respondents without missing data and including dichotomous indicators for these cases did not alter the results. Therefore, we imputed values for missing data on caloric intake and disability to their respective modal categories (coded 0) that defined the majority of the sample—categorized as non-high caloric intake (80%) and non-disabled (88%).
Statistical Analyses
Distributions of study variables are reported as weighted percentages for categorical variables and weighted means (standard errors) for continuous variables. Statistical tests for differences across year were calculated using Pearson’s chi-squared tests for categorical variables and linear regression methods for time trends in continuous variables. Age-adjusted weighted logistic regression models were used to examine changes in overweight over time. Multivariate weighted logistic regression models were then used to assess how the socioeconomic and behavioral factors mediate the associations between time and overweight.
Finally, interaction terms were included for each socioeconomic and behavioral factor by time to assess whether changes in overweight were moderated according to risk group. Comparisons were based on two-tailed tests and considered statistically significant at p<0 .05. All analyses were performed using Stata version 12.1 (Stata Corp., College Station, TX, USA).
RESULTS
Weighted distributions of the KNHANES study variables are reported for men (n=24 331) and women (n=31 430) in Table 1. Overall, the women had lower SES and fewer behavioral risk factors (with the exception of non-exercise) than the men, and changes over time are comparable: low education and non-exercising decreased from 1998 to 2012, whereas high-calorie diet, being diagnosed with chronic disease, and any physical disability increased during this period. For men, prevalence of high-calorie intake declined slightly between 1998 to 2009 and greatly increased in 2012 (19.2 to 28.7; p<0.001); low education, low income, smoking, and non-exercise showed a significant decrease over time, however, prevalence of chronic disease and physical disability increased.
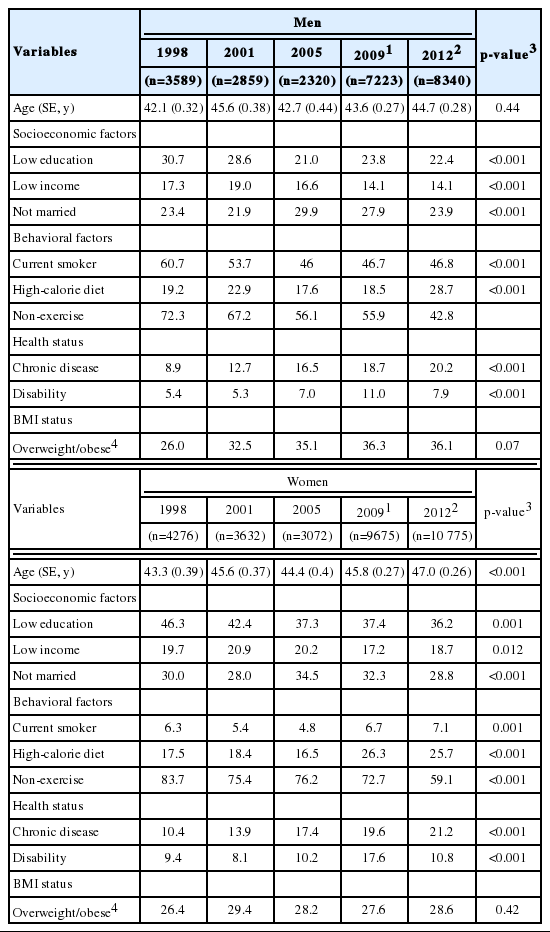
Characteristics of participants by year, Korea National Health and Nutrition Examination Survey, 1998 to 2012 (n=55 761)
Figure 1 illustrates the age-adjusted prevalence of overweight for men and women. Consistent with the unadjusted distributions reported in Table 1, the predicted probability of overweight increased significantly among men (predicted probability [PP], 0.25 to 0.35; p=0.013] but not among women (PP 0.28 to 0.28; p=0.159). After 2001, men exhibited significantly higher prevalence of overweight than women.
Predicted probabilities (95% confidence interval) of overweight (including obesity) over time by gender. Korea National Health and Nutrition Examination Survey, 1998 to 2012. p-values based on time trends using age-adjusted logistic regression models accounting for Korea National Health and Nutrition Examination Survey primary sampling units, stratification, and respondent sampling weights.
Table 2 reports adjusted odds ratios (OR) and 95% confidence intervals (CI) for changes in overweight for men and women. Results show that the prevalence of overweight increased significantly from 1998 to 2001 (OR, 1.39; 95% CI, 1.21 to 1.60), 2005 (OR, 1.49; 95% CI, 1.29 to 1.73), 2009 (OR, 1.57; 95% CI, 1.39 to 1.77), and 2012 (OR, 1.58; 95% CI, 1.40 to 1.77) in men, and was independent of changes in age and/or health status. For women, however, we found no significant increase in the prevalence of overweight over time.
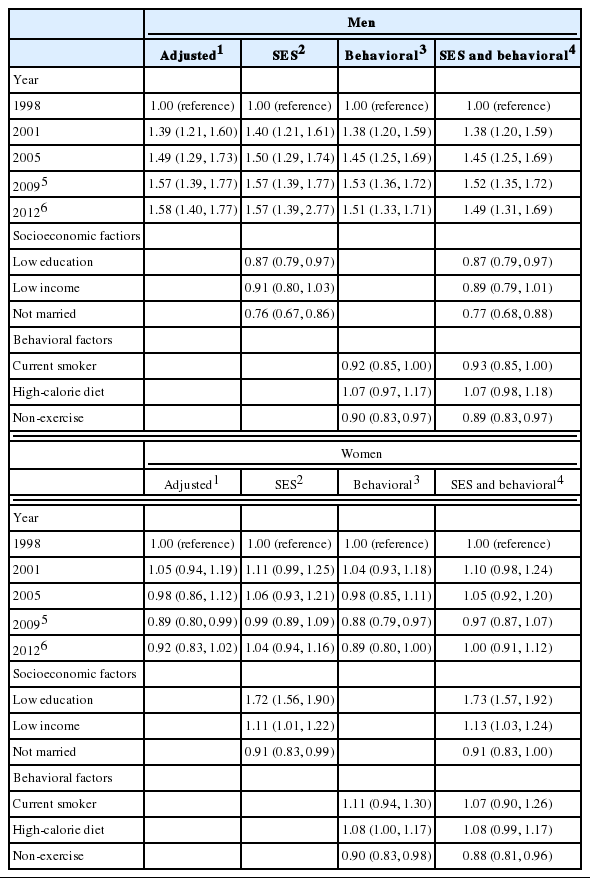
Adjusted OR (95% CI) for overweight (including obesity) over time, Korea National Health and Nutrition Examination Survey, 1998 to 2012
Being married and exercise status were associated with overweight in men, but adjustment for SES and behavioral factors only marginally attenuated the associations between time and overweight in men. Among women, all SES indicators—low education, low income and being married—were associated with overweight but did not help to explain the association between time and overweight. The prevalence of overweight was significantly lower in 2009 than 1998 when taking into account health behaviors.
Figure 2 displays the results from the statistically significant interactions tested in the full models accounting for age, health status, socioeconomic factors, and health behaviors. The prevalence of overweight increased faster among non-exercising men compared to exercising men from 1998 to 2012, whereas it increased more from 1998 to 2005 among non-exercising than exercising women, and less for non-exercising women after 2005. Men with high-calorie diets had significantly greater increases in the prevalence of overweight (primarily from 1998 to 2001) than men with non-high-calorie diets. Low-income women had significantly greater increases in the prevalence of overweight from 1998 to 2001 than non-low-income women; however, after 2001, the prevalence of overweight was stable. The prevalence of overweight declined among women who were physically active and had higher household income.
Predicted probabilities (95% confidence interval) for overweight (including obesity) over time by gender for key risk factors, Korea National Health and Nutrition Examination Survey, 1998 to 2012. Results based on signigicant interactions in the fully-adjusted logistic regression models that accounted for Korea National Health and Nutrition Examination Survey primary sampling units, stratification, and respindent sampling weights. (A) Exercise, (B) diet, (C) exercise, and (D) income.
DISCUSSION
Excess body weight is a major risk factor for chronic disease and disability and is now a global public health epidemic [13]. Overweight (including obesity) is a multifactorial condition that can be attributed to a complex combination of environmental, social, and behavioral factors. Individually, no single factor is alone responsible for causing overweight, but the complex interrelationship among them could create conditions sufficient for the current obesity epidemic. Our study reaffirms findings on sex-specific changes in the prevalence of overweight in Korea [2-5] and provides new evidence of how SES and behavioral factors are related to the increasing prevalence of overweight across time.
Using nationally representative data of Korean adults from 1998 to 2012, we examined the trends in SES, behavioral factors, and health status as well as the prevalence of overweight over time. We found increases in overweight among men but not among women, at the same time that greater increases were noted in exercise in men rather than women. However, it should be noted that we did not have detailed information on physical activity associated with work, home, and transportation in the KNHANES data. It is likely that globally, people are less active today than they were decades ago and that this decline in physical activity is a key contributor to the global obesity epidemic. Exercise, as defined in the study, represents only a small part of daily physical activity. Consistent with our findings, previous studies have shown that exercise in the form of sports and leisure activity has increased slightly over time [14-16].
After taking into account age, SES, behavioral factors, and health status, the prevalence of overweight still showed a significant increase in men, while the prevalence for women was stable. These findings are consistent with previous studies in Korea [2-4] and from other Asian countries [17,18]. However, we also showed that differences in education, household income, marital status, smoking, caloric intake, exercise, and health status could not explain these patterns for either men or women. This appears inconsistent with previous studies. An earlier study conducted by Yoon et al. [5] reported that SES was associated with overweight in both men and women after adjustment for age and behavioral factors, including exercise and diet, with an increase in the prevalence of overweight in higher-income men and less educated women. However, that study focused on a particular period of time, not on trends over time in overweight. The results of another study using serial data from 1998 to 2007 showed that higher SES was associated with overweight in men, whereas in women, lower SES was associated with overweight with no adjustment for health-related behavioral factors [4]. One possible explanation of this finding is that the relationship between SES and overweight may be influenced by behavioral factors, although we are unable to fully determine the association between behavioral factors and SES. Additional factors—social attitudes toward body shape [19,20]—may have played a role in the patterns we observed.
We also assessed whether changes in weight over time were uniform across the population. Our results suggested that increases in overweight from 1998 to 2012 in Korea differed among key socioeconomic and behavioral risk groups, with some differences in these patterns by gender. For men, increases in the prevalence of overweight were most pronounced among those with behavioral risk factors. We found that the prevalence of overweight increased significantly faster among men who did not engage in exercise and among those who consumed high-calorie diets compared to exercising men and those with lower-calorie diets. These findings are consistent with early studies that have shown the importance of maintaining a healthy lifestyle for men [21-23]. These patterns are concerning, given the context of increased exposure to processed and unhealthy foods in Korea and a built environment that facilitates convenience and discourages daily physical activity [24,25].
For women, trends in overweight were influenced by a combination of socioeconomic and behavioral factors. The prevalence of overweight increased among non-exercising women relative to exercising women during this fourteen-year period (1998 to 2012). We also found that women with low income had significantly greater increases in the prevalence of overweight from 1998 to 2012 than women with higher levels of income. Conversely, we found some evidence to suggest that the prevalence of overweight declined among women who were physically active and among those with higher household income. However, it is a noticeable finding that the prevalence of overweight increased slightly among exercising women in 2012. These countervailing trends may help explain why several studies, including this, showed no aggregate changes in the prevalence of overweight among Korean women. These results underscore the importance of identifying the socioeconomic and behavioral characteristics of women who are at increasing risk of being overweight to inform effective public health policy and practice.
A seemingly counterintuitive finding was that, in 1998, the prevalence of overweight was lower among adults who had high-calorie diets (in men), high levels of income (in women), and were sedentary (both men and women) relative to their counterparts. We suspect that this finding could be attributable to selection bias in the 1998 KNHANES data and the differences in trends in overweight by age subgroups [3].First, the sample from the 1998 KNHANES had a greater portion of men aged 20 to 39, who have a lower prevalence of overweight compared to other age groups; we assume this age group may have had a relatively higher calorie intake than older age groups. Next, an earlier study by Khang and Yun [2] that examined time trends in overweight according to age group reported that the prevalence of overweight increased significantly between 1998 and 2007 in all age groups in men (aged 20-39, 40-59, and 60 or older), whereas in women, there was no significant time trends in any age group except those aged 60 or older, who showed a significant increase in the prevalence of overweight [3]. Considering that adults aged 65 or older were economically inactive because of the Korean official retirement age and that Korean elderly women were more likely to be poor than elderly men [26], it is possible that women with lower income are at risk for overweight, as shown in our results.
Study Strengths and Limitation
Strengths of this study include the large, nationally representative sample of Korean adults, objective measures of height and weight, and the availability of numerous individual-level measures of demographic characteristics, SES, health behaviors, and health status. Despite these strengths, we also acknowledge several limitations. First, the repeated cross-sectional design of the KNHANES I-V means that it is difficult for us to draw inferences about the causal pathways between the associated risk factors and overweight. Second, as mentioned earlier, the results of this study may be influenced by selection bias. Also, response rates for KNHANES declined from approximately 85% in 1998 to 65% in 2007 and may have underestimated the prevalence of overweight in women and disadvantaged groups [27]. Finally, there may have been measurement errors in the assessment of physical activity (over-reporting) and caloric intake (under-reporting) that could decrease the observed associations between these risk factors and overweight. It should also be acknowledged that these two behavioral factors are crudely measured. Therefore, we remain cautious in our conclusions from this study and await further research to validate the findings.
This study provides the first evidence of how changes in the prevalence of overweight have been associated with the changes in SES and health behaviors in Korean men and women between 1998 and 2012. We found that factors such as education, income, smoking, caloric intake, and exercise could not account fully for the changes in the prevalence of overweight. However, increases in the prevalence of overweight occurred disproportionately among specific risk groups in both men and women. Although the prevalence of obesity is still low among Korean men and women (about 4%), results from this study suggest that further long-term prospective cohort studies with multiple risk factors, measured with finer instruments, are required to better understand the complex mechanism of obesity and develop effective health care for overweight and obesity.
ACKNOWLEDGEMENTS
We thank the Korea Centers for Disease Control and Prevention for providing the data and Dr. Young-Ho Khang for consultation on statistical analysis. We also thank the Duke Division of Community Health for allowing time for this work.
Notes
Conflict of Interest
The authors have no conflicts of interest associated with the material presented in this paper.