Replication of Early B-cell Factor 1 (EBF1) Gene-by-psychosocial Stress Interaction Effects on Central Adiposity in a Korean Population
Article information

Abstract
Objectives
Central obesity plays a major role in the development of many chronic diseases, including cardiovascular disease and cancer. Chronic stress may be involved in the pathophysiology of central obesity. Although several large-scale genome-wide association studies have reported susceptibility genes for central adiposity, the effects of interactions between genes and psychosocial stress on central adiposity have rarely been examined. A recent study focusing on Caucasians discovered the novel gene early B-cell factor 1 (EBF1), which was associated with central obesity-related traits via interactions with stress levels. We aimed to evaluate EBF1 gene-by-stress interaction effects on central adiposity traits, including visceral adipose tissue (VAT), in Korean adults.
Methods
A total of 1467 Korean adults were included in this study. We selected 22 single-nucleotide polymorphisms (SNPs) in the EBF1 gene and analyzed their interactions with stress on central adiposity using additive, dominant, and recessive genetic modeling.
Results
The four SNPs that had strong linkage disequilibrium relationships (rs10061900, rs10070743, rs4704967, and rs10056564) demonstrated significant interactions with the waist-hip ratio in the dominant model (pint<0.007). In addition, two other SNPs (rs6556377 and rs13180086) were associated with VAT by interactions with stress levels, especially in the recessive genetic model (pint<0.007). As stress levels increased, the mean values of central adiposity traits according to SNP genotypes exhibited gradual but significant changes (p<0.05).
Conclusions
These results suggest that the common genetic variants for EBF1 are associated with central adiposity through interactions with stress levels, emphasizing the importance of managing stress in the prevention of central obesity.
INTRODUCTION
Obesity is a major public health issue, as it increases the likelihood of developing chronic diseases such as type 2 diabetes, hypertension, coronary heart disease, and certain types of cancer [1-3]. In particular, central obesity, as measured by waist circumference (WC) and the waist-to-hip ratio (WHR), has been shown to play an important role in the etiology of cardiovascular disease and cancer mortality, independently of overall obesity [4].
Central obesity is closely related to psychosocial stress. Several studies have demonstrated significant relationships between chronic stress, eating behaviors, and central obesity [5-7]. In a previous study using a rat model, moderate or severe stress was associated with reduced chow intake [5]. However, chronic stress increased the intake of comfort foods, such as fat-laden and sugar-laden foods, resulting in weight gain or central obesity [7]. In human studies, similar tendencies to consume more palatable or energy-dense food items under stressful conditions have been reported [6]. The synergistic effect between chronic stress and high-fat or sweet food intake plays a prominent role in the development of visceral obesity [8]. In addition, prolonged or repetitive stress results in sustained glucocorticoid release, which promotes the accumulation of abdominal fat, especially visceral fat [9].
Central adiposity is influenced by genetic factors, including multiple genes, gene-environment interactions, and environmental exposure. To date, several large-scale genome-wide association studies have identified various causal genes for central adiposity traits [10-13]. However, most studies have focused only on the main effects of genes, without considering interactions with environmental factors such as stress. Recently, Singh et al. [14] performed the first genome-wide gene-by-stress interaction study in multiple ethnic groups, and identified a novel gene, early B-cell factor 1 (EBF1), which influenced central obesity and cardiovascular disease in Caucasians. They reported that the interaction effect between EBF1 and psychosocial stress was the strongest for central obesity-related traits, including hip circumference (HC). However, significant interactions of EBF1 were not observed in other ethnic groups, including Chinese-Americans and Blacks. This can be explained by several factors, including differences in genetic architecture, allele frequency, and low statistical power due to a small sample size.
Therefore, this study aimed to characterize EBF1 gene-by-stress interaction effects on central adiposity-related traits in Korean adults. We comprehensively assessed the interactions of EBF1 with three central adiposity phenotypes, including WC, WHR, and visceral adipose tissue (VAT), and provided the first replication of the interaction between the EBF1 gene and psychosocial stress in an Asian population.
METHODS
Subjects
This study used data from the fourth follow-up (2009-2010) of the Ansan cohort in the Korean Association Resource project [15], which is part of the Korean Genome Epidemiology Study. First, a total of 1489 subjects with VAT information measured by computed tomography (CT) were selected. Of these, we eventually included 1467 subjects who had additional phenotypic data, such as anthropometric measures and psychosocial stress levels. The plan and protocol for this study were approved by the institutional review board of Seoul National University (approval no., E1502/001-012).
Phenotypes
Anthropometric data for abdominal obesity-related traits such as WC and HC were collected, and the WHR was calculated by dividing WC by HC. VAT measured by CT was included to accurately assess regional abdominal fat. The psychosocial stress of the study subjects were measured using the Psychosocial Well-being Index Short Form (PWI-SF), which contains 18 questions. The score of each item ranges from zero to three, and the total score of PWI-SF is calculated by adding the scores assigned to each item, with the highest possible score being 54. Higher scores represent higher levels of psychosocial stress. Subjects with PWI-SF scores under nine, from 9 to 27, and greater than 27 were defined as groups under low, moderate, and high stress, respectively.
Single-nucleotide Polymorphism Selection
The single-nucleotide polymorphisms (SNPs) used for this study were genotyped using the Affymetrix genome-wide human SNP array 5.0 (Affymetrix Inc., Santa Clara, CA, USA). We initially selected 51 SNPs that were located in the EBF1 gene, and excluded SNPs with a minor allele frequency (MAF) <0.1 or Hardy–Weinberg equilibrium (HWE) p-value<0.05. A total of 22 SNPs were finally included in this study. Most SNPs reported by Singh et al. [14] were included in our initial Affymetrix genome-wide human SNP array 5.0 data, but these candidate SNPs were excluded in the final analyses because they had a low MAF (MAF ≤0.04).
Statistical Analysis
VAT and WHR values were normalized by square root and inverse normal transformations, respectively. Differences between the mean and frequency of a variable by gender were tested using the two-sample t-test and the chi-square test. All statistical analyses were performed with SAS version 9.3 (SAS Institute Inc., Cary, NC, USA). The HWE values of 51 SNPs for the EBF1 gene were tested using the --hardy option in PLINK version 1.9 [16]. Multiple linear regression analyses with the interaction item G×E were performed to identify the interactions between the EBF1 SNPs and stress on central adiposity. All analyses for interactions were performed using PLINK version 1.9 [16]. These results were adjusted for covariates such as age and gender, and were generated under additive, dominant, and recessive models. In addition, we carried out a stratified association analysis by genotype of the significant SNPs. For the threshold of statistical significance, we considered both the nominal cut-off value (pint<0.05) and the Bonferroni correction using the number of independent linkage disequilibrium (LD) blocks (pint<0.05/7 [#LD blocks+#independent SNPs]=0.007) because the general Bonferroni method using the number of tested SNPs may have been very stringent (data not shown). The LD plot was assessed using Haploview version 4.2 [17].
RESULTS
Table 1 presents the characteristics of the study subjects. This study included a total of 1467 individuals, with a mean age was 56 years (range, 44 to 77 years). The mean age of males (55.77±7.0 years) was significantly lower than that of females (57.31±7.8 years) (p<0.001). Males had higher levels of all central obesity-related phenotypes than females except HC (all p<0.05). The levels of psychosocial stress significantly differed between males and females (p=0.001), and the proportion of females (18.0%) in the high-stress group was higher than that of males (12.2%).
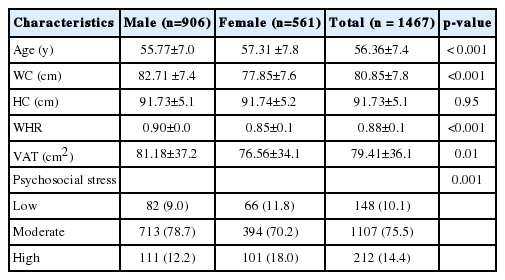
Characteristics of study subjects
The genetic information of the selected 22 SNPs in the EBF1 gene is shown in Table 2. One SNP (rs1368298) was located in the coding region of the EBF1 gene, and the others were located in the introns. The MAFs of these 22 SNPs ranged widely from 0.12 to 0.48.

The list of the 22 SNPs selected for the EBF1 gene
The interaction results of the SNPs that were significant in the regression analysis are shown in Table 3 (pint<0.05). A total of 15 SNPs showed nominally significant interactions with at least one central adiposity trait, while five and nine SNPs showed nominal interactions for WC and WHR, respectively. Of these, four SNPs (rs10061900, rs10070743, rs4704967, and rs10056564) were significantly associated with WHR after Bonferroni adjustment (pint<0.007) in the dominant genetic model. With regard to VAT, 11 SNPs had a nominal interaction with at least one genetic model, and two SNPs (rs6556377 and rs13180086) with strong LD relationships were significantly associated with VAT, interacting with stress (pint<0.007). Significant SNPs-by-stress interaction effects on WHR were found in the dominant genetic model, whereas significant results for VAT were observed in the additive and recessive genetic models.
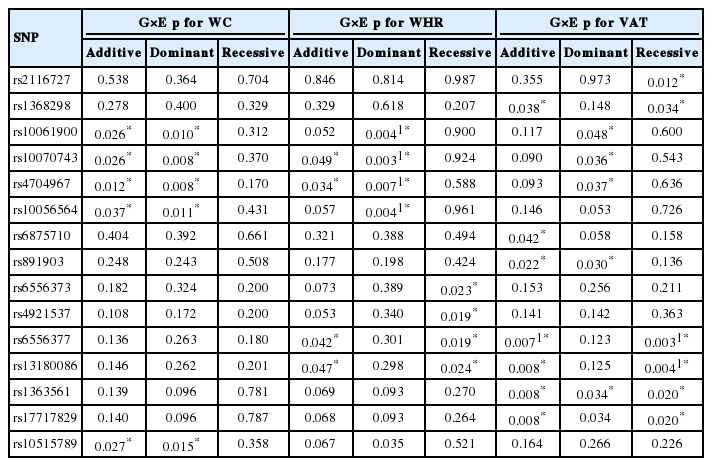
Results of 15 SNPs with significant results for interactions with psychosocial stress affecting central adiposity
We compared the mean values of central adiposity traits according to the genotypes of significant SNPs and psychosocial stress levels (Figure 1). In addition, the significance of associations stratified by the genotypes of these SNPs is presented in Figure 1. Under high stress levels, the mean value of WHR in subjects with TT or TC genotype of rs10070743 was higher than that of subjects with the CC genotype (Figure 1A; p for TT/TC genotype=0.01). As stress levels increased, the mean value of VAT in the major allele carriers (CC/TC) of rs6556377 gradually increased (Figure 1B, p for CC/TC genotype=0.004). However, the association between stress level and VAT in the homozygous minor allele (TT) was not statistically significant (p for TT genotype=0.08), despite the tendency for stress to have a negative effect on VAT.
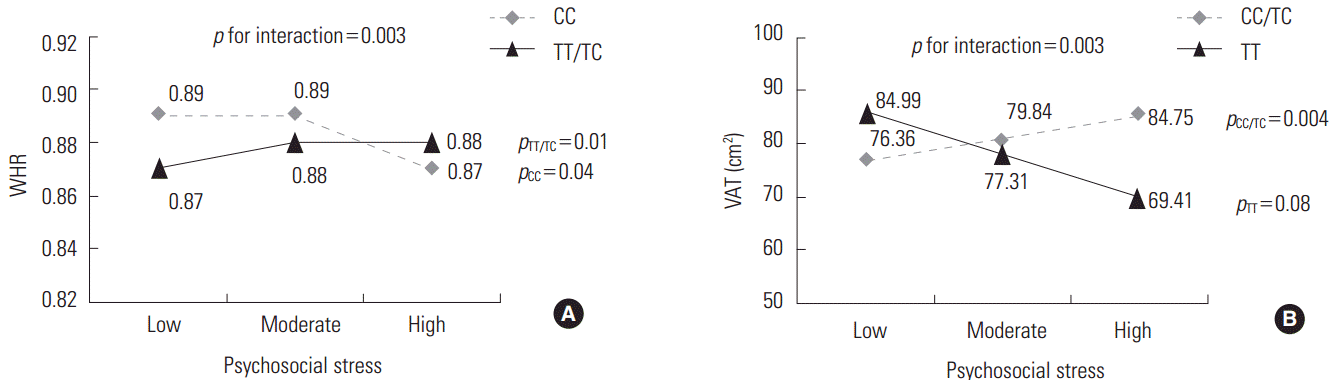
Mean values of central obesity-related phenotypes according to the genotypes of significant single-nucleotide polymorphisms and psychosocial stress levels. (A) Mean values for the waist-hip ratio (WHR) by the rs10070743 genotype under the dominant model (TT/TC vs. CC). (B) Mean values for visceral adipose tissue (VAT) by the rs6556377 genotype under the recessive model (CC/TC vs. TT).
DISCUSSION
This study aimed to clarify the effects of EBF1 gene-by-stress interactions on central adiposity traits, including WC, WHR, and VAT, in a Korean population. We found that 15 SNPs of EBF1 interacted with stress to a significant extent with regard to one or more central adiposity traits at the nominal level of 0.05. Of these SNPs, the interaction effects of six SNPs were statistically significant for at least one central adiposity-related phenotype after applying Bonferroni’s correction (pint<0.007). Furthermore, as stress levels increased, considerable changes in the mean values of central adiposity traits were observed with regard to the significant SNPs. Our results support the results of the study of Singh et al. [14], showing independent replication of EBF1 gene-by-stress interaction effects on central adiposity in a Korean population.
EBF1, which is a member of the EBF gene family, is widely expressed in many tissues, such as B lymphocytes, bone marrow, olfactory neurons, and adipocytes. In particular, EBF1 plays an important role in promoting adipogenesis in 3T3-L1 cells [18]. Interestingly, in 2010, one study based on a mouse model discovered that concentrations of leptin were significantly reduced in EBF1 knockout mice [19]. Leptin produced in adipocytes is an essential hormone for the prevention of obesity because it regulates energy expenditure, appetite, and metabolism, and deficits of this hormone result in the development of obesity. In general, serum leptin levels are increased by emotional stress [20]. However, stress simultaneously promotes the release of glucocorticoids, thereby inducing leptin resistance [21]. In brief, psychosocial stress causes overeating despite increased leptin levels by disrupting the control of appetite by the leptin system. Therefore, under high stress levels, the rs10070743 variant of EBF1 may influence the leptin system and leptin levels, resulting in central obesity. In addition, this study identified that homozygous minor allele carriers (TT) of rs6556377 had a negative association between stress levels and visceral fat area, although the effect of stress on VAT in TT genotype group was not significant (p=0.08). Therefore, we cannot rule out the possibility that some minor variants of the EBF1 gene may be involved in the mechanism responsible for stress-induced weight loss, such as inhibitory effects on food intake via the corticotropin-releasing factor system. However, further studies on coding non-synonymous SNPs are needed to identify the precise functional role of EBF1 genetic variants in stress-induced central obesity.
Genetic variants of the EBF1 gene have been linked to various chronic diseases. A large-scale meta-analysis in Europe reported a significant association between breast cancer and the intron variant rs1432679 of the EBF1 gene [22], and this variant was associated with an increased risk of triple-negative breast cancer [23]. Furthermore, the variant, rs11953630, which is located in the intergenic region of EBF1, was significantly associated with systolic blood pressure (BP), diastolic BP, hypertension [24], and orthostatic hypotension [25]. A recent study showed age-dependent effects of the EBF1 SNP (rs7733138) on BP regulation [26]. In addition, a fine-mapping study under the linkage peak on chromosome 5q31 demonstrated that SNPs of the EBF1 gene were associated with low density lipoprotein-cholesterol levels and coronary artery disease, suggesting a potential role of EBF1 in modulating lipid metabolism and adiposity [27].
The present study has several limitations. Candidate SNPs for replication were widely considered within the region of the EBF1 gene, because those reported by Singh et al. [14] did not meet our inclusion criteria (MAF ≥0.1). Based on the HapMap data, the MAFs of these SNPs are considerably lower in Asian populations (MAFs=0.01, Japanese) than in European populations (MAFs=0.07, Caucasian), and the MAFs of these SNPs in our sample were also low (MAFs ≤0.04). For the interaction analyses, we selected common SNPs with a MAF >10% to avoid a low statistical power caused by a small sample size and a low MAF of the variants. Singh et al. [14] observed no significant interactions in other ethnic groups, including Chinese-Americans (n=548), and these results may be explained to some extent by ethnic differences in allele frequencies and the small sample size. Moreover, due to the unavailability of other metabolism-related phenotypes, this study focused only on central adiposity traits because these traits showed the strongest interaction effects in the previous study conducted by Singh et al. [14].
Despite these limitations, our study had several new aspects. First, we comprehensively assessed the interactions of central adiposity with all possible genetic models (additive, dominant, and recessive). Stronger interaction effects for WC and WHR were detected in the dominant genetic model than in the addictive model. On the contrary, interaction effects for VAT were statistically significant in the additive or recessive model, but not in the dominant model. This enabled us to identify additional SNPs that might be missed in an additive genetic model. Second, we assessed visceral fat, as well as WC and WHR, which are the most common methods of measuring central obesity. Intra-abdominal adiposity is well known as an independent risk predictor of metabolic and cardiovascular disease. Consequently, significant EBF1 gene-by-stress interaction effects were found for central adiposity-related phenotypes such as WHR and VAT, even though we found no significant interaction in the HC phenotype, which showed the highest level of significance in the study performed by Singh et al. [14] (data not shown). Notably, the SNPs significant for VAT were different from those that had a significant effect on WHR, and the mean changes by stress level in the genotypes of significant SNPs were greater than those affecting different central adiposity traits. Our study showed that the interaction effects between major alleles of EBF1 SNPs and stress levels were significantly associated with visceral obesity, independently of abdominal obesity assessed by WC and WHR.
In conclusion, we aimed to identify EBF1 gene-by-stress interaction effects on central adiposity traits, including VAT, in a Korean population. We replicated previous evidence, finding that the common SNPs of EBF1 interacted with psychosocial stress to contribute to the development of central obesity.
ACKNOWLEDGEMENTS
This study was provided with biospecimens and data from the Korean Genome Analysis Project (4845-301), the Korean Genome and Epidemiology Study (4851-302), and the Korea Biobank Project (4851-307, KBP-2015-019), which were supported by the Korea Centers for Disease Control and Prevention, Republic of Korea. This work was supported by the Basic Science Research Program through the National Research Foundation of Korea (NRF) funded by the Ministry of Education, Science and Technology (grant no. 2015R1A1A3A04000 923, 2015R1D1A1A01057619, and 2015R1D1A1A01059048). This work was supported by the Education and Research Encouragement Fund of Seoul National University Hospital (2016).
Notes
CONFLICT OF INTEREST
The authors have no conflicts of interest associated with the material presented in this paper.