Distribution and Determinants of Out-of-pocket Healthcare Expenditures in Bangladesh
Article information

Abstract
Objectives
As in many low-income and middle-income countries, out-of-pocket (OOP) payments by patients or their families are a key healthcare financing mechanism in Bangladesh that leads to economic burdens for households. The objective of this study was to identify whether and to what extent socioeconomic, demographic, and behavioral factors of the population had an impact on OOP expenditures in Bangladesh.
Methods
A total of 12 400 patients who had paid to receive any type of healthcare services within the previous 30 days were analyzed from the Bangladesh Household Income and Expenditure Survey data, 2010. We employed regression analysis for identify factors influencing OOP health expenditures using the ordinary least square method.
Results
The mean total OOP healthcare expenditures was US dollar (USD) 27.66; while, the cost of medicines (USD 16.98) was the highest cost driver (61% of total OOP healthcare expenditure). In addition, this study identified age, sex, marital status, place of residence, and family wealth as significant factors associated with higher OOP healthcare expenditures. In contrary, unemployment and not receiving financial social benefits were inversely associated with OOP expenditures.
Conclusions
The findings of this study can help decision-makers by clarifying the determinants of OOP, discussing the mechanisms driving these determinants, and there by underscoring the need to develop policy options for building stronger financial protection mechanisms. The government should consider devoting more resources to providing free or subsidized care. In parallel with government action, the development of other prudential and sustainable risk-pooling mechanisms may help attract enthusiastic subscribers to community-based health insurance schemes.
INTRODUCTION
In many low-income and middle-income countries such as Bangladesh, out-of-pocket (OOP) payments by patients or their families are a key healthcare financing mechanism. The OOP share of total health expenditures increased from 55.9% in 1997 to 59.9% in 2005 and 63.3% in 2012 according to the latest national survey of health expenditures [1-3]. Reliance on OOP expenditures for health services leads to a catastrophic burden for many households in Asia, including Bangladesh. Globally, 100 million individuals have been pushed into poverty because of OOP expenditures [4,5], and millions more cannot utilize health services or suffer financial hardship because the provision of healthcare is conditional on direct payments by the patient at the point of service delivery [6]. Countless households find themselves in a position where they have to borrow money, sell assets, or divert resources from other needs to seek healthcare. Indeed, high OOP payments, the absence of risk-pooling mechanisms, and a high degree of poverty can result in profound and catastrophic financial shocks to vulnerable households. Some earlier studies have also found healthcare expenditures to be closely linked to family income and highly correlated with low-income status [7-11]. Higher public expenditures and better risk-pooling mechanisms have been identified as important financing mechanisms to avert the financial hardships associated with paying for health care [12,13]. In this situation, knowing the determinants of OOP payments may be important for developing an effective health policy since doing so would help to understand the different characteristics of individuals and households that influence barriers to the utilization of healthcare due to the absence of financial risk protection. Many factors, such as the availability of health services, financial resources, community support, perceived and actual needs for healthcare, and patient satisfaction etc., may contribute to healthcare utilization, which might be reflected in overall OOP payments at the individual and/or household level [1,11,14, 15]. Household characteristics, such as being headed by an elderly or disabled person and having a member suffer from any chronic disease; have been associated with high OOP expenditures for healthcare [16]. For this reason, OOP payments are considered to be the most inequitable of all possible financing mechanisms, especially for the poor [17]. Therefore, policy-makers may need to recognize the characteristics that make individuals and households more vulnerable to high OOP payments. The objective of this study was to focus on whether and to what extent socioeconomic, demographic, and behavioral factors of the population had an impact on OOP expenditures in households in Bangladesh.
METHODS
Data and Variables
The present study used data from the Household Income and Expenditure Survey (HIES) 2010, conducted by the Bangladesh Bureau of Statistics [18], an apex organization of the Ministry of Planning of Bangladesh. The HIES is a national-level survey in which the various districts of Bangladesh are represented. The sampling technique, survey design, survey instruments, measuring system, and quality control have been described elsewhere [18]. The data collection was done from February 1, 2010 to January 31, 2011. A total of 12 240 households were selected, with 7840 from rural areas and 4400 from urban areas. Among the selected households, a total of 55 580 individuals were interviewed, with 35 894 interviews done with individuals from rural areas and the rest from urban areas. In brief, the survey provided socioeconomic data at the household level, including family earnings, consumption and expenditures, assets, housing conditions, as well as individual-level data on demographic variables (age, sex, and marital status), education, employment, health, disability, and other information. This analysis considered both household and individual data. Wealth quintiles were constructed using household characteristics from household-level data and, values for wealth quintiles were then allocated to all individuals based on the household-level information. However, 74 cases were dropped due to missing values for the wealth index. Of the original sample, 39 245 individuals (70.61%) had suffered from any type of illness (Figure 1).
Flow chart of study sample.
Finally, in the estimation of OOP payments, data from 12 400 individuals (31.60%) with any type of illness were considered if they reported any type of healthcare utilization and associated expenses in the past 30 days preceding the survey. An individual’s total OOP healthcare expenditure was derived by summing up direct medical costs and direct non-medical costs. Direct medical costs included hospital outpatient fees, medicines, admission or registration fees, physician/consultation fees, diagnostic test fees, and any other associated medical supplies, whereas direct non-medical costs included transportation and conveyance, lodging, tips, and other associated costs [19]. In the current study, OOP health expenditures (adjusted using the natural logarithm) were regressed onto explanatory variables such as demographic variables (age, sex and marital status); educational background; employment status (yes or no); social financial safety (i.e., the receipt of governmental financial support due to age, poverty, veteran status, widowhood or the like); first symptoms of illness (diarrhea, fever, dysentery, pain, injury, blood pressure, weakness, or other); as well as economic status across asset quintiles. Age was classified into the following five groups: childhood (≤19 years), young adulthood (20-39 years), middle adulthood (40-64 years), and elderly (≥65 years). Marital status was categorized into three groups: unmarried, married, and other (widowed, divorced, or separated). Participants’ educational level was classified as no education, primary education, secondary education, higher secondary education, and higher education.
Estimation Strategy
Descriptive statistics were employed to summarize the data-about the different variables (Table 1). OOP payments for health care were considered to be the outcome variables. OOP payment data are characterized by a large cluster of data at zero, and a right-skewed distribution of the remaining observations, but the values of zero were deleted in the current analysis. The natural logarithm of OOP healthcare expenditures was used to reduce the effects of the skewed nature of the expenditure variable. Multiple linear regression models were used to identify the influencing factors of the explanatory variables on OOP expenditures. The multiple regression model used was:
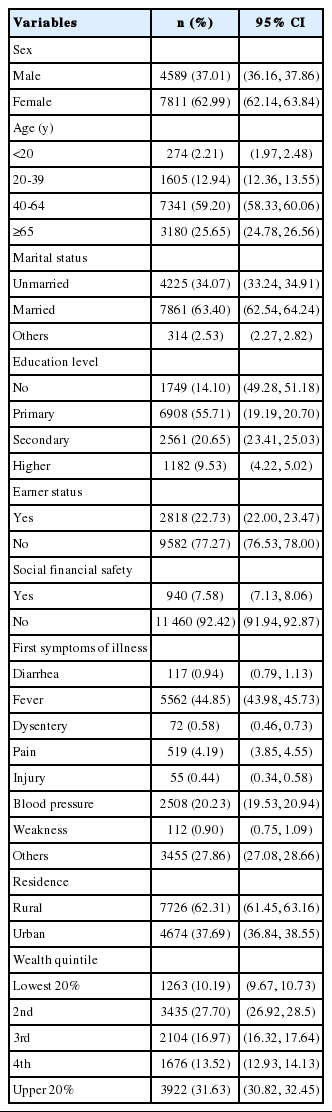
Background characteristics of the study population (n=12 400)
where yi was the dependent variable (natural logarithm of out-of-pocket healthcare expenditures), χi were the number of control variables for the explanatory study, β was the coefficient for each independent variable, α represents the unknown intercept term, and ε was the random error term. In the adjusted model, all variables of interest were considered in the model. Diagnostic tests were employed in the analysis. The Breusch-Pagan/Cook-Weisberg test was used to show whether heteroscedasticity was present in the model. The variance inflation factor (VIF) test was employed for detect multicollinearity in the regression model [20]. The Ramsey regression equation specification error test was used to identify evidence against the hypothesis of omitted variable bias in the model. Data cleaning, validation, and all statistical analyses were performed using Stata/SE 13.0 (StataCorp., College Station, TX, USA).
Ethical Considerations
The study was conducted using secondary data from the Bangladesh Bureau of Statistics, in which individuals and households are unidentifiable. Ethical approval was thus not applicable for this study.
RESULTS
Background Characteristics of Study Participants
A total sampled population included 12 400 individuals who reported illnesses and instances of healthcare utilization during the last 30 days prior to the survey interview. Among the study samples, 62.99% of individuals were female and 37.01% were male (Table 1), whereas 59.20% of those surveyed were participants 40-64 years of age. Slightly more than half of the individuals with a primary education (55.71%), 20.65% of those with a secondary education and 63.40% of individuals overall were married. More than two-thirds of the individuals were unemployed, while only 22.73% of subjects reported paid employment. Approximately 62.31% of individuals lived in rural communities.
Distribution of Out-of-pocket Healthcare Expenditures
The mean total of OOP health expenditures in the last 30 days was US dollar (USD) 27.66, corresponding to 20.26% of the monthly per capita gross domestic product during the fiscal year 2009 to 2010. Urban patients spent more money for healthcare (USD 38.29) than rural patients (USD 21.21).The cost of medicines (USD 16.98) was the highest cost driver (61.38% of total OOP health expenditures), followed by physician fees (USD 3.70) (Table 2). Those who lived in urban areas spent more than twice as much money on medicine (USD 24.06) than rural residents (USD 12.68).We found that the upper 20% of the population had higher average OOP healthcare expenditures (USD 32.46), which was only 4.34% of their monthly household income. On the contrary, the lowest quintile of the individuals spent USD 12.82 for receiving healthcare, which was 16.27% of their monthly household income; furthermore, rural inhabitants with alower socioeconomic status had a greater burden of OOP health expenditures (18.25% of their household income) than their counterparts among urban inhabitants (14.28%) (Table 3).
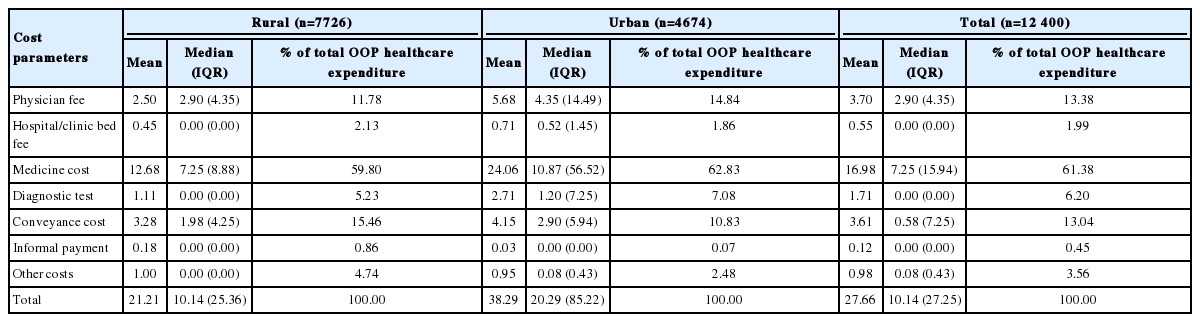
Distribution of OOP healthcare expenditure in USD last 30 days by cost parameters

Distribution of OOP healthcare expenditure in USD last 30 days by wealth quintile
Factors Associated With Out-of-pocket Healthcare Expenditures
We considered all variables in the multiple linear regression models that were significant predictors of OOP payments in the multivariate analysis (Table 4). The regression model explained 28.80% of the total variation (R2 =0.288). Multiple diagnostic tests were performed. The Breusch-Pagan/Cook-Weisberg test showed that heteroscedasticity was not present in the model (p<0.001). The VIF test with its mean (maximum) value of 2.34 (3.60) indicated no evidence of multicollinearity in the regression model. The Ramsey test showed that there was sufficient evidence against the hypothesis of omitted variable bias in the model (p<0.001).

Factors influencing OOP healthcare expenditure (natural log)
Age group (p<0.001), sex (p<0.001), marital status (p<0.05), urban communities (p<0.001), being in the richest 20% of the population (p<0.001), and higher education status (p<0.01) were significantly associated with higher OOP health expenditures. In contrast, earning status (p<0.001) and not receiving financial social benefits (p<0.01) were inversely associated with OOP healthcare expenditures.
DISCUSSION
The present study identified the determinants of OOP health expenditures incurred by the people of Bangladesh. A range of factors, including socioeconomic status, demographic characteristics, urban community, have been significantly associated with higher OOP health expenditures. Our results showed that the age and sex of individuals were significantly associated with OOP health expenditures. Several studies have observed that sex differences in reproductive biology and mortality drive differences in the use of healthcare services, which are reflected in total OOP expenditures, but it is also possible that males are more likely to be employed, with their healthcare costs potentially covered by the insurance programs associated with their jobs [21,22]. Healthcare expenditures were significantly associated with age, and this effect was highest among the elderly, which is consistent with findings from earlier studies [19,23-26]. The lack of health sector resources for the management of specific chronic diseases in the elderly may be a possible explanation of the positive influence of old age on OOP health expenditures, particularly as Bangladesh has no special coverage program for older citizens to mitigate excess healthcare costs at an affordable price [15]. This study observed that medicine (61% of total OOP healthcare expenditures) costs were the main cost drivers. This is consistent with other findings from Bangladesh indicating that a large amount of money was spent on medicine [27]. It may be argued that when OOP payments comprise a large share of household budgets, households are at risk of sacrificing current consumption of the necessities of life to pay for these medical costs [28]. Our findings are consistent with the results of other studies reporting that the risk of catastrophic health expenditures was strongly associated with the type of hospitals that patients have access to utilization of healthcare [29]. Our results are consistent with similar findings from another study that showed that the burden of OOP payments was highest among the poor [30], but a high incidence of catastrophic health expenditures has also been found among poor income households [31]. This may reflect the severity of disease in the poor (low-income) groups, which may be greater than in the high-income groups. Usually, poor people do not use healthcare if their illness is not severe, whereas high-income people may utilize healthcare services at the early stages of disease. A study has shown that OOP health expenditures were more significantly associated with urban communities, which is consistent with the argument that rural communities use installment payments and in-kind payment mechanisms for their healthcare needs [32]. The present study also found that OOP spending on healthcare services remains a significant determinant of financial insecurity. Those most at risk are the poor, as they have no proper financial security. Many rural inhabitants continue to seek help from traditional healers. Culturally ingrained beliefs regarding various illnesses and inconsistencies in access to health services may explain why people seek care from traditional practitioners, who nevertheless can impose a high OOP burden on those seeking care [33]. Improving the cultural competence of primary care health professionals and integrating traditional healers into existing health services may reduce OOP health expenditures.
Our study captured the determinants and distribution of OOP health expenditures among Bangladeshi people. Its strengths include a relatively large sample size and a representative sampling method. However, the study has some limitations. There may have been some recall bias, as the data were collected after participants received health services. Furthermore, this survey (HIES-2010) mentions nothing about proxy interviews; in cases where children and the elderly were unable to respond to the interviewers, some proxy respondents may have been interviewed. Additionally, it is of course possible for some people not to have incurred OOP expenditures not because they were not in need of health services, but because they were not able to afford them; assessing this phenomenon was not possible with the current dataset and remains a task for future research.
In conclusion, the study identified age, sex, marital status, place of residence, and family wealth as significant factors influencing higher OOP health expenditures. However, unemployment and not receiving financial social benefits were inversely associated with OOP expenditures. The present study can help decision-makers by identifying the determinants of OOP, discussing the mechanisms driving them, and there by underscoring the need to develop policy options for building stronger financial protection mechanisms in Bangladesh. The presence of significant levels of OOP expenditures shows that the population is sufficiently affluent to afford healthcare: however, OOP payments are not an equitable or efficient financing mechanism. The government should consider devoting more resources to providing free or subsidized care. Parallel to government action, the development of other prudential and sustainable risk-pooling mechanisms for example, community-based mechanisms can help to reduce the burden of OOP payments. By showing where OOP payments are highest, this study may help the designers of such programs identify which sections of the population are most exposed to OOP expenditures and may therefore be the most enthusiastic subscribers to community-based health insurance programs.
ACKNOWLEDGEMENTS
International Centre for Diarrhoeal Disease Research, Bangladesh (icddr,b) gratefully acknowledges the following donors who provided unrestricted support: the Government of the People’s Republic of Bangladesh; Global Affairs Canada (GAC); the Swedish International Development Cooperation Agency (Sida), and the Department for International Development (UK Aid). We gratefully acknowledge these donors for their support and commitment to the research efforts of icddr,b.
Notes
CONFLICT OF INTEREST
The authors have no conflicts of interest associated with the material presented in this paper.