Exploratory Study of Dimensions of Health-related Quality of Life in the General Population of South Korea
Article information

Abstract
Objectives
This study aimed to explore dimensions in addition to the 5 dimensions of the 5-level EQ-5D version (EQ-5D-5L) that could satisfactorily explain variation in health-related quality of life (HRQoL) in the general population of South Korea.
Methods
Domains related to HRQoL were searched through a review of existing HRQoL instruments. Among the 28 potential dimensions, the 5 dimensions of the EQ-5D-5L and 7 additional dimensions (vision, hearing, communication, cognitive function, social relationships, vitality, and sleep) were included. A representative sample of 600 subjects was selected for the survey, which was administered through face-to-face interviews. Subjects were asked to report problems in 12 health dimensions at 5 levels, as well as their self-rated health status using the EuroQol visual analogue scale (EQ-VAS) and a 5-point Likert scale. Among subjects who reported no problems for any of the parameters in the EQ-5D-5L, we analyzed the frequencies of problems in the additional dimensions. A linear regression model with the EQ-VAS as the dependent variable was performed to identify additional significant dimensions.
Results
Among respondents who reported full health on the EQ-5D-5L (n=365), 32% reported a problem for at least 1 additional dimension, and 14% reported worse than moderate self-rated health. Regression analysis revealed a R2 of 0.228 for the original EQ-5D-5L dimensions, 0.200 for the new dimensions, and 0.263 for the 12 dimensions together. Among the added dimensions, vitality and sleep were significantly associated with EQ-VAS scores.
Conclusions
This study identified significant dimensions for assessing self-rated health among members of the general public, in addition to the 5 dimensions of the EQ-5D-5L. These dimensions could be considered for inclusion in a new preference-based instrument or for developing a country-specific HRQoL instrument.
INTRODUCTION
Health-related quality of life (HRQoL) is a complex concept that has not been uniformly defined by researchers. Testa and Simonson [1] stated that HRQoL refers to the physical, psychological, and social dimensions of health influenced by a person’s experiences, beliefs, expectations, and perceptions. Cella [2] described HRQoL as the magnitude of one’s general or expected physical, emotional, and social well-being. HRQoL is considered to be an important outcome in health care. Several studies have reported that poor HRQoL was associated with increased hospital readmission [3] and mortality [3,4]. In clinical trials, HRQoL is now considered an important clinical trial endpoint, because it reflects the patient’s voice in decision-making [5]. However, each instrument used to measure HRQoL has different dimensions, depending on the definition of HRQoL or the researchers’ perspectives. Some HRQoL instruments have been developed to measure the utility of or preference for a specific level of health status. Health utility or preference is usually a number between 0 (death) and 1 (full health) [6]. In the 15-dimension preference-based instrument, 15 dimensions were included to evaluate people’s HRQoL [7]. Most preference-based measures, such as the Health Utility Index, have fewer than 10 dimensions [8,9]. Intuitively, when an instrument has fewer dimensions, it becomes easier to understand; however, its comprehensiveness is decreased. There is a trade-off between the ease of using an instrument and its comprehensiveness in reflecting HRQoL. Therefore, it has been recommended that a proper instrument should be selected according to the target population or the purpose of the measurements.
The EuroQol-5D (EQ-5D) is one of the most widely used preference-based instruments. It has national social tariffs derived from the Korean population. It can be used in clinical studies to evaluate health status to inform economic evaluations in health care. The EQ-5D consists of 5 dimensions: mobility, self-care, usual activities, pain/discomfort, and anxiety/depression. It has 3 levels of severity. It is quite simple, and ample evidence supports its validity and reliability in the general population [10] and among people with a variety of health conditions [11,12]. However, concerns have been raised about the ceiling effects of the EQ-5D in general populations and its comprehensiveness [13,14]. Based on relevant evidence, the EuroQol group developed a new version of the EQ-5D with 5 levels (the EQ-5D-5L) to address the ceiling problem [15]. However, the EQ-5D-5L still has a ceiling effect [10]. This ceiling effect refers to a phenomenon in which people may have good health conditions in reality, but the 5 dimensions of the instrument do not sufficiently reflect their health status. Several research studies have attempted to resolve the comprehensiveness problem by exploring additional dimensions or levels [14-16]. Cultural differences may exist between Asia, including Korea, and Europe (where the EQ-5D was developed). The standardized problem-reporting rate using the EQ-5D has been found to vary considerably across countries, and the mean EuroQol visual analogue scale (EQ-VAS) score ranged from 62.8 in Armenia to 82.3 in Sweden [17]. Several Asian studies showed a similar pattern, in which the loading of several items in the vitality, mental health, and social functioning scales of the 36-item Short Form differed from the originally hypothesized scale [18-21]. However, few studies have explored the dimensions of health that could be important factors influencing HRQoL in Asia.
A valuation task for examining the impact of ‘bolt-on’ items to the EQ-5D would be challenging. To avoid this difficulty and to select more appropriate bolt-on items, we analyzed self-perceived health. Therefore, the objective of this study was to explore dimensions that could explain self-perceived health in the general population of Korea, in addition to the 5 dimensions used in the EQ-5D-5L.
METHODS
Selection of Health-related Quality of Life Instruments and Its Dimensions
The dimensions assessed in various HRQoL instruments were searched through a literature review using PROQOLID (www.proqolid.org), a database of HRQoL instruments. Ten preference-based HRQoL instruments were included in this review. Fourteen generic HRQoL instruments published in PubMed at least 5 times were also included, as well as 3 generic HRQoL instruments developed in Korea that were found using domestic search engines (such as KoreaMed and KMBASE) and manual searching (Supplemental Figure 1).
After a review by 2 researchers (SHK and MWJ), the 5 dimensions of the EQ-5D-5L were preferentially considered for inclusion in this study because the EQ-5D-5L is the only HRQoL instrument that has estimated social tariff values in Korea. Twenty-three additional dimensions remained after deleting duplicates from other instruments. We then consulted with 4 experts who had experience in HRQoL or utility studies about which dimensions should be included to develop new preference-based instruments. We asked them to classify the 28 dimensions into 3 categories: essential dimensions for inclusion, dimensions that appeared to be suitable for inclusion, and dimensions that appeared to be unnecessary for inclusion. In addition, we asked which other dimensions should be included in new instruments, and which of the 28 dimensions could be combined. The dimensions evaluated as essential by at least 1 expert were included in the population survey. Speaking and communication were aggregated into the dimension of communication. As a result, 12 dimensions, including the 5 dimensions from the EQ-5D, were chosen for use in surveys of the general population. Those dimensions were: mobility, self-care, usual activities, pain/discomfort, anxiety/depression, vision, hearing, communication, cognitive function, social relationships, vitality, and sleep.
Questionnaire and Data Collection
A representative sample of 600 participants (≥20 years old) was selected for face-to-face surveys. Participants were recruited from 15 regions in Korea, except Jeju Island. Sampling was performed using a multi-stage stratified quota method. In the first step, a sample quota was proportionately assigned to each of the 15 regions according to population structure (number of population in region, sex [M, F], and age [20-29, 30-39, 40-49, 50-59, 60, or more]) as defined by the 2012 Korean resident registration population. In the second step, 66 survey points were randomly selected at the town and village level. Finally, interviewers visited households in the selected survey points and selected enough participants to meet the assigned quota. The interviewers were employed by a research agency.
Of the 1832 households contacted for an interview, 609 refused to participate in the survey, 324 had inappropriate age or sex strata, and 156 were not at their residence. Of the people who participated in the interview, 143 stopped the interview during the survey, and 600 interviews were successfully conducted (completion rate, 80.8%).
Respondents were asked to evaluate their own health states using 5 levels (1, no problems; 2, slight problems; 3, moderate problems; 4, severe problems; 5, extreme problems or unable to do) in terms of 12 dimensions, as in the EQ-5D-5L. The level of the descriptors for each dimension is listed in Supplemental Table 1. They were requested to rate their general health status using the EQ-VAS and self-rated health (SRH) on a 5-point Likert scale (1, very good; 2, good; 3, moderate; 4, bad; 5, very bad). Clinical information, such as ambulatory care visits in the past 2 weeks and hospitalizations in the past 12 months, was also gathered. Additionally, they reported socio-demographic information such as age, sex, educational level, income, and occupation. This study was approved by the institutional review board of Asan Medical Center (approval no. 2012-0717), and all participants provided written informed consent.
Analyses
Descriptive analyses were conducted of sociodemographic and clinical information, as well as the problems reported in all 12 dimensions. The mean values of the EQ-VAS by general characteristics, SRH, health conditions, and problems reported in the 12 dimensions were compared using the Student t-test and analysis of variance.
To identify the ceiling effect of the EQ-5D, the proportion of problems reported in the 7 new dimensions or of reported poor health conditions (i.e., people who had recently used medical facilities or had disease(s), or reported moderate to very bad SRH) were examined among people who did not report any problems in the 5 dimensions of EQ-5D-5L (i.e., the ‘11111’ state). In the same way, we also examined the frequency of reported poor health conditions among those who did not report any problems in the 12 dimensions.
To evaluate the independent contributions of health problems in the 12 dimensions to the EQ-VAS, we performed linear regression analysis with EQ-VAS as the dependent variable. The EQ-VAS has commonly been used as an HRQoL indicator in previous publications [16,17,22]. The VAS is advantageous because it is simple and easy to understand for the general public and is comparable with the findings of the Korea National Health and Nutrition Examination Survey (KNHANES).
Three models were considered. The first model (model A) included the 5 dimensions of the EQ-5D-5L as explanatory variables. The second model (model B) included the 7 new dimensions as explanatory variables. The third model (model C) used all 12 dimensions as explanatory variables. Independent variables were treated as dummy variables according to whether the problem (level 2, 3, 4, or 5) was reported in each dimension, instead of as continuous variables.
All statistical analyses were conducted using SAS version 9.1 (SAS Institute Inc., Cary, NC, USA). The p-values <0.05 were considered to indicate statistical significance.
RESULTS
The mean age of the respondents was 45.4 years (standard deviation: 14.6 years), and 49.3% were male. Respondents’ demographic characteristics and health conditions are summarized in Table 1. The EQ-VAS was significantly (p<0.05) higher in males and in people without morbidities. In addition, respondents who were younger, had a higher education level, and had better SRH had significantly higher EQ-VAS scores.
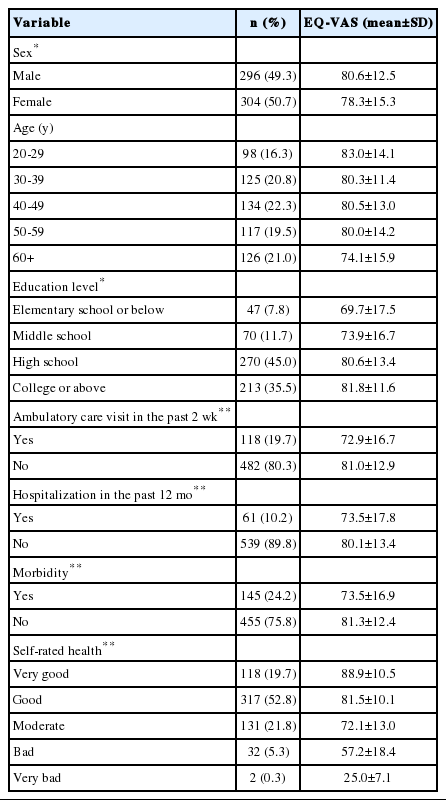
Socio-demographic characteristics and self-rated health of the study participants
The distribution of the EQ-VAS results for the 12 dimensions is shown in Table 2. The dimensions for which problems were most frequently reported were pain/discomfort (164, 27.3%) in the EQ-5D-5L and vitality (220, 36.7%) in the 7 new dimensions. The dimension for which the fewest problems were reported were self-care (24, 4.0%) in the EQ-5D-5L and communication (37, 6.2%) in the 7 new dimensions. Generally, EQ-VAS showed a tendency to decline with increasing severity in each dimension; however, participants with more severe problems reported higher EQ-VAS scores than the less severe group in some dimensions. For example, the mean EQ-VAS score of the 10 respondents who reported moderate problems in mobility was higher than the mean EQ-VAS of those who reported slight problems in mobility (Table 2).
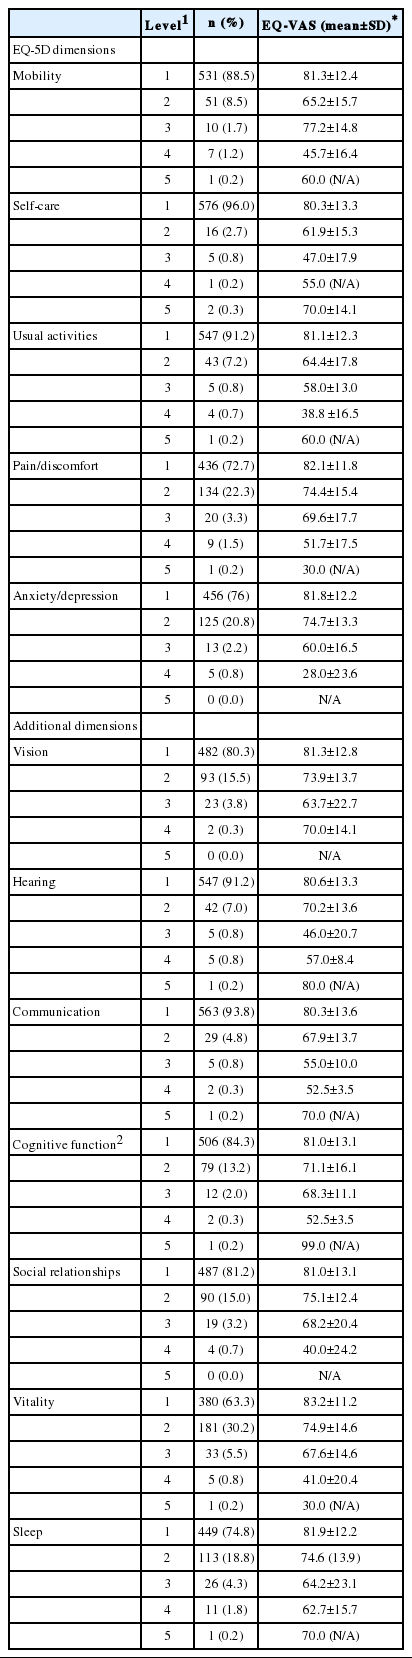
Problems reported in the 12 dimensions and the corresponding EQ-VAS scores
A total of 365 respondents reported full health on the EQ-5D-5L (i.e., a 11111 state). However, 32% of them reported at least 1 problem in the 7 new health dimensions. More specifically, 68 (18.6%) and 38 (10.4%) of those respondents reported problems with vitality and sleep, respectively, followed by vision, social relationships, cognitive function, hearing, and communication (Table 3). Fifty-two (14.3%) of these 365 respondents reported moderate to very bad SRH, and 13.4% reported having some form of morbidity. In addition, 249 respondents reported no problems on any of the 12 dimensions. Among them, 28 (11.2%) reported moderate to very bad SRH, while 24 (9.6%) had experiences of ambulatory care in the past 2 weeks (Table 3).

Analysis of the ceiling effect of the EQ-5D-5L and the 12 dimensions used in this study
According to the linear regression analysis, the proportions of variance in the EQ-VAS score explained (R²) by the 3 models that were explored were as follows: 0.228 in model A, 0.200 in model B, and 0.263 in model C (Table 4). Mobility, usual activities, and anxiety/depression showed statistically significant effects in model A. Vitality, hearing, and sleep were statistically significant in model B. Among the dimensions that were statistically significant in model A or B, only hearing became non-significant in model C.
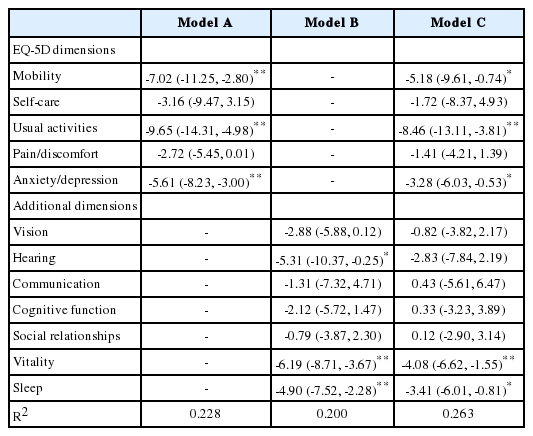
Linear regression analysis for the independent contributions of health problems in the EQ-VAS dimensions
DISCUSSION
This study was conducted to explore dimensions in addition to the 5 dimensions used in the EQ-5D-5L that could sufficiently explain variation in HRQoL in Korea. We found that HRQoL could not be fully explained with only the 5 dimensions of the EQ-5D. Other dimensions, such as vitality or sleep, might be more important to the general public.
To explore this theme, we reviewed comprehensive HRQoL instruments by searching PROQOLID and domestic databases, and selected 7 additional dimensions that might explain HRQoL based on expert consultations. The experts consulted were invited to suggest extra dimensions. This process of choosing dimensions for Koreans will be a critical and meaningful step for exploring additional dimensions that could help explain HRQoL in Korea, as well as other countries.
As in previous studies [10,22], EQ-VAS scores were significantly lower in females, the elderly, those with a low income, those with a low education level, and individuals with diseases or poor health perceptions. Moreover, the distribution of problems reported in the EQ-5D-5L were comparable to the results of a prior study of the Korean general population [10,22]. The highest proportion of problems reported in the EQ-5D-5L was in the dimension of pain/discomfort, whereas the fewest were reported for self-care. Based on these results, we can conclude that our survey results for the EQ-5D-5L and EQ-VAS are reasonable in terms of known group construct validity. Many studies have reported a ceiling effect of the EQ-5D [10,23-25]. In our study, the ceiling effect was greatest in self-care and smallest in pain/discomfort. These proportions were similar to the results of the 2010 KNHANES.
Within the 7 new dimensions, the most problems were reported for vitality, while the fewest were reported for communication. Vitality could be a compelling dimension for evaluating HRQoL in the general public, in addition to the 5 dimensions of the EQ-5D. In a similar study in Switzerland, fatigue/energy and sleep were the most commonly reported problems. The proportions of problems reported for sleep, memory/concentration, fatigue/energy, seeing and hearing, and contacts with others were 36.8, 35.6, 52.5, 28.5, and 7.0%, respectively [16]. Mukuria and Brazier [26] also found that mental health-related dimensions and vitality had stronger associations with happiness than the other dimensions of the EQ-5D. Of the 365 respondents who reported no problems on the EQ-5D-5L, 116 reported at least 1 problem in the 7 new health dimensions. More than 10% of respondents with a healthy state on the EQ-5D-5L (i.e., the 11111 state) reported moderate to very bad SRH. These results suggest that additional dimensions should be carefully considered for assessing HRQoL. If some people who report full health on the EQ-5D-5L are regarded as having peak values (i.e., 1) for utility, they will have an overestimated utility value. When we develop a new preference-based HRQoL instrument, we must consider more comprehensive dimensions, such as vitality or sleep.
Using the results of the linear regression analysis, we evaluated the independent contributions of health problems in the various dimensions to the EQ-VAS scores. Although there were more dimensions in model B than in model A, the proportion of variance of the EQ-VAS scores that was explained (R²) was greater in model A. The dimensions of the EQ-5D-5L might reflect HRQoL better than the new dimensions used in this study. By adding the 7 new dimensions, the proportion of variance in the EQ-VAS scores that was explained (R²) increased from 0.228 to 0.263. However, the proportion of the variance explained (R²) by model C is still low compared to the results obtained in other countries, such as 47.0% in Switzerland [16] and 32.0% in the UK [27]. More studies on new dimensions that could better reflect the HRQoL of Asians, including Koreans, are necessary. Among the EQ-5D dimensions, self-care and pain/discomfort were statistically non-significant. These results could be due to the relatively small sample size of this study and/or the low problem-reporting rate in the self-care dimension. In another study based on the KNHANES, all 5 dimensions had statistically significant effects on EQ-VAS scores [22].
The new dimensions that were statistically significant, such as sleep and vitality in model C, could be candidates for a new preference-based HRQoL instrument. This could be meaningful for the Korean people for several reasons. Koreans sleep the least of the 18 Organization for Economic Cooperation and Development countries [28]. Therefore, sleep could be a more important factor for Koreans than for people from other developed countries. In addition, the working hours of Koreans are very long [29], and Koreans’ overall health status, as evaluated by a VAS, is relatively poor [30]. Therefore, if these dimensions are added to the EQ-5D or included in a novel instrument, they will better explain the HRQoL of Koreans.
This study has some limitations. First, some experts were arbitrarily recruited, and we did not use a more structured approach, such as the Delphi method, to choose the new dimensions. Depending on which dimensions were selected by the experts, the results of the survey could have been different. If researchers intend to develop a new preference-based HRQoL instrument for Koreans, we recommend that they apply a more structured method to fully reflect the HRQoL of Koreans. Second, the inclusion of healthy people may raise the problem of selection bias. The general population appears to be in relatively good health, which is likely to affect the dimensions that explain the variability in EQ-VAS scores. A further study using a range of patient samples is needed because the frequency of problems reported in each dimension could vary across respondents. Additionally, we did not examine the characteristics of non-respondents. The non-respondents in population studies usually include a greater proportion of ill and disabled persons and individuals with lower socioeconomic status than the respondents [31]. This could limit the generalizability of our findings. Third, face-to-face interviews may yield socially desirable responses [32], thereby resulting in a lower R2. People tend to be more honest in postal or online surveys. Fourth, we explored additional dimensions of SRH, not the effect of additional dimensions on health utility. A bolt-on valuation study (of dimensions such as sleep and vitality) will be required using the new dimensions and their effects on self-perceived health, as identified in this study. Lastly, the database search for the potential dimensions of HRQoL in our study may have been limited. A more systematic search is needed. This study suggests that there may be extra domains explaining the variance in HRQoL. Further qualitative research to explore potential dimensions should be conducted among laypersons, as well as experts.
In conclusion, this study suggests that the EQ-5D-5L did not fully reflect self-perceived health in the general public. Self-care was not valuable in terms of the proportion of variance of EQ-VAS scores that it explained. This study found significant dimensions in addition to those of the EQ-5D-5L, such as vitality and sleep. These dimensions could be included in a new preference-based instrument or could be used to develop a country-specific HRQoL instrument.
ACKNOWLEDGEMENTS
This study was supported by the Health Promotion Fund, Ministry of Health & Welfare, Republic of Korea.
Notes
CONFLICT OF INTEREST
The authors have no conflicts of interest associated with the material in this paper.
SUPPLEMENTAL MATERIAL
HRQOL measure in this study
The included HRQOL instruments in this study