What Explains Socioeconomic Inequality in Health-related Quality of Life in Iran? A Blinder-Oaxaca Decomposition
Article information

Abstract
Objectives
This study aimed to explain the health-related quality of life (HRQoL) gap between the poorest and the wealthiest quintiles in the capitals of Kermanshah and Kurdistan Provinces (Kermanshah and Sanandaj), in western Iran.
Methods
This was a cross-sectional study conducted among 1772 adults. Data on socio-demographic characteristics, socioeconomic status (SES), lifestyle factors, body mass index, and HRQoL of participants were collected using a self-administered questionnaire. The slope and relative indices of inequality (SII and RII, respectively) were employed to examine socioeconomic inequality in poor HRQoL. Blinder-Oaxaca (BO) decomposition was used to quantify the contribution of explanatory variables to the gap in the prevalence of poor HRQoL between the wealthiest and the poorest groups.
Results
The overall crude and age-adjusted prevalence of poor HRQoL among adults was 32.0 and 41.8%, respectively. The SII and RII indicated that poor HRQoL was mainly concentrated among individuals with lower SES. The absolute difference (%) in the prevalence of poor HRQoL between the highest and lowest SES groups was 28.4. The BO results indicated that 49.9% of the difference was explained by different distributions of age, smoking behavior, physical inactivity, chronic health conditions, and obesity between the highest and lowest SES groups, while the remaining half of the gap was explained by the response effect.
Conclusions
We observed a pro-rich distribution of poor HRQoL among adults in the capitals of Kermanshah and Kurdistan Provinces. Policies and strategies aimed at preventing and reducing smoking, physical inactivity, chronic health conditions, and obesity among the poor may reduce the gap in poor HRQoL between the highest and lowest SES groups in Iran.
INTRODUCTION
Improving population health and reducing inequalities in health across social groups and regions are the two most important objectives of healthcare systems globally. Measuring the overall health status of the population and its distribution is an important step in evaluating the progress made towards attaining these objectives. Health-related quality of life (HRQoL) is a major measure of health status that has been increasingly used to measure inequality in health across different social groups [1-3].
Several studies [1,4-9] have confirmed positive associations between socioeconomic status (SES) and HRQoL in various countries. These studies highlighted that aging, health insurance, the level of educational attainment, income, the presence of chronic disease, and behavioral factors such as physical activity and smoking behavior had significant impacts on HRQoL of individuals in Iran and other countries. For example, a study conducted by Rezaei et al. [3] found significant positive associations between being physically active, monthly household income, and post-secondary education and HRQoL among the general population in Iran. The latter study found negative associations between factors such as older age, being married, having a chronic health condition, and smoking and HRQoL.
Although the impacts of socioeconomic conditions on health status have been extensively studied, there is limited evidence on the determinants of socioeconomic inequalities in poor HRQoL, especially in developing countries. To fill this gap in the literature, we measured and analyzed socioeconomic inequality in poor HRQoL in the capitals of Kermanshah and Kurdistan Provinces (the cities of Kermanshah and Sanandaj, respectively) in western Iran. In particular, we aimed to answer the following 2 research questions: (1) “Do socioeconomic inequalities exist in poor HRQoL among the study population?” and (2) “What are the most important contributors to the difference in the prevalence of poor HRQoL between the lowest and highest wealth quintiles?” The results of this study can provide valuable information for the design and implementation of policies to reduce socioeconomic inequalities in HRQoL in Iran.
METHODS
Study Setting and Participants
Data for this study were obtained from a cross-sectional survey conducted from May to December 2017. The survey was designed to measure HRQoL among individuals 18 years old and above (n=1772) residing in the cities of Kermanshah and Sanandaj, the capitals of Kermanshah and Kurdistan Provinces, respectively. The samples in the survey were selected in 2 steps. First, each city was divided into 5 regions (north, south, west, east, and central). Then, we used convenience sampling to obtain an equal number of observations from each region.
Data Collection Tools
The required data were collected using a self-constructed questionnaire. The validity and reliability of the questionnaire were confirmed in previous studies [3,8]. The questionnaire consisted of 2 sections. The first part covered questions related to socio-demographic characteristics (e.g., age, sex, and marital status), SES (e.g., education level, income level, and durable assets of households), behavioral factors (e.g., smoking behavior, physical activity), and body mass index (BMI) of the study participants. The second part was the validated Iranian version of the EuroQol 5-dimensions-3-level questionnaire, which included 5 dimensions of quality of life (mobility, self-care, usual activity, pain/discomfort, and anxiety/depression) with 3 responses (no problem, some problem, and extreme problem) for each dimension.
Measures
The outcome variable of interest in this study was a binary variable of poor HRQoL. The Iranian version of the EuroQol 5-dimensions with 3 dimensions of health states was used to calculate HRQoL for each respondent. We used the value set that has been recently calculated by the visual analogue scale among the general population in Iran [10] to compute the overall HRQoL. To generate the binary variable of poor HRQoL, we first measured the average score of HRQoL for the overall sample. The participants of the survey were then divided into 2 groups based on whether their HRQoL was poor or good. Participants were categorized into the poor-HRQoL group if their HRQoL score was 0.1 points lower than the average score of the total sample. This cut-off (≥0.1 points) was based on an established and commonly used cut-off representing a clinically relevant moderate difference. Participants with a HRQoL score greater than the average score of the HRQoL for the total sample were defined as having good HRQoL. As in previous studies [1,11], participants with scores between the average score of HRQoL for the total sample and 0.1 points lower than the average score for the total sample were excluded from the analysis. Based on the current literature [1,4-9,12,13], we used socio-demographic characteristics (e.g., age, sex, and marital status), SES, behavioral factors (e.g., smoking behavior and physical activity), and obesity status (BMI >30 kg/m2) of participants as determinants of poor HRQoL in the analysis. Polychoric principal component analysis (PCA) [14,15] was used to calculate the SES of the participants based on information on 16 durable assets of the households, income, and the educational attainment level of the participants [16]. The suitability of these variables in the PCA analysis was checked using the Bartlett sphericity test and the Kaiser-Mayer-Olkin (KMO) index. As suggested by Williams et al. [17], if the KMO index is greater than 0.5 and the Bartlett sphericity test is significant, the PCA is a valid technique. The KMO index was 0.838 and the Bartlett sphericity test was significant (χ2= 5088.70; p<0.001). The score obtained from the PCA was used to divide participants into 5 SES quintiles.
Statistical Analysis
Absolute and relative inequalities in poor HRQoL were estimated using regression-based indices of the slope and relative indices of inequality (SII and RII, respectively) [18]. A Poisson regression model with robust variance was used to generate the SII and RII values at 95% confidence intervals (CIs). We reported the SII and RII indices first with adjusting only for age, and then adjusting for age, sex, and education. The SII was defined as the absolute difference in the prevalence of poor HRQoL between the wealthiest and the poorest quintiles. A positive sign of SII suggests that poor HRQoL is mainly concentrated among the poor, while a negative sign indicates the opposite. For example, if the SII for poor HRQoL is 0.30, the prevalence of poor HRQoL in the poorest quintile would be 0.30 higher than in the wealthiest quintile. The RII is defined as the ratio difference in the prevalence of poor HRQoL between the wealthiest and the poorest quintiles. For example, a RII of 2.60 would suggest that the prevalence of poor HRQoL in the poorest quintile is 2.60 times higher than in the wealthiest quintile group. A RII value greater than 1.00 indicates that poor HRQoL is more concentrated among individuals with lower SES, while a RII value less than 1.00 indicates the opposite.
We used Blinder-Oaxaca (BO) decomposition [19-22] to explain the absolute difference in the prevalence of poor HRQoL between the poorest and the wealthiest quintiles. Based on the BO model, the prevalence gap between the poorest and wealthiest groups in poor HRQoL can be decomposed into 2 main components: (1) the percentage attributable to different levels of the explanatory factors between the wealthiest and the poorest quintiles (known as the composition, endowment, or explained effect) and (2) the percentage attributable to explanatory factors having differential effects on poor HRQoL in the wealthiest and the poorest groups (the response/coefficient effect). Suppose we have regression equations linking poor HRQoL, y; to a set of k determinants, x, for the wealthiest (equation 1) and the poorest (equation 2) groups, as follows:
The gap between the mean values of outcomes for the wealthiest group, yA, and the poorest group, yB, can be calculated as:
where xB and xA are the average explanatory variables for the wealthiest and the poorest groups, respectively; βB and βA denote the coefficients of explanatory variables for the wealthiest and the poorest groups, respectively; and Δx=xB-xA and Δβ=βB-βA. According to equation 3, the mean difference in the outcome variable (prevalence of poor HRQoL) was divided into 3 components: (1) the percentage attributable to different levels of the explanatory factors between the wealthiest and the poorest quintiles (explained components, E), (2) the percentage attributable to explanatory factors having differential effects on poor HRQoL in the wealthiest and the poorest groups (the response or coefficient effect, C), and (3) the percentage attributable to the interaction between the difference in the mean value of explanatory variables and their coefficients (CE). We used the BO decomposition technique with a logistic model to decompose the gap in poor HRQoL between the poorest and the wealthiest quintiles [21]. All data analyses were performed using Stata version 14.2 (StataCorp., College Station, TX, USA), and p-values less than 0.05 were considered to indicate statistical significance.
RESULTS
The average age of the study population was 36.3 years (standard deviation, 12.5 years). Of the total of 1772 participants, 59.6% were males. Approximately 61.1% of the total sample were married. The descriptive characteristics of the total sample and the crude and age-adjusted prevalence by explanatory variables are presented in Table 1. The overall crude and age-adjusted prevalence of poor HRQoL among the study population was 32.0% (95% CI, 29.9 to 34.3%) and 41.8% (95% CI, 39.5 to 44.1%), respectively. The overall crude prevalence of poor HRQoL among males and females was 31.8% (95% CI, 29.1 to 34.7%) and 32.3% (95% CI, 28.9 to 35.8%), respectively.

Descriptive characteristics and prevalence of poor HRQoL in western Iran, 2017
Table 2 presents the associations between poor HRQoL and its determinants obtained from multiple logistic regression. An inverse association was found between the prevalence of poor HRQoL and SES (odds ratio of the highest SES group compared with the lowest SES group, 0.45; 95% CI, 0.31 to 0.66). Associations were found between low levels of physical activity, being a smoker, obesity, having a chronic health condition, and poor HRQoL (p<0.05). The results did not suggest statistically significant associations between poor HRQoL and sex or marital status.

Association of independent variables and poor HRQoL in logistic regression analysis
The estimated value of SII was 0.29 (95% CI, 0.08 to 0.50) when we adjusted for age and 0.23 (95% CI, 0.01 to 0.46) when we adjusted for age, sex, and years of education. The estimated value of RII was 1.19 (95% CI, 1.04 to 1.35) when we adjusted for age and 1.15 (95% CI, 1.00 to 1.32) when we adjusted for age, sex, and years of education. These results suggest that poor HRQoL was mainly concentrated among individuals with lower SES.
The results of the BO decomposition analysis are presented in Table 3. The prevalence of poor HRQoL in the poorest SES group was 50.7% (95% CI, 45.5 to 55.8%), while it was 22.3% (95% CI, 18.2 to 26.5%) in the wealthiest SES group. The gap between the wealthiest and poorest SES groups was 28.4% (95% CI, 21.8 to 35.0%). Our study indicated that 49.9% of the gap between the 2 groups could be attributed to differences in the distribution of explanatory variables included in the model (i.e., age, smoking behavior, physical activity, the presence of chronic health conditions, and obesity). Differences in age, smoking status, physical activity, and having a chronic health condition between the 2 groups were identified as the main factors that affected the difference in the prevalence of poor HRQoL between the 2 groups. Additionally, the remaining half of the difference between the 2 groups was attributed to differences in the coefficients of variables (response) or other determinants that were not included in the study. The share of the interaction component in the total gap between the 2 groups was only -1.9% (Table 3).

Blinder-Oaxaca decomposition of poor HRQoL in western Iran, 2017
The share of each determinant in the overall difference in the prevalence of poor HRQoL between the poorest and wealthiest groups is illustrated in Figure 1. As shown in the Figure 1, the most important contributing factors affecting the difference in poor HRQoL were having a chronic health condition (13.9%), smoking (11.4%), and physical activity (14.4%).
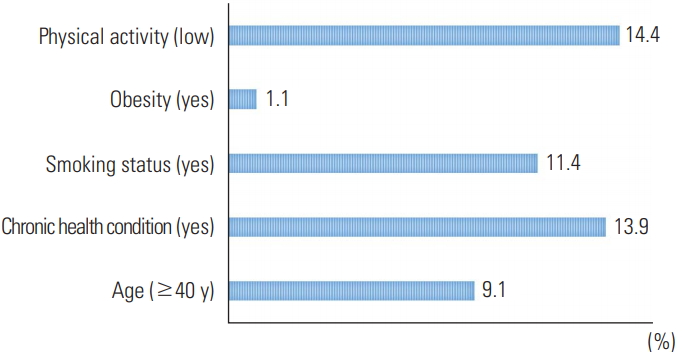
Percentage contributions of each factor to the overall difference in the prevalence of poor health-related quality of life between the poorest and wealthiest quintiles.
DISCUSSION
Composition, this study aimed to identify the factors responsible for the observed socioeconomic-related inequality in poor HRQoL among the general population in western Iran. The overall crude and age-adjusted prevalence of poor HRQoL was 32.0 and 41.8%, respectively. The SII and RII indices revealed that there were statistically significant pro-rich inequalities in poor HRQoL among the study population. In other words, poor HRQoL was more prevalent among lower-SES participants. The prevalence of poor HRQoL among the lowest-SES group was 50.7% (95% CI, 45.4 to 55.9%), in contrast to 22.3% (95% CI, 18.3 to 26.9%) among the highest-SES group (Table 1). Negative statistical associations between SES and HRQoL have been well documented in previous studies conducted in Iran and globally. For example, Matute et al. [13] in Chile, Djärv et al. [1] in Sweden, and Menati et al. [23] in Iran found that poor HRQoL was associated with lower SES. Another study by Mielck et al. [24] in Germany also reported an inverse association between SES and HRQoL. Compared to people with higher SES, individuals with lower SES have lower access and utilization of health services, less awareness of health needs, and higher levels of unhealthy lifestyle habits (e.g., smoking and physical inactivity), which in turn can ultimately lead to lower levels of HRQoL among the poor. Previous studies in Iran have already found that the utilization of health services among people with higher SES was greater than among those with lower SES [25,26]. A study by Huguet et al. [27] highlighted the importance of financial barriers in access to healthcare as an important factor that contributed to the higher rate of poor HRQoL among those with lower SES.
The logistic regression analysis indicated that being an older adult, physically inactive, obese, and a smoker, as well as having a chronic health condition, were associated with poor HRQoL. These findings are consistent with the results reported by Augustussen et al. [28] in Greenland, Kitaoka et al. [29] in Japan, Djärv et al. [1] in Sweden, and Karyani et al. [8] in Iran. As shown by Rezaei et al. [3], smoking and physical inactivity led to higher rates of poor HRQoL among adults in the west of Iran. Another study by Hajian-Tilaki et al. [30] also suggested a negative association between HRQoL and BMI.
The BO decomposition analysis demonstrated that the largest contributors to the overall gap in the prevalence of poor HRQoL between the poorest and wealthiest SES groups were physical inactivity, having a chronic health condition, and being a smoker. A population-based cross-sectional study by Djärv et al. [1] in Sweden investigated poor HRQoL among 6969 individuals aged 40-79 years in 2008 and concluded that a higher number of chronic diseases and being physically inactive were the most important determinants of poor HRQoL. Previous studies conducted by Anokye et al. [31] in England, Ross et al. [32] in Canada, and Buder et al. [33] in the US also confirmed an inverse association between physical inactivity and HRQoL.
There were some limitations to this study, and the findings should be interpreted in the context of these limitations. First, this analysis was based on cross-sectional data and it was not possible to establish causal inferences between independent variables and poor HRQoL. Therefore, longitudinal studies are required to examine causality between poor HRQoL and its determinants. Second, due to financial barriers, we used convenience sampling. The use of this sampling method limited the generalizability of our results. These findings are generalizable to the sample obtained from 2 cities in Iran. Further studies from other cities and provinces are required to increase the generalizability of the results. Third, data on HRQoL and its key determinants (e.g., smoking behavior and BMI) were collected using self-reporting, which is subject to measurement error.
In conclusion, monitoring socioeconomic-related inequality in HRQoL is an important first step in the design and implementation of appropriate public policies to address inequalities in health. The results of this study revealed a pro-rich inequality in poor HRQoL among the general population in the west of Iran. We found that a higher prevalence of physical inactivity, smoking, obesity, and chronic health conditions were the main contributors to the observed difference in the prevalence of poor HRQoL between the poorest and wealthiest SES groups. Thus, policies and strategies aimed at preventing and reducing smoking, physical inactivity, chronic health conditions, and obesity among socioeconomically disadvantaged groups may reduce socioeconomic inequality in poor HRQoL in Iran.
ACKNOWLEDGEMENTS
The authors gratefully acknowledge the research council of Kermanshah University of Medical Sciences for providing financial support (no. 97091).
Notes
CONFLICT OF INTEREST
The authors have no conflicts of interest associated with the material presented in this paper.