Impact of Regional Cardiocerebrovascular Centers on Myocardial Infarction Patients in Korea: A Fixed-effects Model
Article information

Abstract
Objectives
The Regional Cardiocerebrovascular Center (RCCVC) Project designated local teaching hospitals as RCCVCs, in order to improve patient outcomes of acute cardiocerebrovascular emergencies by founding a regional system that can adequately transfer and manage patients within 3 hours. We investigated the effects of RCCVC establishment on treatment volume and 30-day mortality.
Methods
We constructed a panel dataset by extracting all acute myocardial infarction cases that occurred from 2007 to 2016 from the Health Insurance Review and Assessment Service claims data, a national and representative source. We then used a panel fixed-effect model to estimate the impacts of RCCVC establishment on patient outcomes.
Results
We found that the number of cases of acute myocardial infarction that were treated increased chronologically, but when the time effect and other related covariates were controlled for, RCCVCs only significantly increased the number of treatment cases of female in large catchment areas. There was no statistically significant impact on 30-day mortality.
Conclusions
The establishment of RCCVCs increased the number of treatment cases of female, without increasing the mortality rate. Therefore, the RCCVCs might have prevented potential untreated deaths by increasing the preparedness and capacity of hospitals to treat acute myocardial infarction patients.
INTRODUCTION
Acute myocardial infarction is a major emergency; many patients with this condition die from ventricular fibrillation, and half of the patients die within 1 hour from symptom onset. Therefore, when an acute myocardial infarction occurs, the patient must quickly acknowledge his or her symptoms and must arrive as quickly as possible at a hospital capable of performing cardiac intervention procedures [1]. Despite advances in medical technology that improved the potential of interventions for acute myocardial infarction, there was no emergency and specialized care system for optimal patient care in Korea in the 2000s, and criticisms were raised regarding the inadequacy of acute-phase treatment outcomes in comparison with those of advanced countries [2].
Consequently, the Regional Cardiocerebrovascular Center (RCCVC) Project was established to strengthen the management of acute emergency conditions, including acute myocardial infarction and stroke, by designating/fostering cardiocerebrovascular centers at local university hospitals and constructing a patient care system that is initiated within 3 hours of the onset of cerebrocardiovascular disease. There are currently a total of 11 centers operating as of 2017, initiated with the designation of 3 centers in November 2008. The designated institutions operate a 24-hour specialized care system, as well as implement prevention and control programs, with facilities and equipment that satisfy the relevant standards and criteria.
After the establishment of the RCCVC Project, an evaluation of its results showed improvements in structure indicators such as the number of beds, the installation of a coronary angiography room, the number of angiography rooms, the number of specialists and the percentage of specialists on call, and also process indicators such as the average number of education sessions provided to admitted patients, post-discharge care, symptom-to-door time, and door-to-balloon time [3].
Meanwhile, since many patients die from cardiac arrest prior to reaching the hospital, the difficulty in precisely defining the incidence rate has meant that only a scant number of studies have analyzed changes in the treatment rate or in treatment outcomes before and after the establishment of RCCVCs. A study analyzing the performance of RCCVCs in Busan/Ulsan reported that despite the decrease in the door-to-balloon time, there were no differences in the mortality rate [4]. Furthermore, a study that investigated a total of 1600 subjects, comprising 100 subjects from each of 8 hospitals prior to and after the establishment of a RCCVC, reported a decrease in the severity-adjusted mortality rate after the establishment [5]; however, these studies only analyzed data at the hospital level, limited to a specific institution, rather than the country as a whole. This study was therefore conducted to estimate the effect of establishing RCCVCs on the treatment and mortality of acute myocardial infarction patients in the corresponding region by developing a panel dataset through the extraction of all data on acute myocardial infarction care from 2007 to 2016 using the Health Insurance Review and Assessment Service (HIRA) claims data, a national representative source.
METHODS
Data
Dependent variables
The number of treatment cases and the mortality rate per 100 000 acute myocardial infarction patients, the dependent variables of this study, were collected using HIRA claims data [6] from January 2007 to December 2016. This study used data from patients aged 30 years and older with the International Classification of Diseases, Tenth Revision diagnosis code l21, corresponding to acute myocardial infarction, within the top 5 codes by priority; these data comprised all records on admission to departments of internal medicine, cardiovascular and thoracic surgery, and emergency medicine, as well as records from outpatient care, derived from the medical records of clinics, secondary and tertiary hospitals, public health centers (branches), and public medical centers.
The number of treatment cases of acute myocardial infarction was defined as the number of patients treated for their first incidence of acute myocardial infarction during the study period, and mortality within 30 days was defined as the number of deaths within 30 days from the time of treatment. The mortality rate was calculated by dividing mortality within 30 days by the number of treatment cases of acute myocardial infarction and was presented as a percentage.
Considering that acute myocardial infarction is a serious emergency, the presence of a characteristic clinical symptom such as chest pain in the healthcare setting prompts the diagnostic tests required to rule out acute myocardial infarction. However, acute myocardial infarction is only confirmed in a small proportion of cases where testing is carried out, making it difficult to reliably confirm the incidence of acute myocardial infarction by only using the diagnosis code and test code. However, because an immediate intervention is necessary upon confirmation of acute myocardial infarction, the presence of a procedure code clinically relevant to acute myocardial infarction is rather reliable evidence of the incidence of the condition. Ahn [7] estimated the incidence of acute myocardial infarction using the National Health Insurance Service claims data, demonstrating that the use of both the diagnosis code and the procedure code, rather than the diagnosis code alone, caused the assessment of the incidence and trends of acute myocardial infarction to be less affected by other conditions and systemic changes, thereby enabling a reliable estimation of the incidence rate. Therefore, this study identified treatment cases of acute myocardial infarction using the diagnosis code and the procedure code (Table S1).
Treatment variable
The treatment variable is defined based on the location of the RCCVC and the designated year and month, which are presented in Table 1. The designation for each year was processed as bivariate data, and when the corresponding year did not exceed 25% in the designated month, the designation in that year was coded as 1 (Table 1).

Designation of the treatment variable corresponding to the year and month of regional cardiocerebrovascular center designation by tertiary catchment area [8]
Control variable
Variables that might affect the treatment and outcomes of acute myocardial infarction at the regional level were selected and used as the control variables of this study (Table S2). The population information of the corresponding region obtained from the Statistics of Residence Registration Population was used as the denominator for the population-based ratio scale.
Organization of data and management of missing data
All data were organized by region and by year for analysis. From the monthly data provided, the data from December were selected as the representative values for the corresponding year. When obtaining statistics for a large region by combining data from the smaller regions, we used weighted means using respective population as weight.
For the gross regional domestic product (GRDP) variable, an economic indicator, the last observation carried forward method was used to substitute the missing values, as many cities, counties, and districts did not collect the data prior to the year 2010. In the case of Sejong city, the GRDP data for 2012 were missing, and were substituted via interpolation of data, whereas in the case of Cheonan city, the medical institution data missing for 2007 were substituted using the medical institution data for 2008. Additionally, the Community Health Survey was not conducted, and so the missing data for 2007 were also substituted with the data for 2008.
Regional units of analysis
The concept of the medical service area based on the actual use of medical services is necessary to analyze whether the establishment of an RCCVC provided treatment for patients with cardiocerebrovascular disease in the area corresponding to the “region” as intended. As many of the disease groups treated in the RCCVC are severe acute conditions, the tendency to use medical services was assumed to be similar to that of emergency care, and so the classification of medical service areas in the previous Emergency Medical Service Area study [9] was used. The classification of medical service areas in this study was based on the analysis of use of emergency care using HIRA claims data, the competency analysis of each emergency center using the data from the emergency center evaluation, and the analysis of the number of patients of each emergency center using the National Emergency Department Information System data. In our study, 15 tertiary catchment areas that integrated the data collected from a total of 229 cities, counties, and districts were selected as the basic unit of analysis (Table S3). The population of each tertiary catchment area and the number of treatment cases of acute myocardial infarction used in the analysis are presented in the supplemental data (Table S4).
Statistical Analysis
To analyze the effect of the establishment of RCCVCs, a fixed-effects model that assumed a constant treatment effect over time and controlled for potential confounding variables was formulated as follows, in accordance with the results of the Hausman test.
The goal of quantitative analysis is to estimate the coefficient of the dummy variable that represents the implementation of the policy by controlling the matrix of control variables, including the dummy of each year, according to region i and time t in the above equation, and by differencing out unobserved time-invariant factors. When the treatment effect is strictly exogenous, the coefficient will be the average treatment effect of the policy during the corresponding period [10]. Considering the possibility of heteroskedasticity among regions, a robust standard error was used.
This study was conducted after receiving consent for exemption from review by the Institutional Review Board of Seoul National University.
RESULTS
Table 2 presents the summary statistics of the treatment and control groups, as of 2007, prior to the designation of an RCCVC. The treatment group was defined as the total tertiary catchment areas with the establishment of RCCVCs until 2016, and the control group was the 4 tertiary catchment areas in Seoul/Gyeonggi region in which an RCCVC was not designated until 2016. Although the number of treatment cases per 100 000 patients was higher in the treatment group of nonmetropolitan regions, this difference was not statistically significant. The number of medical institutions and health professionals was higher in the control group of metropolitan regions. The proportion of the elderly population was significantly higher in the treatment group, and the proportion of individuals who reported high-risk alcohol consumption and perceived obesity was significantly higher in the control group.
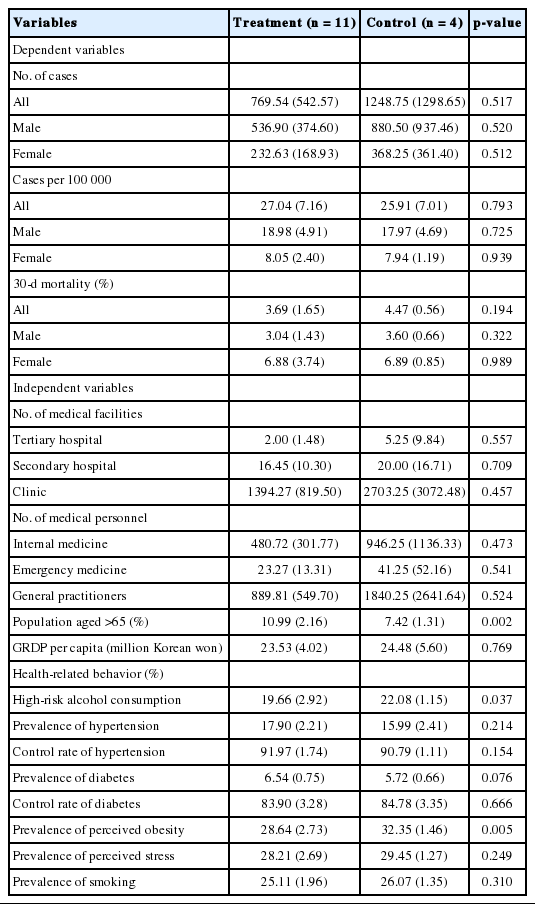
Descriptive statistics of treatment and control groups in 2007
Number of Treatment Cases Per 100 000 Patients
In the regions where an RCCVC was established, the number of treatment cases per 100 000 patients increased when other variables were not adjusted for, to 4.79 cases per 100 000 in the total population, 3.74 cases per 100 000 in the male population, and 1.05 cases in the female population (Model 1, Table 3). A chronological increase in the number of treatment cases per 100 000 was observed in the total population and in the male population (Model 2). The inclusion of all treatment-related control variables (Model 3) showed that the establishment of an RCCVC resulted in an additional 1.86 cases per 100 000 in the total population, and an additional 0.95 cases per 100 000 in the male population, neither of which was statistically significant. The establishment of an RCCVC resulted in an additional 0.91 cases per 100 000 in the female population, which was statistically significant.
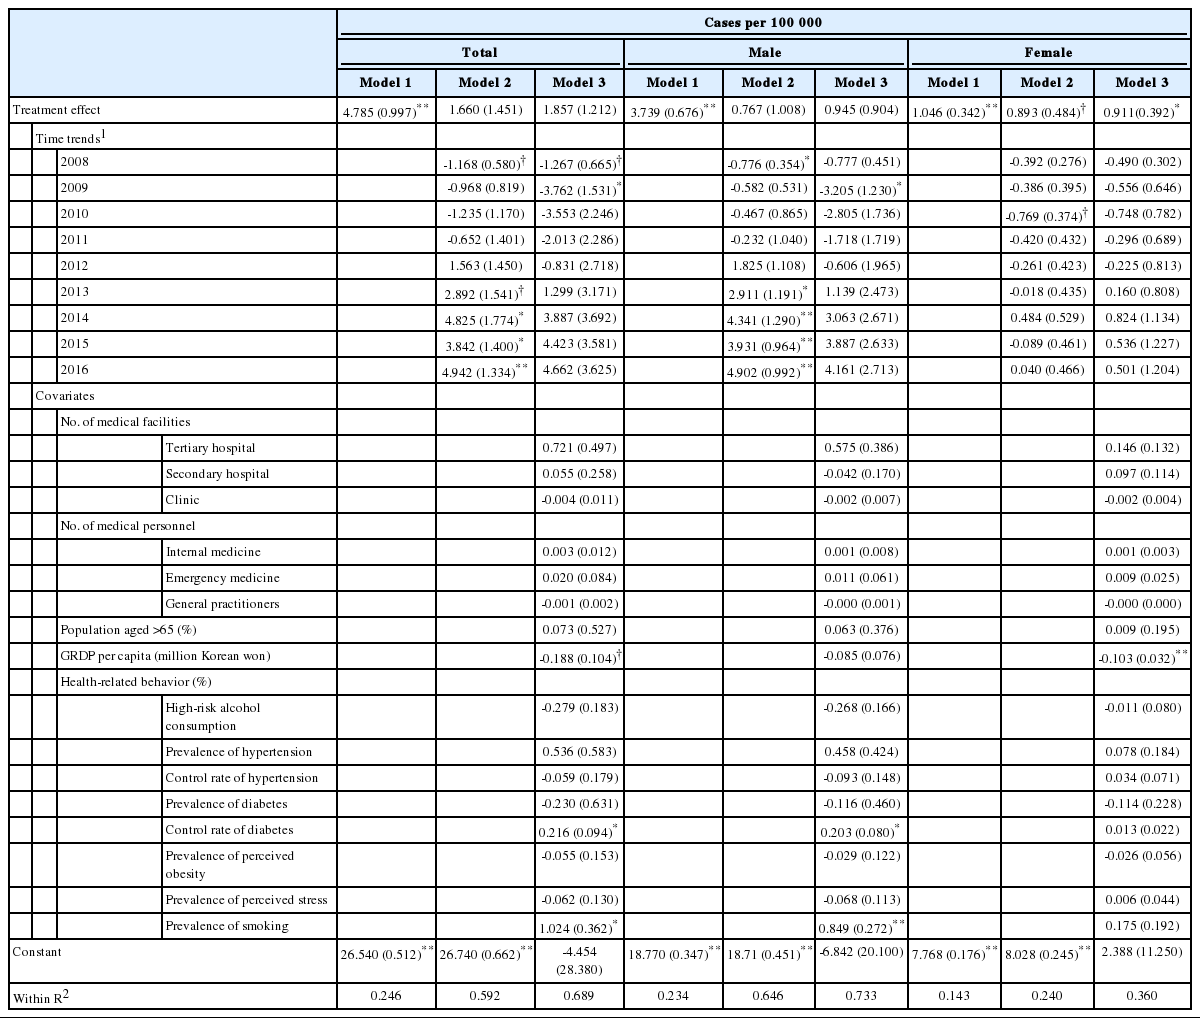
Establishment of RCCVCs and the number of treatment cases
Acute Mortality Rate
In regions where an RCCVC was established, the acute mortality rate increased by approximately 1%p (Table 4). The increase was greater and more statistically significant in the male population than in the total population and was not significant in the female population (Model 1). When the time variable was included, the year effect was statistically significant in all populations, the difference between the mortality rate prior to and after the establishment of an RCCVC decreased, and the sign of the effect changed from positive to negative in the female population (Model 2). When all control variables related to the mortality rate were included (Model 3), the establishment of an RCCVC decreased the mortality rate in the total population by 0.09%p, increased the mortality rate in the male population by 0.4%p, and decreased the mortality rate by -1.39%p in the female population; however, these changes were not statistically significant.
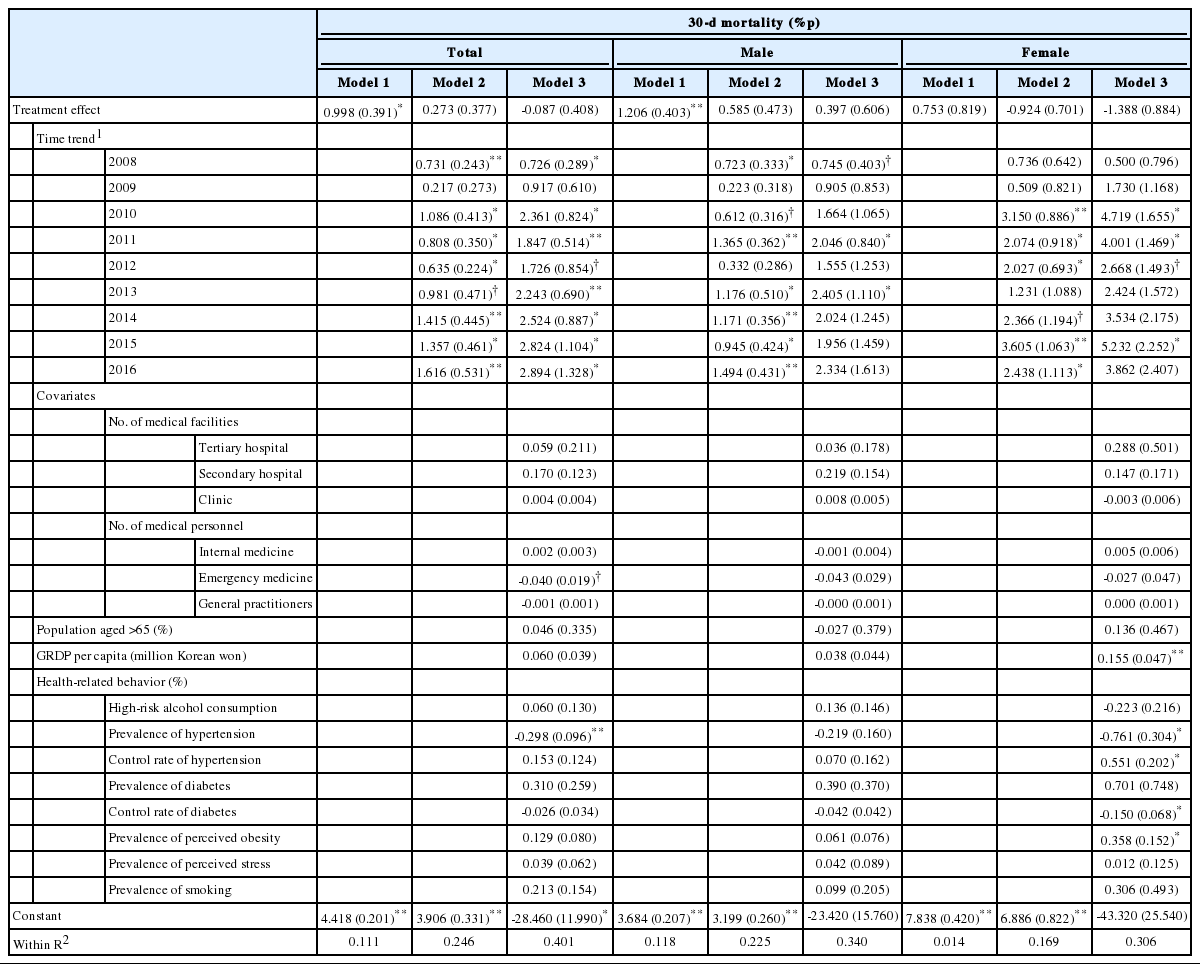
Establishment of RCCVCs and the acute mortality rate
DISCUSSION
The establishment of RCCVCs led to a statistically significant increase in the number of treatment cases of female. Additionally, an increase in the number of treatment cases was observed at a national level after the establishment of RCCVCs, which may be attributed to the national increase in male patients. The chronological increase in the number of treatment cases of male is consistent with the results of the preceding study based on recent HIRA claims data [7]. Although not described in this study, an additional analysis of the district medical service areas smaller in size than the tertiary catchment area confirmed that the effect of RCCVC establishment was greater and more statistically significant in the tertiary catchment areas. These results demonstrate that the effect of RCCVC establishment was apparent at the regional level, as intended by the policy.
Meanwhile, although the total mortality rate decreased by 0.09%p after the establishment of an RCCVC, controlling for all related variables in the analysis at a regional medical service area level, this decrease was not statistically significant. However, the appropriate treatment of the increased number of treatment cases may suggest an indirect effect of decreasing potential deaths in acute myocardial infarction patients. Considering that the mortality rate of patients who received timely procedure was already below 10% following the implementation of percutaneous coronary interventions in the mid-2000s, prior to the establishment of RCCVCs [11], the room for improvement in the mortality rate can be considered to have already been quite minimal.
The effects of RCCVC establishment appeared to vary by sex, which requires some interpretation, even though the sex difference did not reach statistical significance. In the male population, there was a chronological increase in the absolute number of treatment cases simultaneously with an increase in the mortality rate after the establishment of RCCVCs; this can be interpreted as indicating that the increased number of cases could be attributed to a higher level of severity than was present in the previous patient population [3,5]. Meanwhile, in the female population, the increase in the number of treatment cases after RCCVC establishment was smaller than that of the male population, which can be interpreted as indicating that the minimal differences in severity did not affect the mortality rate. Studies have also reported that female patients present with non-chest pain symptoms more frequently [12] and show higher mortality rates than male patients [13], which means that we cannot disregard the possibility that the effects of RCCVC establishment may vary by sex; therefore, this possibility must be considered in future studies and policy-making.
In the additional analysis of regional units smaller than the tertiary catchment areas, there were a number of regions with no treatment cases of acute myocardial infarction, which suggests that the number of deaths prior to a hospital visit or procedure remained quite substantial in the corresponding regions [14]. In this context, this finding can be interpreted as indicating that the increase in the number of treatment cases due to the establishment of an RCCVC can reduce the unmet medical needs at the regional medical service area level, considering the characteristics of acute myocardial infarction as an emergency condition. As various indices at the hospital level, such as the door-to-balloon time, decreased after RCCVC establishment [3], the improvement of acute myocardial infarction patient outcomes in the future warrants rather intensive efforts in prehospital care, such as care coordination in the regional emergency care system.
Meanwhile, following the development of percutaneous coronary intervention (PCI), an acute-phase treatment of acute myocardial infarction, there were studies on the results of rapid delivery of patients to hospitals capable of performing PCI and subsequent execution of the corresponding procedure. Upon implementation of a transfer system in 30 hospitals within 340 km of 1 center capable of PCI in Minnesota, USA, patients were transferred within 100-145 minutes despite not having ruled out high-risk patients such as those experiencing cardiogenic shock and out-of-hospital cardiac arrest, and the in-hospital mortality rate was 4.2% [15]. Upon the implementation of a protocol established to decrease the time to PCI in North Carolina, the time taken to reach the hospital and to transfer the patient, as well as the time taken for the procedure, decreased significantly [16]. Recently a regional PCI service also showed successful results in Auckland/Northland, Australia [17]. Although a direct comparison with this study is difficult as those studies have not described an increase in caseload after the establishment of an RCCVC, those findings can be understood as similar evidence suggesting that increased healthcare quality can be expected as a result of establishing a regional network.
There are a few limitations. Although the main evidence associated with the increase in the number of treatment cases following the establishment of RCCVCs is provided, the specific pathway or mechanism of the increase is unknown, making it difficult to discern whether the increase in the number of treatment cases was caused by an absolute increase in the number of acute myocardial infarction patients or an increase in the detection of patients after RCCVC establishment. Additionally, although it was one of the expected effects of RCCVC establishment, the use of regional data that integrated the institution-level data did not allow an analysis of the volume effect, in which the increase in the number of interventionists and the number of treatment cases results in improved treatment outcomes [18] of PCI and treatment for acute myocardial infarction. Furthermore, it was not possible to adjust for individual factors, such as disease severity. Because a total of 15 tertiary catchment areas were included in the analysis, it is possible that with small standard deviation in the number of treatment cases and the mortality rate, an actual significant effect appeared to be statistically non-significant due to an insufficient number of samples. However, this study used comprehensive national data and included all the tertiary catchment areas which cover entire nation in the analysis, so it would not be possible to analyze a larger subject population using the corresponding study design.
In summary, the establishment of RCCVCs increased the number of treatment cases of acute myocardial infarction patients but did not have a significant effect on the mortality rate. As a result, the establishment of RCCVCs was effective in reducing potential out-of-hospital deaths due to acute myocardial infarction in patients who received treatment as a result of the increase in the number of treatment cases.
SUPPLEMENTARY MATERIALS
Supplementary materials are available at https://www.jpmph.org/.
Notes
CONFLICT OF INTEREST
The authors have no conflicts of interest associated with the material presented in this paper.
ACKNOWLEDGEMENTS
This article has been adapted and developed from the first author’s unpublished manuscript, titled “Impact of Regional Cardiocerebrovascular Center on Myocardial Infarction Patients,” which served as a partial fulfilment of requirements for the degree of Master of Public Health in the Graduate School of Public Health at Seoul National University.