Estimate of the Basic Reproduction Number for COVID-19: A Systematic Review and Meta-analysis
Article information

Abstract
Objectives
The outbreak of coronavirus disease 2019 (COVID-19) is one of the main public health challenges currently facing the world. Because of its high transmissibility, COVID-19 has already caused extensive morbidity and mortality in many countries throughout the world. An accurate estimation of the basic reproduction number (R0) of COVID-19 would be beneficial for prevention programs. In light of discrepancies in original research on this issue, this systematic review and meta-analysis aimed to estimate the pooled R0 for COVID-19 in the current outbreak.
Methods
International databases (including Google Scholar, Science Direct, PubMed, and Scopus) were searched to identify studies conducted regarding the R0 of COVID-19. Articles were searched using the following keywords: “COVID-19” and “basic reproduction number” or “R0.” The heterogeneity among studies was assessed using the I2 index, the Cochran Q test, and T2. A random-effects model was used to estimate R0 in this study.
Results
The mean reported R0 in the identified articles was 3.38±1.40, with a range of 1.90 to 6.49. According to the results of the random-effects model, the pooled R0 for COVID-19 was estimated as 3.32 (95% confidence interval, 2.81 to 3.82). According to the results of the meta-regression analysis, the type of model used to estimate R0 did not have a significant effect on heterogeneity among studies (p=0.81).
Conclusions
Considering the estimated R0 for COVID-19, reducing the number of contacts within the population is a necessary step to control the epidemic. The estimated overall R0 was higher than the World Health Organization estimate.
INTRODUCTION
In December 2019, a series of pneumonia cases with no identified cause appeared in Wuhan, Hubei Province, China, with clinical symptoms similar to viral pneumonia [1-3]. Most of the reported cases were in patients who worked or lived around the local Huanan Seafood Wholesale Market, where live animals were also sold [4]. This new virus infecting humans was initially named the 2019 novel coronavirus, and the World Health Organization (WHO) subsequently issued updated nomenclature, in which the virus is referred to as severe acute respiratory syndrome coronavirus 2 (SARS-CoV-2) and the disease that it causes is referred to as coronavirus disease 2019 (COVID-19) [5]. Because of its high contagiousness and morbidity, this infection is considered by WHO as a global emergency [6]. As a reflection of the high transmissibility of this viral infection, by January 26, 2020 more than 2000 confirmed cases of COVID-19 had been identified in China, mainly in Wuhan [7]. This number then dramatically increased, with the number of confirmed cases in China reaching 66 580 by February 15, 2020, with 1524 deaths [8]. Human-to-human transmission of COVID-19 was confirmed [9] and cases were reported in countries other than China [10]. Because of the high infectiousness of SARS-CoV-2 among the susceptible population, the calculation of the basic reproduction number (R0) is essential for implementing prevention measures [1]. R0 is an epidemiological metric that can be used to assess the contagiousness of infectious agents. This index presents the average number of new cases generated by an infected person [11,12]. Therefore, a high R0 indicates that an infectious agent is highly contagious. Since the epidemic began in China, numerous papers have been published on this issue. However, because of discrepancies in the results of those studies, the current systematic review and meta-analysis aimed to estimate the pooled R0 for the COVID-19 outbreak, using original articles published during 2020.
METHODS
Search Strategy
This systematic review and meta-analysis was performed to estimate the pooled R0 of COVID-19 in articles published in international journals. International databases (including Google Scholar, Science Direct, PubMed, and Scopus) were searched to obtain studies conducted regarding the reproduction number of COVID-19. Articles were searched using the keywords “COVID-19” AND “basic reproduction number” OR “R0”.
Study Selection and Data Extraction
In the current study, all studies published in 2020 that estimated R0 for COVID-19 were entered into the meta-analysis. The name of the first author, country, year of the study, model used to estimate R0, and the estimated R0 value (with a 95% confidence interval, CI) were extracted from the articles.
Statistical Analysis
Heterogeneity between studies was assessed using the I2 index, the Cochran Q test, and T2. According to the I2 results, heterogeneity can classified into the following 3 categories: I2<25% (low heterogeneity), I2=25-75% (average heterogeneity), and I2>75% (high heterogeneity) [13]. Because of the high I2 value that was calculated (99.4%), as well as the significance of the Cochran Q test (p<0.001), a random-effects model was used to estimate R0 in this study. The impact of covariates on the estimated R0 was also assessed by univariate meta-regression. Data were analyzed using Stata version 11 (StataCorp., College Station, TX, USA).
Ethics Statement
As a systematic review, this study did not need ethical approval.
RESULTS
We identified 85 studies, of which 23 were duplicates, leaving 62 reports. A total of 55 reports passed the initial screening, and 23 reports passed the full-text assessment for eligibility (Figure 1). The reasons for exclusion were as follows: reporting of effective reproductive number instead of R₀ and insufficient data. Finally, we included 23 studies in this systematic review (Table 1). No studies were excluded due to poor quality. In the current study, 23 studies with 29 records that estimated the R0 of COVID-19 were entered into the analysis. The studies used a broad range of methods to estimate R0 for COVID-19. All the studies included in the meta-analysis were conducted in 2020 in China. The mean R0 reported in the articles was calculated as 3.38±1.40, with a range of 1.90 to 6.49. More information is shown in Table 1.
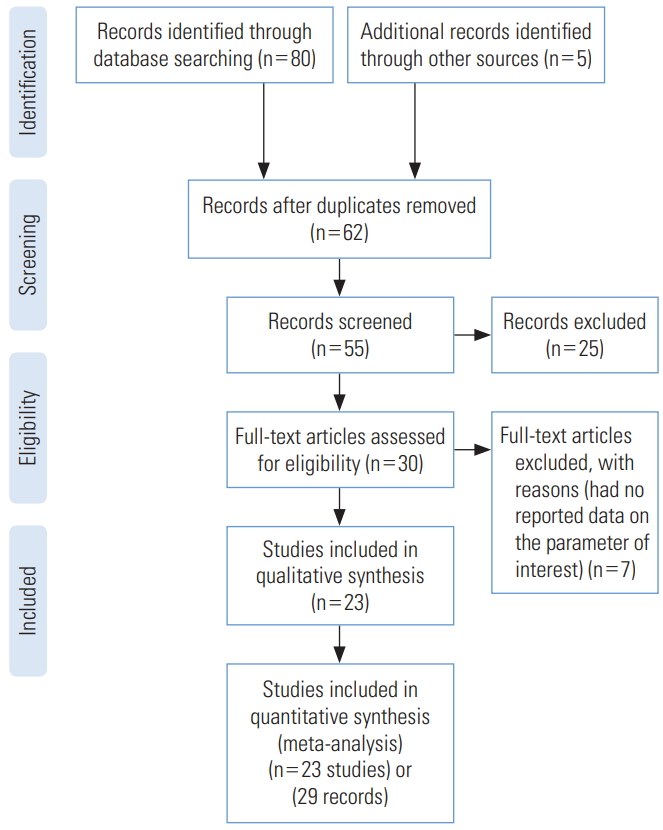
PRISMA (Preferred Reporting Items for Systematic Reviews and Meta-Analyses) flow diagram for the studies included in the current meta-analysis.

Descriptive characteristics of the studies included in the meta-analysis
Pooled Estimation of Basic Reproduction Number
According to the results of the random-effects model, the pooled R0 for COVID-19 was estimated as 3.32 (95% CI, 2.81 to 3.82). This means that each person infected with COVID-19 transmitted the infection to between 3 and 4 susceptible people on average (Figure 2, Table 2). There was significant heterogeneity among studies (I2=99.4%, p from the chi-square test for heterogeneity <0.001, and T2=1.72) (Table 2).
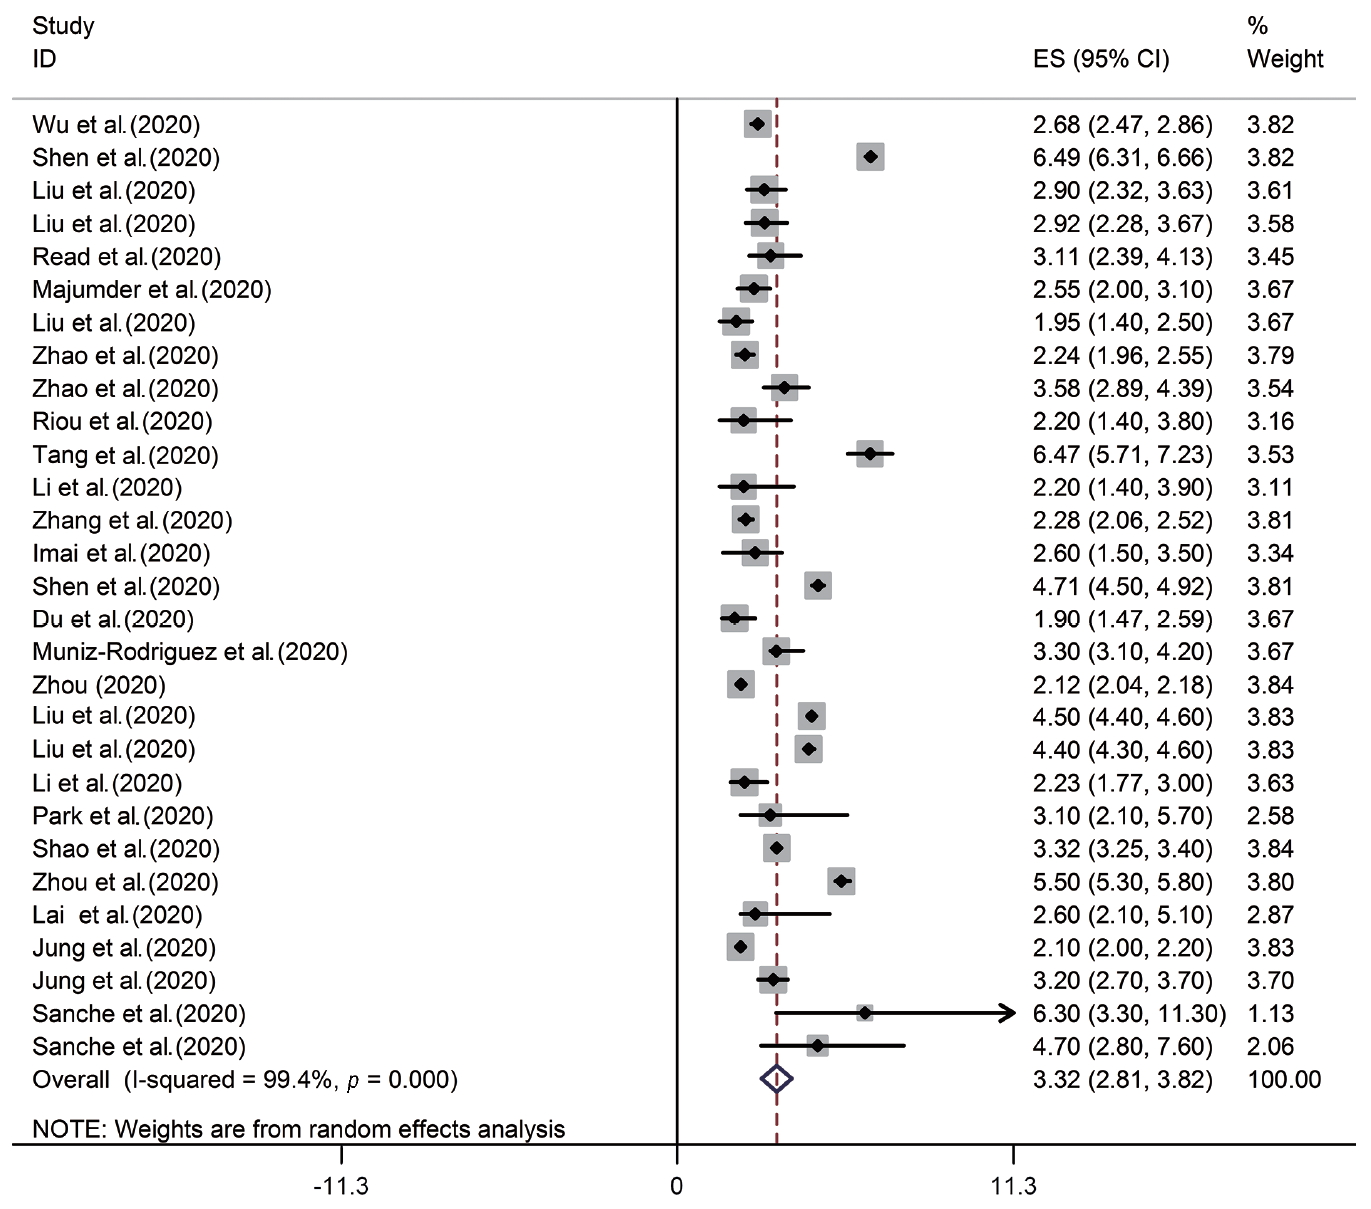
Forest plot of the estimated basic reproduction number of coronavirus disease 2019. ES, effect size; CI, confidence interval.

Pooled estimation of the basic reproduction number of coronavirus disease 2019
Meta-regression
The meta-regression analysis showed that the type of model used to estimate R0 did not have a significant effect on heterogeneity among studies (p=0.81). The distribution of the estimated R0 according to the model used is shown in Figure 3. The numbers on the χ-axis in Figure 3 represent the type of method used to estimate R0, using the following coding: stochastic Markov chain Monte Carlo method: 1, dynamic compartmental model; 2, statistical exponential growth model; 3, statistical maximum likelihood estimation; 4, mathematical transmission model; 5, mathematical incidence decay and exponential adjustment; 6, stochastic simulation of early outbreak trajectories; 7, mathematical susceptible, exposed, infected, and resistant (SEIR)-type epidemiological model; 8, other mathematical models; 9, networked dynamics metapopulation model; 10, Fudan-Chinese Center for Disease Control and Prevention model; 11, susceptible, exposed, infected and quarantined (SEIQ) model; 12, coalescent-based exponential growth and a birth-death skyline model; 13, coalescent-based exponential growth and a birth-death skyline model; and 14, type of model not mentioned.
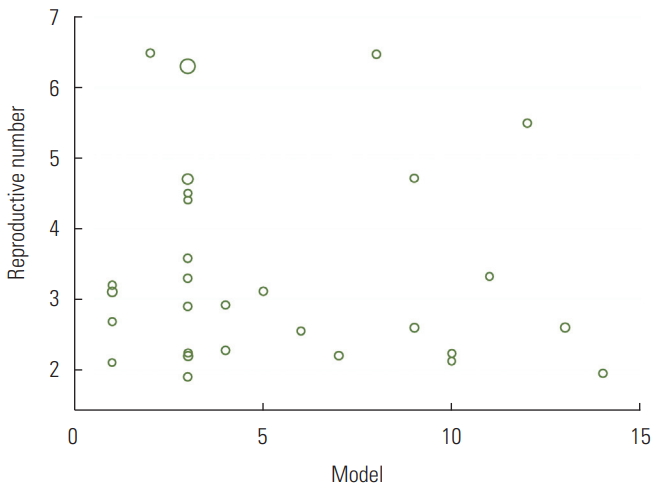
Distribution of the estimated basic reproduction number according to the model used.
DISCUSSION
It is necessary to estimate the R0 of COVID-19 to determine the severity and size of the pandemic, as well as to design appropriate interventions and responses to protect the population and to control the spread of the disease [35]. The estimated R0 value is important in infectious disease epidemiology because the intensity of transmission must be reduced by 1-1/R0 to eliminate the outbreak. For example, at R0=2.5, this fraction is 60.0%, but at R0=3.2, this fraction is 68.7%. Mathematical models play an important role in decision-making during outbreak control [36]. Our systematic review and meta-analysis found that the overall R0 was 3.32 (95% CI, 2.81 to 3.82), which is higher than the WHO estimates of 1.4 to 2.5 (11) but similar to the results of an earlier review of 12 articles that were conducted in China (11). Our estimation is similar to the R0 values estimated for the severe acute respiratory syndrome epidemic in Beijing, China (R0=4.91) [37], and for Middle East respiratory syndrome in Jeddah, Saudi Arabia (R0=3.5 to 6.7) [38]. Such a high R0 indicates that the virus can go through at least 3 to 4 generations of transmission [22]. Similar to reviews of R0 for other pathogens [39-41], it is important to highlight regarding our results that R0 is not an intrinsic characteristic of a given pathogen, but rather describes the transmissibility of that pathogen within a specific population and setting. The estimated R0 depends on factors such as social and demographic variables, the estimation method used, the validity of the underlying assumptions, and the biology of the infectious agent. For example, the frequency of contacts may depend on population size and cultural factors, which can vary across regions. In addition, estimates of R0 may be somewhat error-prone for reasons such as data insufficiency and the short time period analyzed. As more studies are done and more data are produced, the hope is that this error will be reduced. Our results showed significant heterogeneity among studies (I2=99.3%, p from the chi-square test for heterogeneity <0.001, and T2=1.72). One reason for this issue is that it is difficult to calculate the exact number of infected cases during an outbreak. The variation in R0 values reported by different studies indicates that precisely estimating R0 is rather difficult. Additionally, R0 can be affected by environmental factors and modeling methodology [12]. There are many calculation methods for R0 [42]. Our review was restricted to Chinese articles. For other countries, surveillance data are needed either to calculate R0 or to extrapolate R0 estimates from a comparable setting.
It also seems necessary to consider the reasons why high R0 values were reported in some studies. Modeling assumptions may be a reason for this issue. Usually, high R0 values are calculated in the early stages of an epidemic, both because of the small sample size and the lack of awareness about the disease, which results in inadequate preventive measures being taken. Since the number and patterns of people’s contacts in different populations vary because of factors including culture and the level of literacy in the community, R0 values vary among different populations and even among subgroups of a single population. In fact, the total value of R0 in a population is the average of the R0 subtypes in that community. It is therefore important to note that even if the total R0 value in a population is low (even less than 1), the likelihood of transmission in some subgroups of that population may still be high. Given the rapid spread of the disease and the dependency of the effectiveness of control measures on factors such as the frequency of asymptomatic infections and the potential for disease transmission before symptom onset, COVID-19 seems to be relatively difficult to control. As a measure used to quantify the transmissibility of a disease in a population, R0 is dependent on the population as well as the method of calculation. Our findings suggest that measures such as preventing large gatherings, restricting transportation, and closing schools and universities may be necessary to control this pandemic.
CONCLUSIONS
Considering the estimated R0 for COVID-19, reducing the number of contacts within the population is a necessary step to control the epidemic. So Implementation of the social distancing program, preventing large gatherings, restricting transportation, and closing schools and universities may be necessary to control this pandemic. The estimated overall R0 was higher than the WHO estimate.
Notes
CONFLICT OF INTEREST
The authors have no conflicts of interest associated with the material presented in this paper.
FUNDING
None.
ACKNOWLEDGEMENTS
We thank all the authors involved in collecting and processing data.
Notes
AUTHOR CONTRIBUTIONS
Conceptualization: YA, MS. Data curation: YA, MS, MT. Formal analysis: YA, MS. Funding acquisition: None. Methodology: YA, MS. Project administration: MS. Writing - original draft: YA, MS, MT. Writing - review & editing: YA, MS, MT.