Interpretation of the Basic and Effective Reproduction Number
Article information

Abstract
In epidemiology, the basic reproduction number (R0) is a term that describes the expected number of infections generated by 1 case in a susceptible population. At the beginning of the coronavirus disease 2019 (COVID-19) pandemic, R0 was frequently referenced by the public health community and the wider public. However, this metric is often misused or misinterpreted. Moreover, the complexity of the process of estimating R0 has caused difficulties for a substantial number of researchers. In this article, in order to increase the accessibility of this concept, we address several misconceptions related to the threshold characteristics of R0 and the effective reproduction number (Rt). Moreover, the appropriate interpretation of the metrics is discussed. R0 should be considered as a population-averaged value that pools the contact structure according to a stochastic transmission process. Furthermore, it is necessary to understand the unavoidable time lag for Rt due to the incubation period of the disease.
INTRODUCTION
As a key parameter of infectious disease epidemiology, the basic reproduction number (R0) and reproduction number (R), defined as the expected number of infected individuals from an infectious person in a totally or partially susceptible population, respectively, were frequently referenced during the early stages of the coronavirus disease 2019 (COVID-19) pandemic [1,2]. Although common misconceptions surrounding the metrics have been addressed [3], confusion persists related to the threshold characteristics of R0, R, and the effective reproduction number (Rt). To respond to infectious disease outbreaks, it is crucial to understand these metrics in more detail in order to improve communication and understanding among the fields of public health and social science. Thus, this article aims to highlight some points of caution related to R0 and Rt.
Stochastic Population-averaged Characteristics of Basic Reproduction Number and Reproduction Number
The estimation of R0 and R is largely reliant upon on the estimation method, contact structure, and epidemiological parameters such as the infectious period and incubation period [3]. In addition, it must be kept in mind that these estimates are population-averaged values during the epidemic period. Since the study population is usually not totally susceptible, it is appropriate to term these estimates as R, not R0. The estimation of these metrics involves averaging values at the study population level, which in turns requires averaging variations across regions and contact structures. Therefore, the estimates should be applied only at the study population level and not to subgroups of the study population. Specifically, these metrics can have values above 1 in a certain region or contact network, even if the estimated population-averaged value is below 1. Even more importantly, the presence of asymptomatic and undetected cases of COVID-19 may bias the estimation of R. However, since a certain proportion of infected persons would be asymptomatic at the population level, the estimated R is expected to be reliable since R is the ratio of the number of infected cases to the number of cases showing symptoms during the study period.
In epidemiological theory, R has a threshold centered on 1. However, R is not related to the intensity of transmission. Furthermore, it neither measures nor reflects the risk of infection [3]. Thus, when R is below 1, there are still newly infected cases for a certain period. In particular, in the early phase of an epidemic, the disease dynamics are strongly affected by the initial conditions [4]. Therefore, the number of infected individuals attributed to an infected person in the early phase can be above 1, even though R is less than 1 [4]. Secondly, even if R is above 1, it is possible that the disease will die out since the transmission of an infectious disease is a branching process with a negative binomial probability distribution. The distribution is defined by 2 parameters, mean and dispersion, with the former being R and the latter referring to variance. Even if R is greater than 1, if the variance is high, the probability of extinction increases. The reason for this is that under such circumstances, most of the infected individuals have a low R, whereas a few infected people have a high R; in this sense, the overall situation resembles the disease dynamics when R<1. Nonetheless, this possibility clearly decreases as R increases or dispersion decreases [5]. Whether or not a certain disease goes extinct is also related to critical community size, which is defined as the smallest population in which the disease would not go extinct without re-introduction [4]. Thus, a disease with R>1 can be eradicated if the population number is under the critical community size.
Taken together, R is a population-averaged value during an epidemic period. The literature suggests that each R and its variance differ according to the region, contact structure, and time. It is appropriate to estimate and interpret each R based on a careful consideration of its epidemiological implications.
Effective Reproduction Number
In order to assess the current dynamics of infectious disease transmission in a timely manner, Rt is commonly utilized. This metric can be used to quantify the efficacy of control measures for a disease in real time [6]. In order to estimate Rt, it is crucial to use the number of the cases, the serial interval, and time of symptom onset. As these data are commonly not publicly available during epidemics, especially for an emerging infectious disease, the absence of data can bias Rt. In particular, a surveillance system can only report the incidence of symptoms, not the incidence of infections. Thus, Rt illustrates the delayed dynamics of transmission due to time lag, including the incubation period and delayed reports. That is, the estimates reflect the dynamics of the time period when the current symptomatic cases were infected, not the current dynamics. Likewise, the estimates should be carefully interpreted if the metric is based on the reported dates [7]. For example, as shown in Figure 1, if the infected case is ideally reported at time T2 (“Report 1” in Figure 1), the Rt estimated from symptom onset will show the transmission dynamics at time T1. However, if Rt is estimated using the report data at time T3 (“Report 2” in Figure 1) due to the time lag of surveillance (“Time lag” in Figure 1), there is a high likelihood of uncertainty whether the estimated Rt describes the dynamics at time T1. Although information on the incubation period could overcome these uncertainties, there are still limitations for emerging infectious diseases [8]. Lastly, as Rt is similar to R0 in that it is a population-averaged value, it is recommended to be estimate and apply Rt for each cluster or administrative level.
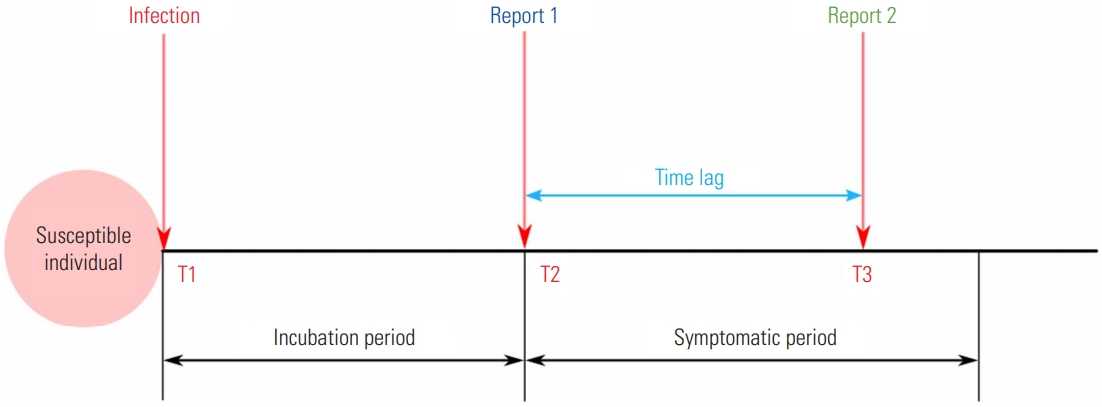
Different reporting time points by the surveillance system based on the incidence of symptoms (report 1) and by the one with time lag (report 2).
Other Factors Affecting Variation
In this study, we discussed the R only in terms of the contact rate, not in terms of the probability of infection per contact and infectious period, for which variation can occur across different types of the pathogen responsible for a disease (e.g., subtypes, clades, or strains). This factor is highly likely to add uncertainty to the estimated R in that the estimates show the population-averaged characteristics of infection dynamics. However, these possible variations could be reflected through appropriate components in a mathematical model. Moreover, if cases of the same type are spatiotemporally clustered, as in previous COVID-19 clusters, the suggestions provided in this article to estimate the R for clustered or epidemiologically-related populations could increase the likelihood that the estimates will reflect the epidemiological characteristics of different types of the pathogen.
CONCLUSION
In order to understand transmission dynamics, it should be recognized that the R is a population-averaged value reflecting a stochastic transmission process. Moreover, to understand the transmission dynamics of infectious diseases, Rt, which requires data related to the serial interval and time of symptom onset, should be considered as well as R0.
Ethics Statement
This paper is a perspective, so it did not need ethical approval.
Notes
CONFLICT OF INTEREST
The authors have no conflicts of interest associated with the material presented in this paper.
FUNDING
This study was supported by a grant from the Institute of Information & Communication Technology Planning & Evaluation (IITP) funded by the Korea government (No. 2018-0-00430).
ACKNOWLEDGEMENTS
The authors would like to thank Jin A Kim (Daegu Center for Infectious Diseases Control and Prevention) and Kyung-Duk Min (Seoul National University) for their comments on the manuscript.
Notes
AUTHOR CONTRIBUTIONS
Conceptualization: JSL, SIC, SR, SIP. Funding acquisition: SIP. Writing – original draft preparation: JSL. Writing – review & editing: JSL, SIC, SR, SIP.