Investigating the Relationship Between Accessibility of Green Space and Adult Obesity Rates: A Secondary Data Analysis in the United States
Article information

Abstract
Objectives:
In spite of the importance of green space for reducing obesity-related problems, there has been little exploration of whether access to green space (e.g., parks and recreational facilities) influences the obesity rate of adults in the United States. The purpose of the study was to investigate the relationships among accessibility of green space, obesity rates, and socioeconomic and demographic variables among adults living in the State of Indiana, United States.
Methods:
We conducted a secondary data analysis to investigate the relationships among accessibility to green space, obesity rates, and socio-demographic variables with employing Geographic Information System in order to measure the accessibility of green space.
Results:
This study found that accessibility of green space served as a strong predictor of reduced obesity rates among adults (β=-2.478; p<0.10). In addition, adults with higher education levels, as well as better access to green space, were found to have even lower obesity rates (β=-0.188; p<0.05). Other control variables such as unemployment rates, food security, and physical inactivity are additional factors that influence obesity rates among adults.
Conclusions:
Accessibility of green space may play an important role in facilitating physical activity participation and reducing obesity rates.
INTRODUCTION
Obesity is a global public health issue as it is significantly associated with serious health problems and risks such as cardiovascular disease, cancers, and diabetes, and premature mortality [1,2]. In spite of the seriousness of obesity-related health problems, the prevalence of obesity has been accelerating every year in the United States (U.S.), affecting individuals in all segments of society. In particular, a report from the National Health and Nutrition Examination Survey (2017) indicates that in the U.S., over 40% of young adults aged 20 years to 39 years, 44% of middle-aged adults aged 40-59 years, and 43% of older adults have obesity. Also, compared with other age groups, adults have the highest prevalence of severe obesity. Due to the increasing prevalence of obesity among adults, and its detrimental health consequences, public health researchers and policy makers have sought ways to reduce obesity-related health risks and promote effective prevention programs for adults.
A growing body of literature suggests that accessibility to green space (GS Access) such as parks and recreational facilities can play an important role in promoting physical activity (PA) and reducing obesity-related health problems [3,4]. Researchers have found that proximity to available green space promotes PA participation and increased energy consumption [5,6]. In a longitudinal cohort study of the relationship between accessibility to park and recreational resources and obesity, it also found that proximity to recreational programs and parks was associated with reduced obesity rates [7].
However, other studies have found no association between access to green space and reduction of obesity [8,9]. For example, proximity to playgrounds was not associated with childhood obesity among children in the U.S. [10]. Also, the number of PA facilities such as parks and playgrounds to which Canadian children had access was not associated with their obesity rates [11]. The relationship between access to outdoor recreation facilities and obesity rates concluded the mixed results due to the variety of methods and instruments used, ranging from self-reports to objective measurements [12].
Besides mixed findings on the relationship between access to green space and obesity, there is limited research on how access to green space (e.g., parks and recreational facilities) is associated with obesity rates among adults. While some studies have provided evidence that the accessibility of green space is associated with the reduction of obesity rates among children [13,14], there has been little exploration of whether access to green space influences the obesity rate of adults in the U.S. Thus, this investigation of the relationship of access to green space and selected adults living in the State of Indiana had three main objectives. First, we aimed to investigate our hypothesis that there would be a negative association between accessibility of green space and obesity rates among adults, based on the assumption that adults who can easily access green space are likely to be physically active and, as a result, report low obesity rates. Second, previous studies found that education level was an important factor in reduced the adult obesity rates [15,16]. We explored whether the level of education moderates the association between GS Access and the adult obesity rates. Last, in this study we examined the associations of certain socioeconomic and demographic variables with adult obesity rates. Based on previous findings, we focused on variables found to be positively or negatively associated with obesity rates, including population, county area, unemployment rate, median household income, sex, food insecurity, and physical inactivity as control variables in this study [17,18].
METHODS
Sample and Data Sources
For this study we conducted a secondary data analysis to investigate the relationships among GS Aceess, obesity rates, and socio-demographic variables. Our four main data sources included: (1) the 2018 United States Diabetes Surveillance System to obtain adult obesity rates; (2) the Indiana Department of Natural Resources to identify the physical locations of green spaces such as parks and recreational facilities; (3) the United States Census Bureau to access state and county boundaries for geospatial data; and (4) the 2020 County Health Rankings to obtain our control variables. The dataset included information on all 92 counties in the State of Indiana. In this research, the unit of analysis was at the county-level as it more precisely represented access to green space in the state [19].
Measurements
We first collected all variables except the independent variables since we used Geographic Information System (GIS) skills to measure the independent variables, which is the accessibility of green space in each of Indiana’s 92 counties. Also, we calculated the county area using geometry calculation in ArcGIS. Then, we modeled and analyzed the relationship between the accessibility of green space and adult obesity rate the county-level. Moreover, we generated two geographic maps of 92 counties’ adult obesity rates (Figure 1) and the GS Aceess (Figure 2).

A map of adult obesity rate in Indiana (by county-level).

A map of accessibility to green space rate in Indiana (by county-level).
Dependent Variable
The World Health Organization defined adult obesity as a body mass index (BMI) equal to or greater than 30 kg/m2. For this research, the adult obesity rate was calculated as the percentage of the adult population (age 20 and older) that reported a BMI equal to or greater than 30 kg/m2.as reported in the 2020 County Health Rankings.
Independent Variable
Based on previous studies, we defined green space as parks and recreational facilities that are managed by federal, state, local (e.g., municipal city level) and non-government organizations and schools. Accessibility is a measure of how easily people can reach their intended destination, including such aspects as available transportation, shopping mall, work, and healthcare facility [20]. Green space accessibility refers to how many green space are available to residents within a specified distance or time interval [21]. We operationalized accessibility of green space using buffer analysis with ArcMap [22], which created a buffer area with a specific width around the shape of space. Buffer analysis refers to “based on the concept of proximity, a buffer can be created to divide the map into two areas, one within the specified distance of the selected map feature and the other beyond the specified distance” [23].
Calculating the accessibility of green space involved three steps. First, we generated a one-mile buffer zone around such green space as parks and recreational facilities since it was identified as a reasonable representation of an individual’s walking distance [24]. Second, we calculated the total coverage of green space including the one-mile buffer zone by exploiting the dissolve function. Last, we standardized the total coverage of green space for each county as the ratio of total green space to total county area in order to accommodate different county sizes. Equation of the GS Access per county is below:
Covariates
We controlled seven social, economic, environmental, and geographical factors, which simultaneously influenced our focal independent and dependent variables. These seven elements and their sources included: (1) county population (resident population, the United States Census Bureau), (2) county area (geometry calculation in ArcGIS), (3) unemployment rate (percentage of the population ages 16+ unemployed but seeking to work, Bureau of Labor Statistics), (4) median household income (the income where half of the households in a county earn more and half of the households earn less, the United States Census Bureau), (5) percentage of females (percentage of the population that is female, the United States Census Bureau), (6) food insecurity (percentage of households lacking adequate access to food, Core Food Security Module of the Feeding America survey), and (7) physical inactivity (percentage of adults ages 20+ reporting no leisure-time PA, the Behavioral Risk Factor Surveillance System from United States Diabetes Surveillance System). Excluding county area, we obtained all covariates from the 2020 County Health Rankings.
Education Level (Moderator)
In this research, the education level was measured as the percentage of adults’ educational attainment with post-secondary education. Previous researchers found that education level meaningfully influenced the adult obesity rate [16,17]. Thus, we predicted that the level of education moderates the association between adult obesity rate and accessibility of green space in that higher levels increase the likelihood of using available facilities.
Data Analysis
We used Stata version 16 (StataCorp., College Station, TX, USA) statistical package to analyze the data. We conducted two multiple regression analyses to calibrate the unique association of (1) the focal independent variable (GS Access) and (2) the interaction between the focal independent variable and the moderator (education level). We used heteroskedasticity-robust standard error to deal with heteroskedasticity. We log-transformed two skewed variables: GS Access and population. We mean-centered the focal independent variable and moderator to reduce multicollinearity [25] and enhance interpretability of the moderating effect. Lastly, we estimated variance inflation statistics to check multicollinearity. The variance inflation statistics indicated that the model did not suffer from multicollinearity.
We used the following equation to test an estimate of the main association of GS Access on obesity:
In equation 1, subscript i represents the county. β1 GS Accessi represents the main effect of GS Access on obesity %.
Similarly, we used the following equation to test the interaction effect of GS Access and Education on obesity:
In equation 2, the main coefficients of interest are γ1 GS Accessi and γ3 GS Accessi *Educationi, which represents the interaction effect of GS Access and Education on obesity %. ɛi represents the random error term.
Ethics Statement
This study used public use data sets that are not individually identifiable and does not constitute human subjects research.
RESULTS
Table 1 summarized the descriptive statistics of the 92 Indiana counties including mean, standard deviation, minimum, 25 percentile, median, 75 percentile, and maximum. The prevalence of county-level adult obesity in Indiana varied from 25.00% to 43.00%, with a mean of 34.12%. The prevalence of accessibility of green space varied from 2.50% to 35.32%, with a mean of 8.30%. The mean of GS Access indicated the average accessibility rate of green space in Indiana. The prevalence of some post-secondary education varied from 30.00% to 87.00%, with a mean of 56.00%. Table 2 summarized the Pearson correlation. Socioeconomic variables including education, unemployment, and median income are significantly correlated with the dependent variable. Moreover, the physical inactivity is positively correlated with obesity rate. Table 3 summarized the results of the multiple regression analyses. Column 1 of Table 3 provided the main model (Equation 1). Specifically, the regression model examined adult obesity as a function of GS Access, education, and control variables. The overall model was significant: F(9, 82)=3.94, p<0.01; the predictors together explain 24.1% of the adult obesity rate’s variance. Column 1 of Table 3 indicates that a county’s GS Access was commensurate with its adult obesity rate (β=-2.478; p<0.10). In terms of covariates, county area (β=-0.000; p<0.01) and food insecurity (β=-0.883; p<0.10) were associated with reduced adult obesity rates, while population and physical inactivity were associated with increased adult obesity rates. The covariates of the main model were consistent with the adult obesity rate. The coefficient of population (β=2.476; p<0.001) and physical inactivity (β=0.277; p<0.05) had a positive association with obesity rates, and the coefficient of county area (β=-0.000; p<0.05) and food insecurity (β=-0.883; p=0.393) had a negative association with obesity rates. Both were statistically significant determinants of adult obesity, indicating that county area and food insecurity have negative association with the obesity rate, while population and physical inactivity have positive association with the obesity rate.
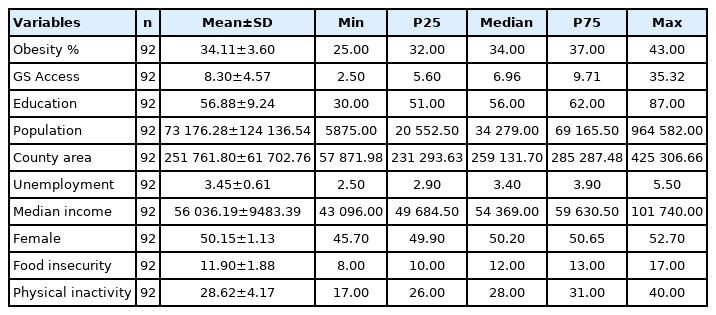
Descriptive analysis of all variables

Correlations analysis

Multiple regression analysis of the association between GS Access and adult obesity
Column 2 of Table 3 provided the full model (Equation 2). Specifically, the regression model examined adult obesity as a function of GS Access, education, the interaction between GS Access and education, and covariates. The overall model was significant: F(10, 81)=5.04, p<0.01. Compared to Column 1, the F-statistics of Column 2 were significantly greater, suggesting the full model fits the data better. Together the predictors explained 27.2% of the variance and thus more variance of the adult obesity rate than the main model (Column 1). Column 2 of Table 3 indicated that a county’s GS Access was associated with a reduction in the adult obesity rate (β=-2.881; p<0.05). More importantly, the interaction between GS Access and education indicated that the effect of GS Access on reducing adult obesity became greater as education level increased (β=-0.188; p<0.05), suggesting that education level magnified the effect of GS Access on reducing the adult obesity. The covariates of the full model investigated the moderating effects were consistent with the adult obesity rate. The coefficient of population (β=2.728; p<0.01), unemployment (β=1.449; p<0.1), and physical inactivity (β=0.253; p<0.05) had a positive sign. The coefficient for county area (β=-0.000; p<0.01) and food insecure (β=-0.734; p<0.10) was negative. Both were statistically significant determinants of adult obesity, indicating that county area, and food insecurity were negatively associated with obesity rate, while population, unemployment rate, and physical inactivity were positively associated with obesity rate.
DISCUSSION
In this study, a combination of GIS and multiple regression was used to investigate the relationships among accessibility of green space (e.g., parks and recreational facilities), adult obesity, and other control variables. It was found that accessibility of green space served as a strong predictor of reduced obesity rates among adults. It also suggested that adults who had better access to green space are less likely to experience obesity than those with poorer access in the county-level. In addition, the county which has adults with higher education levels, as well as better access to green space, were found to have even lower obesity rates. Other covariates such as unemployment rates, food security, and physical inactivity are additional factors that influence obesity rates among adults in the county-level.
Prior studies have produced mixed findings on the relationship between accessibility of green space and obesity rates [7-9,12], some indicating a negative relationship and others no statistically significant relationship between the two variables. The results of the present study, in which accessibility of green space was found to serve as a negative predictor of obesity rates among adults, confirm previous research indicating that access to green space and recreational facilities can be a valuable resource for the reduction of adult obesity rates.
This study adds to literature on the relationship between availability of green space and obesity rates, in which the majority of previous studies have focused on childhood obesity [7,26], by showing that accessibility of green space is also related to reduction of adult obesity rates in the county-level. This finding is aligned with studies demonstrating that adults who actively engaged in green space, such as walking or running on trails and participating in recreational programs, are likely to become physically active [3,27], which is linked to reduced risks of county’s adult obesity rate. Research has suggested that certain socioeconomic and demographic variables are important determinants of obesity rates among adults [17,18,28]. Among these variables, previous studies have found an inverse relationship between educational attainment and prevalence of obesity among adults [15,16]. The present study supports the importance of educational level as individuals who had better access to green space and reported high educational levels were likely to have lower BMIs than those with less educational attainment, suggesting an association between educational level and likelihood of active engagement in green space opportunities.
In addition, unemployment has been found to be a major risk factor for obesity prevalence in global contexts [28,29]. These studies have demonstrated that unemployed individuals were among the groups most vulnerable to high-risks of obesity. The positive association between unemployment and obesity found in this study is aligned with these previous findings and indicates that the job status serves as a predictor of obesity prevalence among adults.
Research on food insecurity and obesity has produced contradictory results. Some studies have indicated a negative association between food insecurity and obesity [30,31]; others have found no association between the two variables [32,33]. High obesity prevalence occurred among only women with low food security, and sex affected the relationship [34]. The present study provided evidence that food insecurity predicted high obesity risks of adults, indicating the importance of physical, social, and financial access to nutritious food to the reduction of obesity rates.
Limitations and Future Studies
Some limitations of the study need to be addressed. First, this study mainly focused on the relationship between accessibility of green space and obesity rates among adults. The nature of adults’ participation in green spaces and their levels of engagement in recreational resources, which can be factors influencing health outcomes, were not addressed. Future researchers might investigate how frequency and/or intensity of participation in green spaces and recreational programs is associated with health benefits among adults. In addition, the early, middle, and late stages of adulthood may influence accessibility of green space and their lifestyles. Exploring the relationships among a different stage of life, obesity rates, and accessibility of green space can provide more insightful information and resources to researchers and practitioners. The data of green spaces do not provide every year since there is not much difference by year. In this study, we cannot estimate the temporal relationship between obesity rate and green spaces due to limit of acquiring the data.
A methodological limitation of this research is the use of buffer analysis, in which one mile was the radius of the coverage of green space, to define accessibility for residents. Buffer analysis is limited to the linear distance surrounding facilities, and network analysis overcomes the limitations of buffer analysis by taking into account other means of accessibility than an estimation of walking distance [35]. Future research that employs road-based network analysis might generate more accurate definitions of GS Aceess.
With rates of obesity in the U.S. continually indicating a serious public health crisis, it is important to identify all methods that people can use to combat the problem. Previous research, and results from this study, help to make the case for the influence of green space on an individual’s ability to increase levels of PA. Although questions may still remain regarding the amount of immersion needed, we now have enough empirical evidence to inform the general public that they should consider participation in green space as part of the tools at their disposal to meet recommended level of PA. Parks and recreation professionals should use their influence through the management of vast amounts of green space to create easy and attractive access. This study also draws home an important point that to truly make a difference there are disparities related to socioeconomic status such as food insecurity, level of education, and employment that act as barriers and must be addressed.
Notes
CONFLICT OF INTEREST
The authors have no conflicts of interest associated with the material presented in this paper.
FUNDING
None.
ACKNOWLEDGEMENTS
None.
Notes
AUTHOR CONTRIBUTIONS
Conceptualization: JK. Data curation: SL. Formal analysis: SL. Funding acquisition: None. Methodology: JK. Project administration: WR. Visualization: WR. Writing – original draft: JK, SL. Writing – review & editing: JK, WR.