Measuring the Burden of Disease in Korea, 2008-2018
Article information

Abstract
The study aims to examine the current status and differences in the burden of disease in Korea during 2008-2018. We calculated the burden of disease for Koreans from 2008 to 2018 using an incidence-based approach. Disability adjusted life years (DALYs) were expressed in units per 100 000 population by adding years of life lost (YLLs) and years lived with disability (YLDs). DALY calculation results were presented by gender, age group, disease, region, and income level. To explore differences in DALYs by region and income level, we used administrative district and insurance premium information from the National Health Insurance Service claims data. The burden of disease among Koreans showed an increasing trend from 2008 to 2018. By 2017, the burden of disease among men was higher than that among women. Diabetes mellitus, low back pain, and chronic lower respiratory disease were ranked high in the burden of disease; the sum of DALY rates for these diseases accounted for 18.4% of the total burden of disease among Koreans in 2018. The top leading causes associated with a high burden of disease differed slightly according to gender, age group, and income level. In this study, we measured the health status of Koreans and differences in the population health level according to gender, age group, region, and income level. This data can be used as an indicator of health equity, and the results derived from this study can be used to guide community-centered (or customized) health promotion policies and projects, and for setting national health policy goals.
INTRODUCTION
Summary measures of population health (SMPH) are indicators that summarize the health of a population into a single number [1], and are increasingly used to prioritize healthcare and social service delivery and planning in various public health reporting systems [2]. There are two types of SMPH—health expectancies and health gaps—of which health gaps measure the difference between actual population health and some specified norm or goal. Disability-adjusted life years (DALYs), an SMPH measuring health gaps, was introduced as a new metric to quantify the burden of diseases. The DALYs for a disease or health condition are calculated as the sum of years of life lost (YLLs) from premature death and years lived with disability (YLDs) [3]. One DALY can be considered as one lost year of “healthy” life. The sum of DALYs is defined as a measure of the gap between the current state of health and the ideal state of health for the entire population to live to an old age free from disease and disability [4].
The DALY was initially conceptualized as a health indicator for the first Global Burden of Disease (GBD 1990) study [5,6]. Moreover, since 2010, the Institute for Health Metrics and Evaluation (IHME) has regularly published updated GBD study findings for countries around the world [7]. The IHME is continuously developing and improving the methodology and data recruitment for estimating DALYs [2]. The results of GBD studies are useful for making country-level comparisons of health levels from various aspects. However, the GBD approach is complex and data-intensive, and integrating different types of information from many sources requires multiple assumptions, methodological choices, and often compromises [8]. In particular, the epidemiological indicators collected by IHME, which are the data inputs into GBD study, may not be the most useful and up-to-date information at the national level [8], and thus may not generate comprehensive evaluations considering the socio-cultural characteristics of each country. Furthermore, since IHME uses methods such as Bayesian prior and smoothing for comparison between countries [9], when comparing the burden of disease over time within a country, it is important to use national data to prevent data distortion and increase the accuracy of results. Therefore, if a country has the resources and capability to calculate the national level estimate of the burden of diseases, it is reasonable to conduct a national level burden of disease study on its own. Most importantly, in order to get a more detailed and in-depth understanding of the health status required for a country to formulate its own health policy, countries should ideally take initiative to measure their own health levels and generate comparisons among various groups within the country.
In Korea, since the National Health Insurance Service (NHIS) covers more than 99% of the total population, it is relatively easy to calculate valid and reliable input parameters (such as incidence and prevalence) using claims data. Therefore, since the early 2000s, efforts have been made to calculate Korea’s burden of disease using our own data sources [10]. Most recently, in 2019, the Korean burden of disease research team published the DALY calculations for the period 2007-2015 [10]. Since then, the measurement methodology has been continuously updated and developed in Korea, and the scope has been expanded to understand health levels by demographic and sociological factors—gender, age, region, and income level.
The purpose of this study is to examine the burden of disease among Koreans during 2008-2018 by updating the results of the previous calculation of the burden of disease for 2007-2015.
OVERVIEW OF THE KOREAN NATIONAL BURDEN OF DISEASE STUDY
This study uses a methodology based on the GBD, modified to fit the context of Korea to measure the DALYs of the Korean population in 2018 and applied the incidence-based approach in the calculation [11]. In this study, all diseases that cause mortality and morbidity are structured in a four-level classification hierarchy, producing mutually exclusive and collectively exhaustive levels [12]. At level 1, the highest level, all diseases were broadly classified into three categories: communicable, maternal, neonatal, and nutrition disease (CMNN), non-communicable diseases (NCDs), and injuries. At the lower level, level 2, all diseases were classified into 21 disease groups, and at levels 3 and 4, 260 disease groups were classified [10]. A detailed explanation and list of the disease classification system is presented in a previous study that introduced the DALYs of the Korean population in 2007-2015 [10].
DATA SOURCES AND COMPUTATION OF DALYs
YLDs were calculated by multiplying the incidence cases, average duration, and disability weights. To obtain epidemiological indicators such as incidence and prevalence by year and disease, we used the Korean National Hospital Discharge In-depth Injury Survey for injuries and the NHIS claims data for the other diseases. We extracted the number of hospitalizations and outpatient visits (1-5 times) for each specific disease in order to calculate valid prevalence and incidence cases when using claims data, based on which, we applied the prevalence criteria for each specific disease. In particular, to calculate the incidence cases, we applied a washout period of at least one year to a maximum of five years, depending on the characteristics of the disease [10]. However, in the case of the Korean National Hospital Discharge In-depth Injury Survey (published biennially by the Korea Centers for Disease Control and Prevention), as the publication of data for 2017-2018 was delayed, the 2016 data were used instead of the YLD rate per 100 000 population for injuries in 2017-2018. Disability weights are quantitative scale that indicate the degree of disability of a specific disease or health condition from 0 (perfect health) to 1 (equivalent to death). In this study, the disability weights for specific causes measured through self-report surveys in Korea was applied [13]. To estimate the duration of disease and the average age at onset, we used the DisMod-II program by World Health Organization, and the cases of infectious diseases such as influenza and varicella were calculated directly using claims data.
When calculating YLLs and YLDs, an age-weighting rate of 4.0% and a time discount of 3.0% were applied. For each disease, DALYs were calculated as the sum of YLLs and YLDs. We calculated YLLs, YLDs, and DALYs per 100 000 population and presented these results in units per 100 000 population as the YLL rate, YLD rate, and DALY rate. The mid-year population by year, gender, and age were collected from Statistics Korea [14]. A specific methodology for calculating DALYs, excluding differences in some data sources, is detailed in Kim et al. [10]’s study.
To measure the level of health by various demographic and sociological factors, DALY rates by region and income level were calculated in addition to the DALY rates by gender, age, and disease. Since NHIS calculates the insurance premium based on beneficiaries’ wages and income, we used the insurance premium as a proxy indicator to classify the income level of the population in this study. Therefore, the equivalized annual household income based on insurance premium was used and divided into five quintiles according to gender. The equivalized annual household income is derived as follows:
For regional classification, 250 Korean municipal-level administrative districts were selected, consisting of 67 cities (“si”), 114 counties (“gun”), and 69 districts (“gu”) nationwide. Health promotion programs are implemented at the si, gun, and gu levels; hence, we considered administrative districts as the units used to identify the regional differences in health level.
TREND OF BURDEN OF DISEASE AND INJURIES, 2008-2018
In 2018, the DALY rate per 100 000 population was 26 171 in Korea. For the period between 2008 and 2018, the DALY rate for the Korean population showed a steady rise, with the YLL rate decreasing by 4.2% and the YLD rate increasing by 22.2%. The YLL rate and YLD rate were 4198 (16.0%) and 21 973 (84.0%), respectively, constituting the DALY rate for the Korean population in 2018 (Figure 1). Korea is characterized by a population that is aging at the fastest rate in the world and is expected to become a “super-aged society” in 2026, with more than 20% of the population aged 65 years and above [15]. However, the aging of the population without a reduction in the burden of disease may lead to an increase in the number of older adults with diseases and disabilities, which may lead to a sharp increase in long-term care costs and health insurance costs. Consequently, this can emerge as a threat to national finances. In this context, the increase in the YLD rate may be partly due to the improved access to healthcare, but it also means that the period of living with disease or disability is prolonged due to the aging of the population [10].
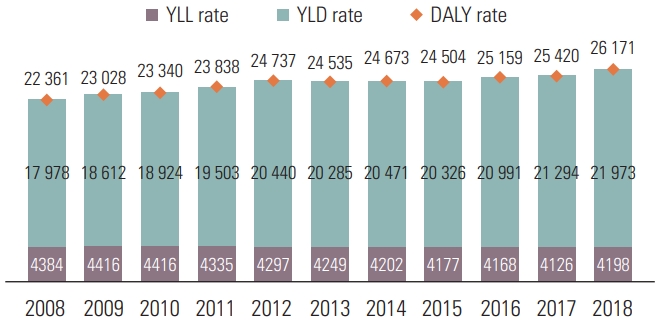
DALY rates per 100 000 population in Korea by year, 2008-2018. DALY, disability-adjusted life-year; YLL, years of life lost; YLD, years lived with disability.
Observing the trend of the DALY rate per 100 000 population by gender, the burden of disease increased between 2008 and 2018 for both men and women, showing a greater rate of increase among men (19.0 vs. 15.1%). In 2008, the DALY rate for men was lower than that for women; as the gap between men and women gradually narrowed, in 2017, the DALY rate for men was 255 units higher than that for women (Figure 2). It seems that the steep rise in the burden of disease caused by major diseases ranked in the top in men contributed.
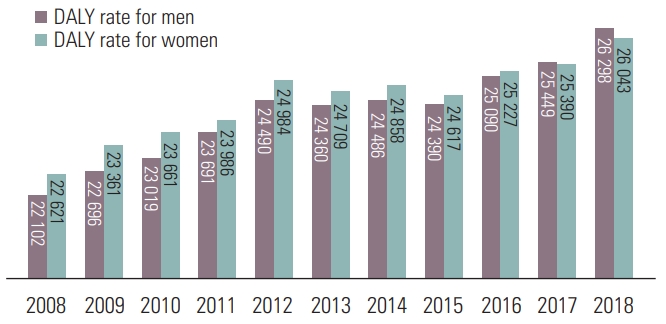
DALY rates per 100 000 population in Korea by gender in 2008-2018. DALY, disability-adjusted life-year; YLL, years of life lost; YLD, years lived with disability.
We examined the change in the ranking of top diseases with a high disease burden over the period from 2008 to 2018. Diabetes mellitus remained at the top of the list, and low back pain, ischemic heart disease, ischemic stroke, osteoarthritis, falls, and major depressive disorder rose in the rankings. Among the top 10 diseases that account for more than 40% of the total burden of disease, the rankings changed slightly, and there was no significant change in trends. Most importantly, the burden of Alzheimer’s disease and other dementias, which did not even exist in the list of top 20 causes 10 years ago, rose sharply and took the ninth place. The very steep rise in Alzheimer’s disease and other dementias is very noticeable, which seems to represent the issues faced by the rapidly aging population. In contrast, asthma, which had the second rank in 2008, was pushed down to the 14th place (Figure 3).
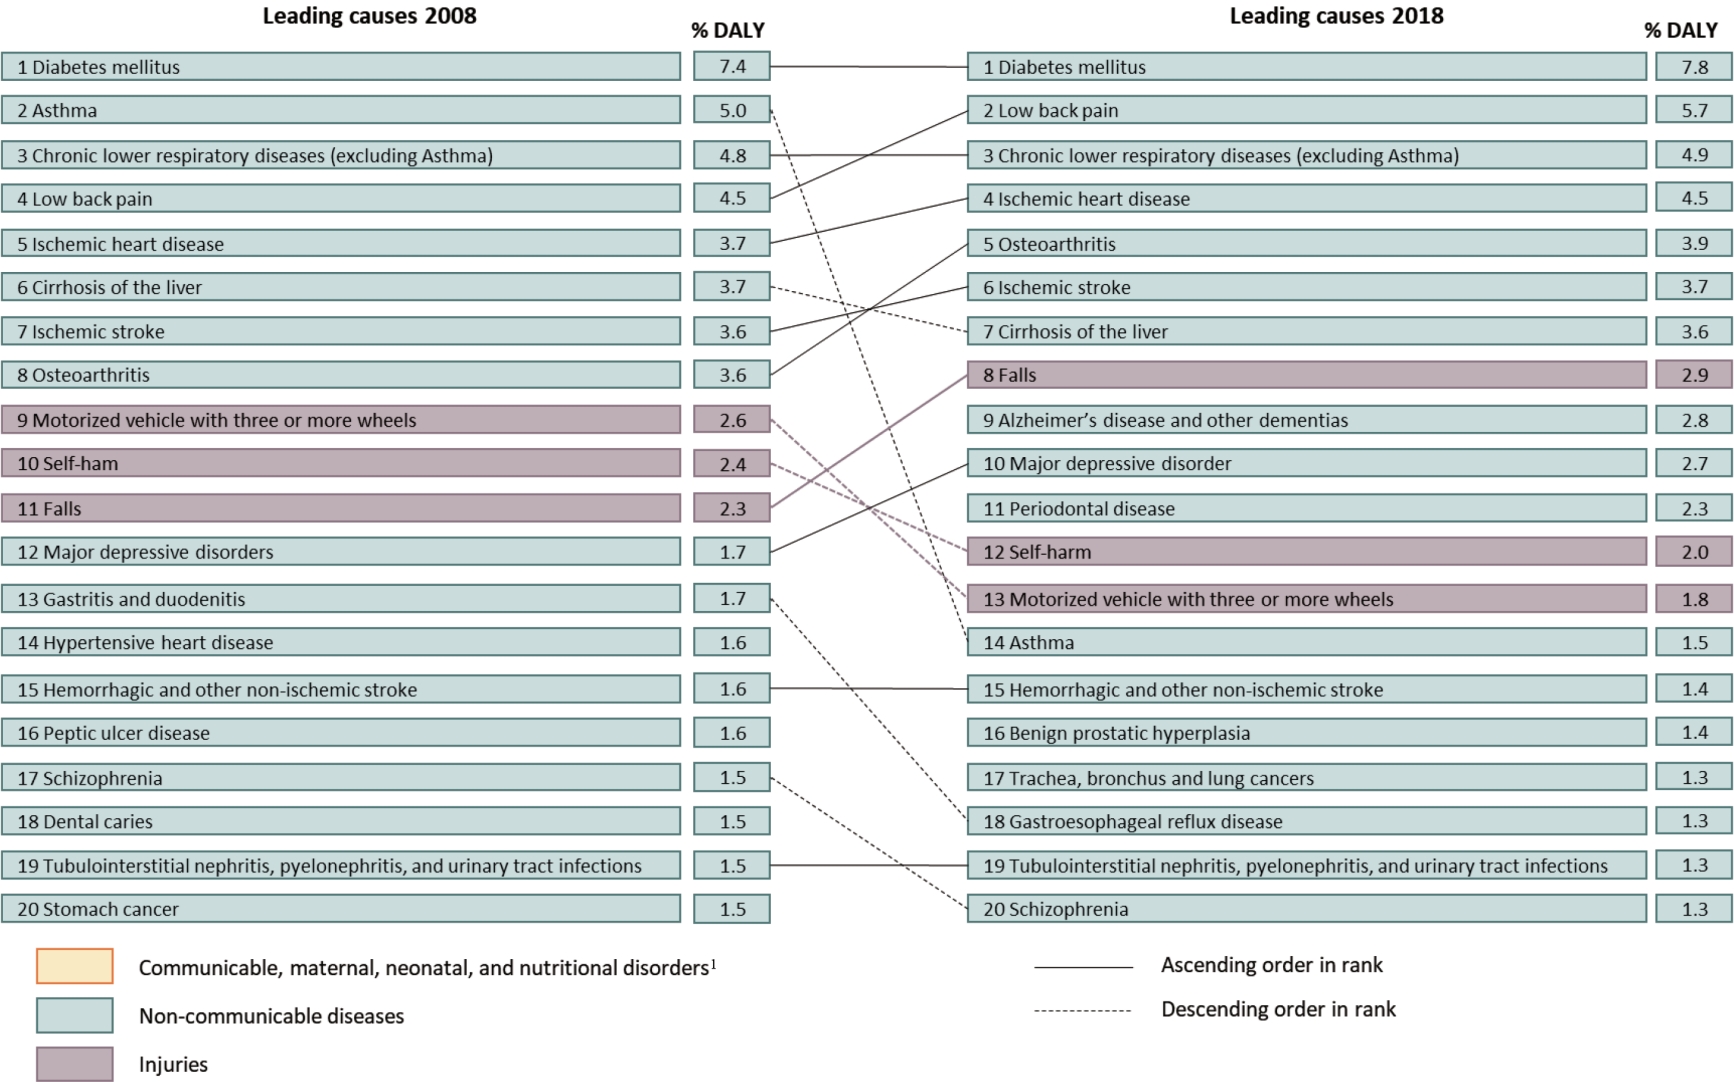
Top 20 leading specific causes (levels 3 and 4) of DALY rates for 2008 and 2018, with proportion of total DALY rate. DALY, disability-adjusted life-year. 1Dis- eases categorized as “Communicable, maternal, neonatal, and nutritional disorders” were not found in leading 20 causes; therefore they are not shown in the figure.
While refining the methodologies for DALY calculations, we updated the previous results of the 2007-2015 Korean Burden of Disease study published in 2019. However, since methodological improvements have been made since its publication, and the burden of disease was newly calculated from 2008, it is impossible to directly compare the results of this study with the results of the burden of disease calculations in 2007-2015. First, while cancer registration data was used in the previous study for cancer, in this study, NHIS claims data were used to calculate the DALYs of cancer as done for communicable, maternal, neonatal, and nutritional disorders and NCDs. Second, to calculate the appropriate DALYs, the disability weight estimation methodology was revised, and the disability weights for the specific causes, which were revised after the GBD 2015, were calculated. Therefore, the revised disability weights used in this study were calculated based on a previous disability weight study published in 2020 [13].
BURDEN OF DISEASE AND INJURIES IN 2018
According to the calculation of the burden of disease by gender and age group, the DALY rate increased with a higher age in men, whereas the DALY rate for women was higher in infancy and childhood (0-8 years) than in adolescence (9-19 years). In 2018, men showed a higher DALY rate than women in the age groups of adolescents (9-19 years), middle-aged adults (50-69 years), and older adults (70 years and above). This pattern was slightly different for both YLL rate and YLD rate. The YLL rate in men was higher than that in women in all age groups except in infancy and childhood. Meanwhile, the YLD rate of women was higher than that of men among younger adults (20-49 years) and middle-aged adults (50-69 years) (Figure 4).
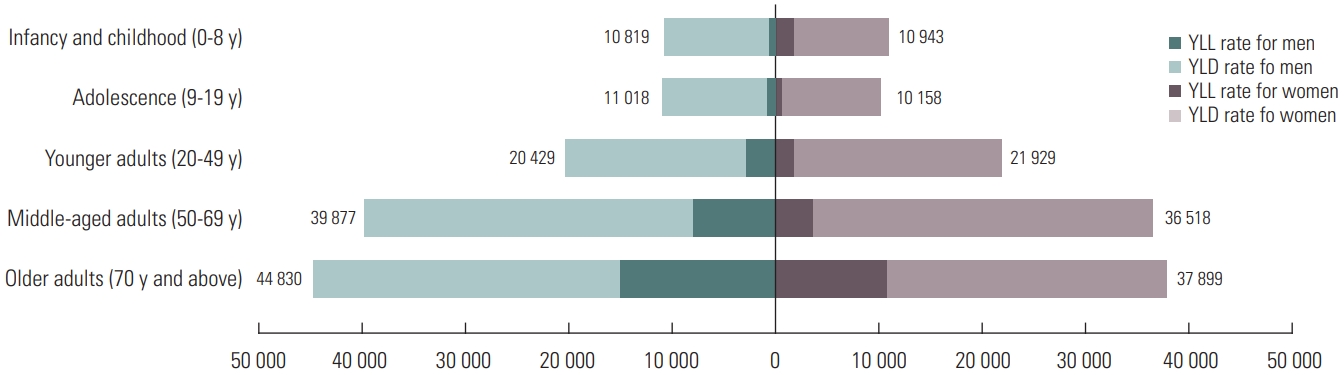
DALY rates per 100 000 population by gender and age group in Korea, 2018. DALY, disability-adjusted life-year; YLL, years of life lost; YLD, years lived with disability.
In the higher-level (level 1) disease group, CMNN accounted for 3.2% of the total DALY rate, while NCDs and injuries accounted for 86.8% and 10.0%, respectively. In the case of CMNN and NCDs, although women had a higher DALY rate compared to men, men had a higher-level of disease burden than women for injuries. Among the middle-level (level 2) disease groups within the CMNN category, the DALY rate for maternal disorders was the highest at 383; in men, the level-2 disease group of diarrhea, lower respiratory infections, meningitis, and other common infectious diseases had the highest DALY rate at 206, and among women, maternal disorders were the highest at 762. Moreover, within the NCDs category, diabetes, urogenital, blood, and endocrine diseases had the highest DALY rate at 3502; in men, diabetes, urogenital, blood, and endocrine diseases reported the highest DALY rate at 3890, and among women, musculoskeletal disorders were the highest at 3687. In the injuries disease group, unintentional injuries other than transport injuries were the highest at 1201 (1399 for men and 1004 for women) (Table 1).
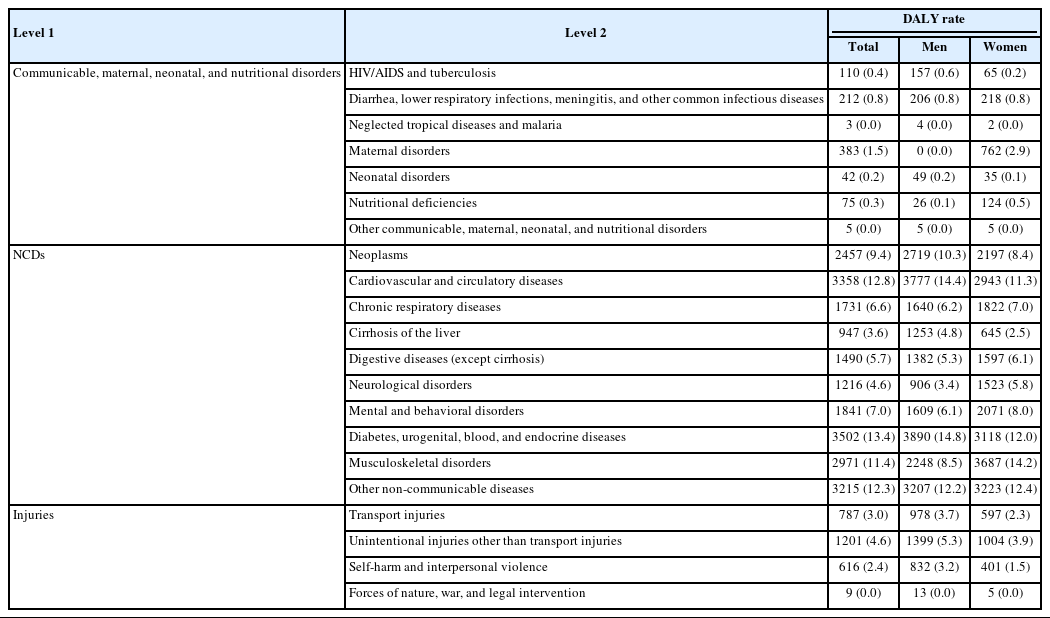
DALY rates per 100 000 population by gender and level 2 disease groups in Korea, 2018
Among the middle-level (level 2) disease groups, the DALY rate for diabetes, urogenital, blood, and endocrine diseases was 3502. This ranking was the highest, accounting for 13.4% of the total DALY rate in Korea. This was followed by cardiovascular and circulatory diseases, with the DALY rate at 3358 (12.8%); other NCDs, at 3215 (12.3%); musculoskeletal disorders, at 2971 (11.4%); and neoplasms, at 2457 (9.4%). For men, the DALY rate for diabetes, urogenital, blood, and endocrine diseases was the highest at 3890, accounting for 14.8% of the total DALY rate. For women, the DALY rate for musculoskeletal disorders was the highest at 3687 (accounting for 14.2% of the total DALY rate among women) (Table 1).
Among the lower-level (levels 3 and 4) disease groups, the DALY rate per 100 000 population for diabetes mellitus was the highest at 2046 (7.8%), followed by low back pain at 1484 (5.7%), chronic lower respiratory diseases (excluding asthma) at 1273 (4.9%), ischemic heart disease at 1182 (4.5%), and osteoarthritis at 1016 (3.9%). The DALY rates of the top three diseases accounted for 18.4% of the total burden of disease for Koreans in 2018, and that of the top 10 diseases accounted for 42.6%. For men, the DALY rate for diabetes mellitus was the highest 2451, and for women, the DALY rate for low back pain was the highest at 1777 (Supplemental Materials 1 and 2).
We examined the size of health inequality between regions and income levels using DALY rates to understand the health level of the Korean population from the perspective of health equity. The DALY rates calculations for the 250 municipal-level administrative districts of Korea revealed that the highest regional burden of disease was 42 594, and the region with the lowest burden of disease reported 19 167, with a regional gap of 23 427. To exclude the influence of the upper and lower extreme values, the DALY rates of the upper and lower 20% regions were calculated to be 31 483 and 24 388, respectively, and the difference in the DALY rate in the upper and lower 20% regions was 7095. The calculations for the difference in disease burden by region for each of YLL and YLD revealed that the difference in the YLL rate between the regions with the highest and the lowest YLL rate was 7072, and the difference in the YLL rate between the upper and lower 20% regions was 2890. The difference between the regions with the highest and the lowest YLD rate was 19 314, and the difference in the YLD rate between the upper and lower 20% regions was 4655 (Supplemental Material 3). It was observed that the burden of disease was relatively low mainly in large cities such as Seoul and Gyeonggi-do.
We examined the burden of disease by dividing the income level into five quintiles from the bottom 20% to the top 20%; the disease burden tends to decrease as the income level increases. The calculations by income level revealed that the DALY rate of 32 199 in the lowest income level (Q1), was 1.37 times higher than that of the highest income level (23 580 per 100 000 in Q5). The gap in disease burden between the first and second quintiles (low- income levels) was significantly higher than the difference in the remaining groups. For men, the difference in the DALY rate between the lowest (Q1) and the highest income quintiles (Q5) was 1.46 times, and for women, it was 1.27 times (Supplemental Material 4). It is necessary to identify the health level of the lowest-income group separately from the other groups to ensure relevant support for the group. Furthermore, it will be possible to better understand the current situation if the income level is further subdivided even within the first income quintile.
IMPLICATIONS OF THIS STUDY AND SUGGESTIONS FOR FUTURE RESEARCH
We expanded the scope of calculating the burden of disease at the national level by calculating the burden of disease for Koreans by gender, age, and disease, as well as by income level and region. Through this analysis, we confirmed the possibility of the national burden of disease study to further subdivide the entire population and identify the characteristics of disease burden according to group characteristics. The results of this study enable the measurement of health level disparities in the population by gender, age group, region, and income level, and it can be used as an indicator of health equity. Therefore, it can be used as useful data for community-centered (or customized) health promotion policies and projects and for setting national health policy goals.
Although this study presented the current state of health in the country from various aspects, it did not identify major risk factors for the burden of disease in the Korean population. Future studies should identify risk factors (smoking, drinking, physical activity, and obesity) for disease burden by population group characteristics (region, income level, etc.) and identify effective interventions for each population group. Moreover, it would be meaningful to identify the most appropriate and cost-effective risk factor intervention to reduce the burden of disease on the entire population by performing data-driven simulations.
CONCLUSION
GBD study consistently publishes results that allow comparison of health levels between countries by consistently applying the burden of disease estimation methodologies of all countries. However, it is difficult to guarantee the accuracy of the epidemiological indicators for estimating the burden of disease, and there are limitations in that it is impossible to compare the health level between various groups in the country. Countries with high-quality data sources on the health status of their population need to better understand their own health status by applying and expanding GBD study, and should encourage researchers to engage in the national burden of disease study.
Ethics Statement
This study was approved by the Korean NHIS (No. NHIS-2019- 1-182) and the Institutional Review Board (IRB) of Korea University (IRB No. KUIRB-2018-0024-01). The board waived the requirement for informed consent.
SUPPLEMENTAL MATERIALS
Supplemental materials are available at https://doi.org/10.3961/jpmph.21.478.
Top 30 leading specific causes (levels 3 and 4) of DALY rate in South Korea, 2018.
DALY rates per 100,000 population by gender and level 3 and 4 disease groups in South Korea, 2018.
DALY rate, YLL rate, and YLD rate, per 100,000 population by region in South Korea in 2018.
DALY rates per 100,000 population by income level in South Korea in 2018.
Notes
CONFLICT OF INTEREST
The authors have no conflicts of interest associated with the material presented in this paper.
FUNDING
This research was supported by a grant of the Korea Health Technology R&D Project through the Korea Health Industry Development Institute (KHIDI), funded by the Ministry of Health & Welfare, Republic of Korea (grant No. HI18C0446).
ACKNOWLEDGEMENTS
The funding agency had no role in the study design, analysis and interpretation of the data, or the preparation of the manuscript. This study was administratively supported by the National Health Insurance Service of Korea (NHIS-2019-1-182).
Notes
AUTHOR CONTRIBUTIONS
Conceptualization: SJY, HP, MWJ, IHO, MO. Data curation: YEK, YSJ. Formal analysis: YEK, YSJ. Funding acquisition: SJY. Methodology: SJY, HP, MWJ, IHO, MO. Project administration: YSJ. Visualization: DSG. Writing – original draft: YSJ, YEK, MO, DSG. Writing – review & editing: SJY, HP, IHO, MWJ.