Measuring Trends in the Socioeconomic Burden of Disease in Korea, 2007-2015
Article information

Abstract
This study estimated the direct and indirect socioeconomic costs of 238 diseases and 22 injuries from a social perspective in Korea from 2007 to 2015. The socioeconomic cost of each disease group was calculated based on the Korean Standard Disease Classification System. Direct costs were estimated using health insurance claims data provided by the National Health Insurance Service. The numbers of outpatients and inpatients with the main diagnostic codes for each disease were selected as a proxy indicator for estimating patients’ medical use behavior by disease. The economic burden of disease from 2007 to 2015 showed an approximately 20% increase in total costs. From 2007 to 2015, communicable diseases (including infectious, maternal, pediatric, and nutritional diseases) accounted for 8.9-12.2% of the socioeconomic burden, while non-infectious diseases accounted for 65.7-70.7% and injuries accounted for 19.1-22.8%. The top 5 diseases in terms of the socioeconomic burden were self-harm (which took the top spot for 8 years), followed by cirrhosis of the liver, liver cancer, ischemic heart disease, and upper respiratory infections in 2007. Since 2010, the economic burden of conditions such as low back pain, falls, and acute bronchitis has been included in this ranking. This study expanded the scope of calculating the burden of disease at the national level by calculating the burden of disease in Koreans by gender and disease. These findings can be used as indicators of health equality and as useful data for establishing community-centered (or customized) health promotion policies, projects, and national health policy goals.
INTRODUCTION
The economic burden of disease is an important indicator since it estimates the maximum possible cost savings of preventing disease [1]. However, the methods of estimating the economic burden of disease vary widely among studies [2-5]. Some studies have included only medical costs in their estimates, while others have used depreciation or a human resource approach when calculating indirect costs. Therefore, the results of estimations of the economic burden of disease can vary greatly between studies. These differences make it difficult to directly compare the economic burden for each disease among various studies.
To implement the most effective and efficient policies with the limited resources of the healthcare sector, it is necessary to evaluate the direct and indirect costs of medical care and health services. Such an evaluation plays a very important role in ensuring that healthcare costs are allocated appropriately. There are many ways to measure the effectiveness of healthcare expenditures, including mortality and morbidity, prevalence and incidence as epidemiological factors, disability-adjusted life span, and socioeconomic loss due to disease [6]. These are fundamental data to ensure that limited socioeconomic resources are utilized in the most efficient way for patients and society [2,5,7,8].
According to the 2019 National Health Insurance Statistics Yearbook [9], nearly 53 million people were covered by the social security system in Korea and 51 million had health insurance coverage. At that time, health insurance premiums were US$50 billion and medical costs were US$73.8 billion, corresponding to increases of 9.7% and 10.5%, respectively, from 2018. Reimbursement payments also increased by 10.4% from 2018, to US$55.6 billion. The socioeconomic costs of epidemiological factors, including mortality, morbidity, and disease, are very important indicators for strengthening the Korean healthcare system and promoting the welfare and health of Korean citizens.
Moreover, from 2015 to 2019, the elderly population increased by 14.5% to 7 million, resulting in a 1.6-fold increase in costs over the same period to US$30 billion. The elderly population is expected to continue to increase. By 2067, the total population of Korea is expected to shrink to approximately 40 million, with an estimated 18 million or 45.5% of the population aged 65 and over [10]. As such, Korea, which is rapidly becoming an aging society, is increasingly exposed to the risk of chronic diseases and disabilities due to aging. These trends are expected to lead to rapid increases in the social and economic burden of disease. According to a prediction of the increase in national medical costs due to the aging of the population, the ratio of national medical costs (%) to the gross domestic product (GDP) in 2030-2040 is predicted to reach 10.5% in 2030 and 12.1% in 2040 [11]. Therefore, stakeholders in the healthcare system must understand and prepare for the socioeconomic characteristics of the current and future elderly population in order to improve the quality of life in old age and ease the significant burden on Korean medical services and socioeconomic costs.
As mentioned above, the costs of health insurance are expected to increase [9], and growth of the elderly population has been predicted [10]. Thus, the increase in medical costs will have a greater impact on both society and socioeconomic factors, necessitating the inclusion of costs that are not covered by medical costs or health insurance alone.
Although it is important to measure the socioeconomic burden for better medical and healthcare services, previous Korean studies estimating the socioeconomic burden have generally been conducted on a single disease or group of diseases [2,5,7,8]. Moreover, several studies have separately estimated the socioeconomic costs of all diseases [12]. The analysis of the socioeconomic costs of major diseases for establishing health policies of the National Health Insurance Service (NHIS) in 2017 applied a broad definition of disease prevalence, ranging from an individual who has visited a medical facility at least once to a patient regardless of outpatient or inpatient treatment [13]. In addition, most studies on disease burden have been conducted using an incidence-based approach or health-related parameters, such as disability-adjusted life span and the economic burden for disease groups [3].
The human capital approach is the most widely used method to measure the value of human life and the cost of diseases, such as the direct costs caused by diseases, the number of working days, and the loss of productivity due to premature death, considering humans as productivity factors [14]. The purpose of this study was to measure the direct and indirect socioeconomic medical costs for inpatients, outpatients, and pharmaceutical drugs related to diseases and injuries. The estimation method of a social perspective was applied based on the human capital approach, and medical cost trends were reviewed from 2007 to 2015.
METHODS
Data Sources
This study estimated the direct and indirect socioeconomic costs of 238 diseases and 22 injuries from a social perspective from 2007 to 2015. The socioeconomic costs of each disease group were calculated based on the Korean Standard Disease Classification System. Direct costs, which are the main items of costs, were estimated using health insurance claims data provided by the NHIS. The number of outpatients and inpatients was selected for each disease using the main diagnostic code as a proxy indicator for estimating patients’ medical use by disease.
Variables and Computation of Variables
The cost variables included in the socioeconomic costs are divided into direct and indirect costs. The detailed research data and formulas used to calculate each cost are listed in Table 1.

Detailed variables and data sources for measuring the socioeconomic burden of disease
Direct medical costs were divided into insured and uninsured medical costs. In this study, direct medical costs were calculated by first estimating covered medical costs using NHIS claims data [15], and then multiplying this amount by the uninsured ratio. Since Korea has a single insurer system, it was possible to determine the total costs of treatment through the health insurance claims data for all items covered by the health insurance system when diseases occurred and medical institutions were used. Therefore, inpatient and outpatient treatment costs were calculated using health insurance claims data [15]. Drug costs were estimated by applying the outpatient drug cost ratio announced by the Health Insurance Review Agency [16] in 2015 using the ratio of inpatients, outpatients, and pharmaceutical costs in 2015 [12].
However, there were limitations in estimating medical costs for uninsured items not covered by the health insurance system, considering the uninsured out-of-pocket ratio of 17.2% in 2015, which was used to measure the socioeconomic burden of disease. Therefore, in this study, the uninsured ratios of inpatient, outpatient, and pharmaceutical costs were reflected using the NHIS patient medical expenses survey [10].
Among direct costs, non-medical costs are divided into transportation and caregiver costs. Transportation costs were calculated by multiplying the average round-trip outpatient and inpatient transportation costs by the number of outpatient and inpatient visits, respectively. The number of outpatients and inpatients was based on the results of medical use in the NHIS claims data [15], and the cost of transportation was based on the Korean Health Panel data [17]. Using the International Classification of Diseases codes in the disease classification system applied to the Korea Health Panel Study data [17], disease codes were classified into infectious, chronic, injury-related, maternal, neonatal, nutritional, and mental disease groups, and the unit costs of transportation for each disease group were calculated. Due to the limitations of the data, to estimate the transportation costs in 2015, which was the base year of this study, the results calculated above were multiplied by the transportation price index cost in 2015 and 2014 (100.0/108.5), respectively.
Caregiver costs were calculated by multiplying the number of outpatient visits or inpatient visits by the average daily cost of care and the care rate. For outpatients, it was assumed that patients aged 20-69 visited the hospital without a guardian, so care costs were excluded. Inpatient care costs were applied regardless of age group. The units of care costs and the care rate were calculated using the Korea Health Panel Study data [17]. Infectious, chronic, injury-related, maternal/neonatal/nutrition, and mental disease group codes were classified using the disease classification code variables of the data source. In addition, the unit cost of care for each disease group was calculated, and the care rate (66.67%) was applied equally to all diseases. Due to limitations of the data sources, the cost of caregivers in 2015 and 2014 (100.0/98.5) was applied to the previously calculated results to estimate the cost of care in 2015, which was the base year of this study.
Indirect costs refer to production losses due to disease development. In this study, the cost of labor lost due to disease was calculated as the sum of morbidity and mortality cost. The age of the working-age population, which is subject to labor loss, was divided into 10-year increments and set to 20-88 years old. This is the result of assuming that the working-age population is 20 years to 89 years old and calculating the average life expectancy of individuals who are 80 years or older as 8 years based on age-specific life expectancy data provided by the National Statistical Office [18]. The employment rate was applied to the age group over 20 years old. In Korea, the number of elderly workers is increasing; therefore, not considering the employment rate of those aged 65 and over would lead to an underestimation. Therefore, in this study, the indirect costs were calculated by considering the employment rate for the age group between 65 and 88 [4]. To estimate productivity loss due to outpatient visits, the outpatient visit time was calculated by applying one-third of the working hours per day based on prior research.
The cost of morbidity was calculated by multiplying the number of visits to the hospital (inpatient and outpatient) during the treatment period and the average daily wage by gender and age. The average daily wage was estimated by dividing the average annual wage by 365 days. For individuals aged 70-88 years old, the employment rate was estimated using the resident registration population by 5-year age groups of the National Statistical Office [18] and the employment rate of the Korean Employment and Labor Statistics [19]. Due to limitations of the data sources, the average annual wage for 2015 was estimated by applying the wage increase in 2015 (2.9%) to 2014 against the progress previously calculated.
Mortality was calculated by multiplying the total expected income by gender, age, and disease for the year after the year of death up to the age of 88 years. At this time, the expected income was calculated using the average annual wage by gender and age to calculate the total lost income per person, and a discount rate of 3% was applied [13]. Discount rates of 0% and 5% were additionally considered for sensitivity analysis [20]. The economic burden was presented as US$1 using the 2007-2015 currency exchange rates (2007: 929.16 Korean won [KRW]; 2008: 1103.36; 2009: 1276.35; 2010: 1156.00; 2011: 1107.99; 2012: 1126.76; 2013: 1,095.04; 2014: 1053.12; and 2015: 1131.52) [10]. All statistical analyses were performed using SAS version 9.4 (SAS Institute Inc., Cary, NC, USA).
Ethics Statement
This study was approved by the Korean NHIS (No. NHIS-2019-1-182) and the Institutional Review Board (IRB) of Korea University (IRB No. KUIRB-2018-0024-01). The board waived the requirement for informed consent.
RESULTS
Trend Analysis of the Socioeconomic Burden of Disease, 2007-2015
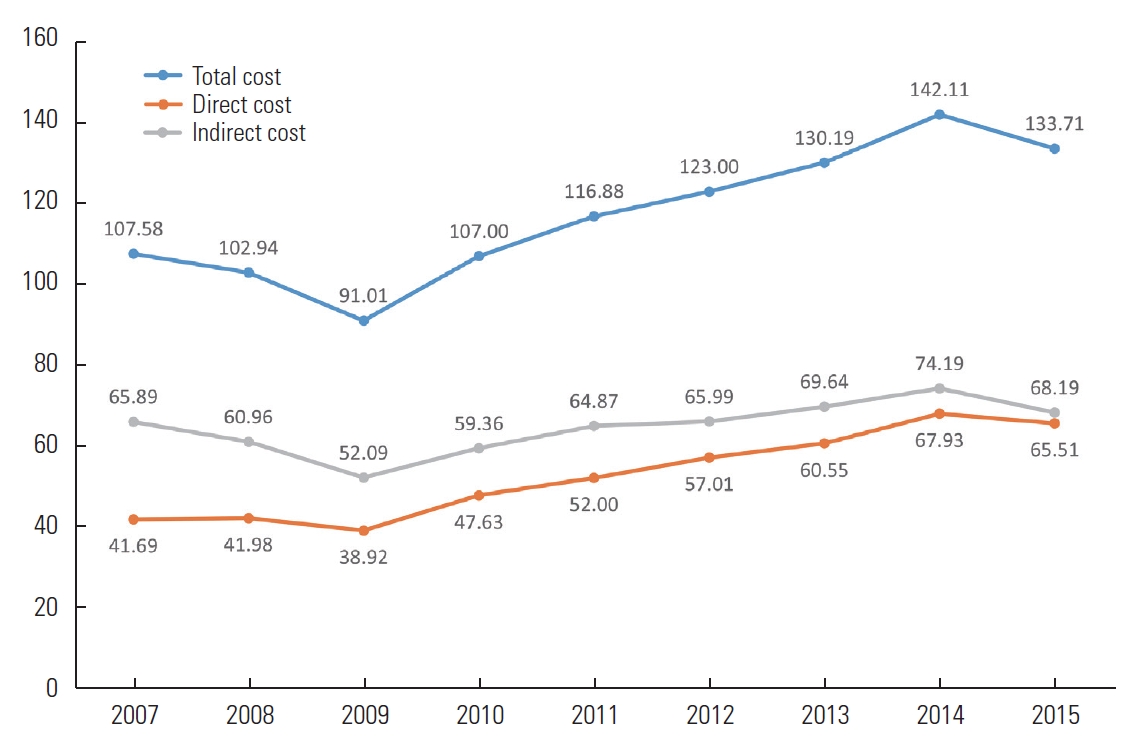
An analysis of the socioeconomic burden of disease from 2007 to 2015 showed a 20% increase over the period of the study (Figure 1). As shown in Figure 1, the overall economic burden of disease gradually decreased from 2007 to 2009 and then increased by about 10% every year from 2009 to 2015. In Korean currency, the total cost increased by about 10% every year from 99.76 trillion KRW in 2007 to 151.30 trillion KRW in 2015, which was about 51% higher than in 2007.

Trends in socioeconomic burden of disease, 2007-2015 (unit: billion US dollar).
As shown in Figure 2, in the analysis of socioeconomic burden from 2007 to 2015 of the 3 disease groups, communicable diseases (including infectious, maternal, pediatric, and nutritional diseases) accounted for 8.9% to 12.2%, non-infectious diseases accounted for 65.7% to 70.7% and injuries accounted for 19.1% to 22.8%.

Trend of the ratio of economic burden for each of the three major disease groups, 2007-2015 (unit: percentile).
Among the top 5 diseases in socioeconomic burden from 2007 to 2015 (Supplemental Material 1), self-harm took the top spot for 8 years, followed by cirrhosis of the liver, liver cancer, ischemic heart disease, and upper respiratory infections in 2007. Since 2010, the economic burden of conditions such as lower back pain, falls, and acute bronchitis has been included in the ranking. Lower back pain has been ranked second since 2010 in the ranking according to the burden of disease.
The total costs of communicable diseases from 2007 to 2015 (Figure 3) decreased from US$11.5 billion in 2007 to US$9.8 billion in 2010, increased to US$14.7 billion in 2014, and decreased again to US$13.6 billion in 2015. Figure 3 shows that the costs of non-infectious diseases decreased from US$72.5 billion in 2007 to US$59.8 billion in 2009, followed by an increase to US$99 billion in 2014, and then a slight decrease to US$94.8 billion in 2015. Injuries accounted for costs of US$23.6 billion in 2007, which decreased to US$20.2 billion in 2009, increased to US$28.5 billion in 2014, and decreased again to US$25.4 billion in 2015.
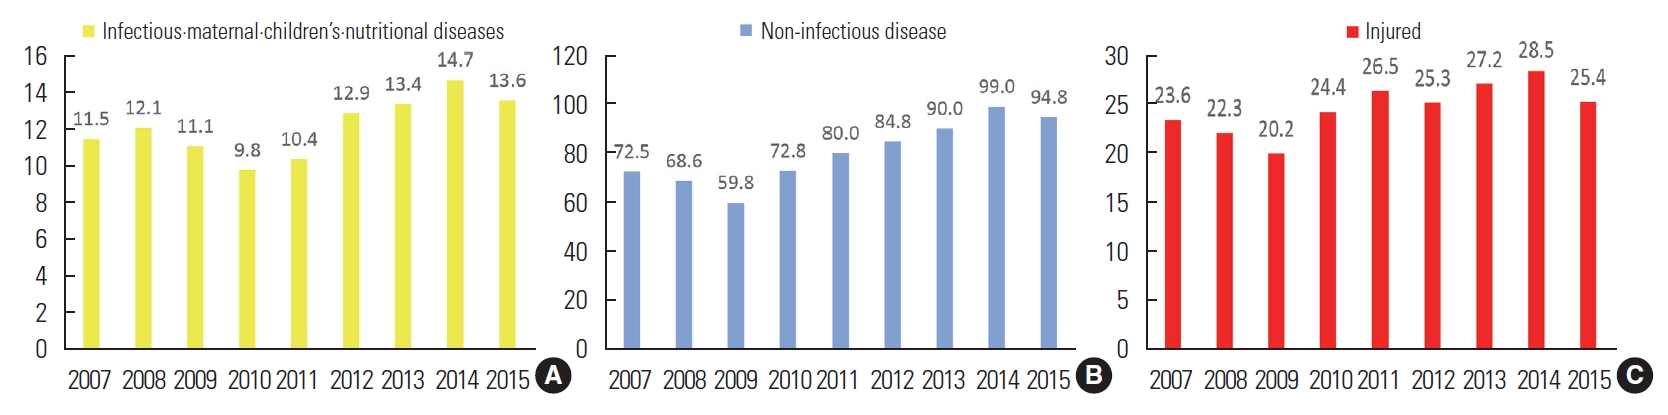
Trends in the economic burden of disease in the three major disease groups (A: infectious · maternal · children’s · nutritio nal diseases; B: non-infectious disease; and C: injured), 2007-2015 (unit: billion US dollar).
Trends in Direct Medical Costs, 2007-2015
Direct medical costs from 2007 to 2015 increased from US$41.7 billion in 2007 to US$67.9 billion in 2014, and then decreased to US$65.5 billion in 2015. According to Figure 4A, the costs for women increased by 61% from US$22.2 billion in 2007 to US$35.8 billion in 2015, while those of men increased by 52% from US$19.5 billion in 2007 to US$29.7 billion in 2015.

Trends in direct (A) and indirect (B) medical costs, 2007-2015 (unit: billion US dollar).
Trends in Indirect Medical Costs, 2007-2015
Indirect medical costs in 2007 US$61.2 billion and increased to US$77.2 billion in 2015 (Figure 4B). Moreover, in 2007 indirect costs associated with men totaled US$49.7 billion, about 4.3 times higher than those associated with women. In 2015, the indirect costs associated with men increased to US$61.2 billion, remaining 3.8 times higher than those for women (US$15.9 billion).
DISCUSSION
In this study, the disease burden for all diseases was calculated using a single methodology, and the disease burden for each disease was calculated using a more sophisticated definition of patients than has been used in previous studies. From a social perspective, in 2007-2015, the socioeconomic burden of 238 diseases and 22 injuries continued to increase. Due to socioeconomic and cultural changes in Korea, the ranking of the disease burden changed from 2007 to 2015, and lower back pain, falls, and acute bronchitis entered the top rankings of diseases according to their socioeconomic burden. Although some diseases groups, including self-harm, lower back pain, and acute bronchitis ranked high, these diseases have received little attention, underscoring the relevance of the socioeconomic burden as an indicator that can be reflected when determining the priority and need of policies. Appropriate disease-specific policies are needed to minimize the socioeconomic burden. But the burden of disease or economic burden of disease corresponds to the size of the problem and is one of the criteria considered for resource allocation. Therefore, caution is needed in that cost-effectiveness may be more important in terms of resource allocation.
The total costs of the disease burden in this study steadily increased every year from 2007 to 2015. However, between 2007 and 2015, there was a change in the value of the Korean currency against the dollar due to the international economic situation [10]. Therefore, the findings of this study, as reported in US dollars, should not be misunderstood in terms of the continuous increase in the cost of disease burden in Korea from 2007 to 2015.
Economic burden research measures the economic burden caused by illness and disease—that is, the consumption of economic resources and loss of productivity, also called cost of illness (COI) analysis. COI analysis is one of the most widely used analysis methods by individual researchers and several international organizations, such as the United Nations and the World Health Organization [1]. The human capital approach considers humans as a factor of productivity and is the most widely used method to measure the value of life and the cost of disease, including the direct costs of disease, the number of working days lost, and the loss of productivity due to premature death [14].
In existing disease burden studies focusing on factors influencing the disease burden, data were not available on differences in the disease burden according to the severity of the disease and socioeconomic factors; instead, only age and gender were considered. The universal weights used in existing disease burden studies may be inappropriate to apply in countries with different social and cultural backgrounds, and the weighted value changes based on the prevalence of disease patterns and treatment development; thus, once a weight is derived, it cannot be viewed as an invariant value. The accuracy of the major data sources used to estimate epidemiological indicators of disease is an important issue in determining the validity of disease burden indicators; however, studies to supplement the validity of epidemiological indicators, such as comparative analyses of various data sources, are insufficient.
When examining diseases with high socioeconomic costs from 2007 to 2015 as divided into 3 major disease groups, noninfectious diseases had the largest burden, followed by injuries, infectious diseases, and finally maternal and children’s nutritional diseases. All 3 groups fluctuated, with increases and decreases from 2007 to 2015, but showed an overall increase in socioeconomic costs. This is consistent with the ratio of the burden of disease of the 3 major disease groups in 2018, as shown in the previous Korean disease burden study using disability-adjusted life-years (DALYs) from 2008 to 2018 [6]. In summary, the socioeconomic cost burden for the 3 major disease groups from 2007 to 2015 is consistent with trends in the disease burden using DALYs in 2021 [6]. Direct medical services and mid-term to long-term healthcare services tailored to patients and their caregivers, which can reduce or maintain the socioeconomic and disease burden caused by the 3 major disease groups, should be improved.
The proportion of socioeconomic healthcare costs relative to the country’s total production (GDP) from 2007 to 2015 has fluctuated from 9.17% in 2007 to 9.13% in 2015 [10]. In 2015, it was 9.13%, the lowest ratio during the research period, and in 2012, it was 9.62%, the highest ratio during the research period [10]. The socioeconomic medical costs caused by diseases have a significant impact on the national economy. Therefore, it is necessary to establish medical policies for the socioeconomic medical expenses caused by diseases to reduce costs. By doing so, it should be possible to provide an opportunity to improve the efficiency and delivery of medical services and benefits through ongoing analyses and monitoring using the latest available healthcare and medical cost data.
Of the top 5 diseases in terms of the burden of socioeconomic costs from 2007 to 2015, self-harm ranked the highest for the entire period. In 2007, cirrhosis of the liver, liver cancer, ischemic heart disease, and upper respiratory infections followed in order of cost. Since 2010, diseases such as lower back pain and acute bronchitis have also been included in the ranking. This is in line with the Korean disease burden study using DALYs from 2008 to 2018 [6]. A similar trend can be seen between 2008 and 2018 in the leading 20 causes of diseases affecting the disease burden as quantified using DALYs [6]. Therefore, it can be assumed that chronic disease-related health indicators are continuing to deteriorate due to unhealthy eating (e.g., high-calorie intake, fried food, and sweetened beverages) and lifestyle habits (less physical activity and more sedentary lifestyles). Many of today’s chronic diseases can be largely prevented by promoting positive lifestyle habits (e.g., more regular physical activity, low-calorie food intake, and less sedentary lifestyles) and improving negative lifestyle habits (e.g., elimination of drinking and smoking, drug abuse, etc.). Therefore, a significant proportion of chronic illness and mental health can be improved [21-25].
In terms of the characteristics of socioeconomic direct and indirect costs, direct costs from 2007 to 2015 showed an increasing trend from 2007 to 2014, and then decreased slightly in 2015 in US dollars. In addition, the indirect costs from 2007 to 2015 showed a tendency to increase from 2007 to 2015. Overall, the socioeconomic direct and indirect costs of diseases are continuing to increase. This appears to be due to a surge in chronic diseases through rapid aging and unhealthy lifestyle habits (e.g., less physical activity, more sedentary lifestyles, and high-calorie intake) in Korea [13].
Direct and indirect medical costs increased during the study period for both men and women, and the rate of increase in men and women was similar for direct medical costs. However, the indirect costs for men from 2007 to 2015 were consistently approximately 4 times higher than those of women. Indirect costs include the value of lost productivity, and it is thought that the socioeconomic indirect costs due to diseases were calculated to be higher for men because men have a shorter life expectancy and average lifespan than women [10,18].
There are limitations in estimating medical costs for non-benefit cost items that are not covered by the health insurance system. Establishing sophisticated data sources for cost items is difficult due to the limitations of some data sources. Therefore, specific data on medical costs, especially non-benefit costs, are needed for future research.
The conceptual approach to the economic burden of disease can be divided into a prevalence-based approach and an incidence-based approach, depending on the study design. It is difficult to estimate costs using the incidence-based approach when the first onset of a disease is unclear. Analytical perspectives on the economic burden of disease can be divided into the insurer perspective, the healthcare system perspective, and the social perspective, depending on who bears the cost or where the cost is incurred. The items included in the economic burden of disease vary depending on which viewpoint is selected [6].
This study expanded the scope of calculating the burden of disease at the national level by calculating the burden of disease in Koreans by gender and type of disease. Through this analysis, it was confirmed that research on the national burden of disease could further subdivide the entire population and analyze the disease burden according to group characteristics. The results of this study can be used as measurements of differences in population health level by gender and disease and can be used as indicators of health equality. Therefore, the present results can serve as useful data for establishing community-centered (or customized) health promotion policies and projects and national health policy goals.
This study presented Korea’s health status in various aspects, but did not discuss the major risk factors for Korea’s disease burden. The study analysis also extended through 2015 with limitations on the latest data due to the need to have well-organized data sources. Although the data are somewhat outdated, the analysis of trends in the socioeconomic disease burden can help inform discussions of health-related policies in the future. Nonetheless, an additional analysis using up-to-date data will be needed for further discussions. In future studies, it will be necessary to identify the risk factors for disease burden (e.g., drinking, smoking, physical activity, obesity, or drug use) according to the characteristics of the population group (e.g., region or income level).With additional analysis of more recent data, it will be possible to investigate Korea’s socioeconomic burden of disease as a whole. In addition, these findings have meaningful implications for identifying the most appropriate and cost-effective risk factors to target for reducing the disease burden of the entire population by performing data-based simulations.
CONCLUSION
Socioeconomic burden of disease studies consistently apply methodologies to estimate the burden of disease in various countries, publishing results that enable the comparison of health levels across countries. However, it is difficult to estimate all the burden of disease with epidemiological indicators, and there are limitations in comparing health levels between various groups in Korea using extant research. Countries with high-quality data sources on the health status of their populations should take steps to promote and expand research on the socioeconomic burden of disease research to better understand their health status and encourage researchers to participate in research on the national burden of disease. This study is expected to provide evidence for calculating the scope of socioeconomic costs caused by diseases in Korea through the prevalence-based approach to identify the components and relative importance of each disease, prioritize future preventive management policies, and efficiently allocate health care resources.
SUPPLEMENTAL MATERIALS
Supplemental material is available at https://doi.org/10.3961/jpmph.21.594.
Top 5 ranking socioeconomic burden of disease, 2007- 2015
Notes
CONFLICT OF INTEREST
The authors have no conflicts of interest associated with the material presented in this paper.
FUNDING
This research was supported by a grant from the Korea Health Technology R&D Project through the Korea Health Industry Development Institute (KHIDI), funded by the Ministry of Health & Welfare, Republic of Korea (grant No. HI18C0446).
ACKNOWLEDGEMENTS
The funding agency had no role in the study design, analysis, and interpretation of the data or in the preparation of the manuscript.
Notes
AUTHOR CONTRIBUTIONS
Conceptualization: Park SY, Oh IH. Data curation: Kim TE, Lee RG. Formal analysis: Lee RG, Kim TE. Funding acquisition: Oh IH. Methodology: Kim TE. Project administration: Kim TE. Visualization: Kim TE. Writing – original draft: Kim TE. Writing – review & editing: Lee RG, Park SY, Oh IH.