Association Between Sleep Quality and Anxiety in Korean Adolescents
Article information

Abstract
Objectives
Anxiety disorder is among the most prevalent mental illnesses among adolescents. Early detection and proper treatment are important for preventing sequelae such as suicide and substance use disorder. Studies have suggested that sleep duration is associated with anxiety disorder in adolescents. In the present study, we investigated the association between sleep quality and anxiety in a nationally representative sample of Korean adolescents.
Methods
This cross-sectional study was conducted using data from the 2020 Korea Youth Risk Behavior Web-based Survey. The Generalized Anxiety Disorder-7 questionnaire was used to evaluate anxiety. The chi-square test was used to investigate and compare the general characteristics of the study population, and multiple logistic regression analysis was used to analyze the relationship between sleep quality and anxiety.
Results
In both sexes, anxiety was highly prevalent in participants with poor sleep quality (adjusted odds ratio [aOR], 1.56; 95% confidence interval [CI], 1.43 to 1.71 in boys; aOR, 1.30; 95% CI, 1.19 to 1.42 in girls). Regardless of sleep duration, participants with poor sleep quality showed a high aOR for anxiety.
Conclusions
This study identified a consistent relationship between sleep quality and anxiety in Korean adolescents regardless of sleep duration.
INTRODUCTION
Anxiety disorder is among the most prevalent mental illnesses among adolescents, with a lifetime prevalence of 38.0% in girls and 26.1% in boys. Additionally, 8.3% of adolescents with anxiety disorder experienced severe impairment due to it [1,2]. In Korea, Park et al. [3] showed that the prevalence of any anxiety disorder was 10.3% using the Diagnostic Interview Schedule for Children, making it the most prevalent psychiatric disorder. It is very important to prevent and manage anxiety disorder in childhood and adolescence because adolescence is a critical period in which individuals develop their capacity for social interaction, which can be negatively affected by anxiety [4]. Anxiety disorder in adolescence often persists into adulthood and can induce other psychiatric problems, such as depression, suicide, and substance abuse. Anxiety disorder is also among the top 30 leading causes of lost disability-adjusted life-years in Korea; thus, managing anxiety disorder in early life is very important for quality of life [5]. Therefore, early detection and proper treatment are important to reduce the disease burden [6–9].
The detection of anxiety disorder in childhood and adolescence is challenging because it is normal for children to experience anxiety in their daily life when they encounter a new situation or task [10]. Another hurdle for the early detection of anxiety is that it is relatively difficult to assess anxiety in children [11]. Due to children’s limited language and expression skills, the diagnosis is based on parental reports, especially in younger children, making the diagnosis a complex and time-consuming process [12–14]. Therefore, it is helpful to use simple indicators to detect adolescents with possible anxiety disorder before a further comprehensive evaluation is conducted. Sleep quality is one such indicator, and adolescents can easily report subjective sleep quality. Sleep duration has been found to predict anxiety disorder in adolescents, but the association between sleep quality and anxiety disorder remains unclear [15]. We believe that if an association between sleep quality and anxiety is found in a large adolescent sample, it will encourage the use of subjective sleep quality as an indicator of anxiety in adolescents in clinical settings.
We aimed to investigate the association between sleep quality and anxiety in a large sample of Korean adolescents after adjusting for covariates associated with sleep and anxiety. We also aimed to identify differences in the severity of anxiety according to sleep quality.
METHODS
Study Population and Data
The data analyzed in this study were obtained from the 2020 Korea Youth Risk Behavior Web-based Survey (KYRBS), conducted by the Ministry of Education, Ministry of Health and Welfare, and Korean Disease Control and Prevention Agency (KDCA; formerly the Korea Centers for Disease Control and Prevention). The purpose of this survey, which is conducted on middle school and high school students, is to evaluate the health status and health-related behavior of Korean adolescents and provide basic data for the formulation of health policies. To ensure representativeness of the survey for Korean adolescents, the KDCA stratified all middle/high schools in Korea by region and type, and selected sample schools using the collocated random number method [16,17]. The anonymous survey is conducted annually at approximately 400 high schools and 400 middle schools. The survey items change slightly every year, and weighted values are used for combined analyses of data from several years.
Measures
Generalized Anxiety Disorder-7
The Generalized Anxiety Disorder-7 (GAD-7) is a self-report questionnaire used to screen for anxiety disorder. It includes 7 items that reflect the Diagnostic and Statistical Manual of Mental Disorders, fourth edition criteria for generalized anxiety disorder [18]. The GAD-7 has been established as a reliable and valid tool for screening generalized anxiety disorder and other anxiety disorders [19,20]. Each item is rated between 0 and 3, with a maximum total score of 21. The total score is used to grade anxiety into 4 levels: minimal (0–4), mild (5–9), moderate (10–14), and severe (15–21) [18]. The Korean version of the GAD-7 was translated and verified by Seo and Park [21]. The Cronbach α of the Korean version is 0.915, and the sensitivity, specificity, positive predictive value, and negative predictive value of the GAD-7 with a cut-off score of 5 are 78.1%, 74.6%, 46.3%, and 92.4%, respectively. Therefore, we defined participants as having anxiety if their GAD-7 score was ≥5.
Sleep-related variables
To evaluate participants’ sleep quality, they were asked whether their sleep during the previous 7 days was sufficient for recovering from fatigue. They selected the most suitable answer among 5 choices: 1, completely sufficient; 2, sufficient; 3, neutral; 4, insufficient; 5, completely insufficient. Participants with completely sufficient and sufficient sleep were categorized into the good sleep quality group, and the remaining participants were categorized into the poor sleep quality group. Participants were also asked about when they went to bed and woke up, and we calculated the sleep duration from this information.
Covariates
The socio-demographic covariates studied included age, socioeconomic status, academic grades, and family structure. Socioeconomic status was categorized as high, middle, or low. Based on their family structure, we classified participants as living with 2 parents, 1 parent, or 0 parents. The health-related covariates studied included smoking status, alcohol use, perceived stress level, and self-reported health status. We also included smartphone over-dependence, which might be associated with both sleep quality and anxiety. The KYRBS provides the results from the Adolescents’ Smartphone Over-dependence Scale, which was developed by the National Information Society Agency in Korea. The scale consists of 10 questions with 4 points; a score of over 23 points out of 40 points indicates that a respondent is at risk for smartphone over-dependence [22,23].
Statistical Analysis
The Rao-Scott chi-square test was used to analyze and compare the variables. To examine the relationship between sleep quality and anxiety, we conducted survey logistic regression analysis using strata, weights, and clusters after adjusting for covariates. Subgroup analyses were performed to investigate the combined associations of sleep quality and other covariates with anxiety. Subjects with anxiety were divided into 3 groups according to the severity of anxiety, and the significance of the relationship between sleep quality and anxiety was analyzed in each of these groups. The results are presented as adjusted odds ratio (aOR) and 95% confidence intervals (CIs) to compare the prevalence of anxiety. The analyses were performed using the stratified sampling variables (strata) and weighted variables suggested by the KYRBS. We performed the analysis after dividing subjects by sex due to differences between the sexes in anxiety and sleep quality [24]. All analyses were carried out using SAS version 9.4 (SAS Institute Inc., Cary, NC, USA), and p-values <0.05 were considered to indicate statistical significance.
Ethics Statement
The KYRBS received the KDCA approval (2014-06EXP-02-P-A) in 2014. From 2015, the ethics approval for the KYRBS was waived by the KDCA Institutional Review Board under the Bioethics & Safety Act and opened to the public for academic use.
RESULTS
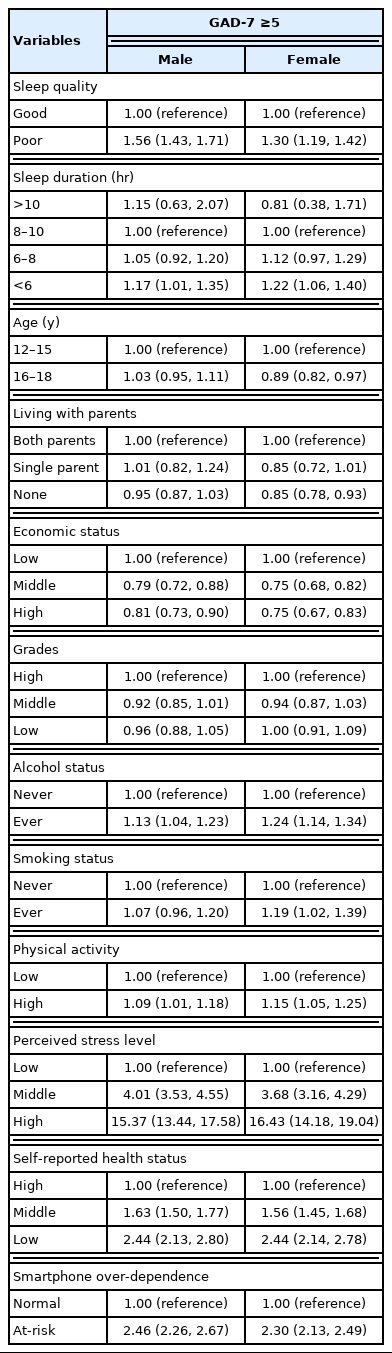
The general characteristics of the study population stratified by sex are presented in Table 1. This study included 46 387 participants (24 104 boys and 22 283 girls). Among them, 26.1% of boys and 39.7% of girls had a GAD-7 score ≥5. There was a higher prevalence of anxiety in both boys and girls with poor sleep quality than in those with good sleep quality. Participants who slept for less than 6 hours had the highest prevalence of anxiety among all the groups defined according to sleep duration. The prevalence of anxiety was also higher in participants with low economic status and high perceived stress levels.

Socioeconomic and health-related characteristics of all participants according to their Generalized Anxiety Disorder-7 (GAD-7) score
Table 2 shows the results of the multiple logistic regression analysis of the association between sleep quality and anxiety. After adjusting for covariates, both boys and girls with poor sleep quality had a higher prevalence of anxiety than their counterparts (adjusted odds ratio [aOR], 1.56; 95% CI, 1.43 to 1.71 in boys; aOR, 1.30; 95% CI, 1.19 to 1.42 in girls). Furthermore, after adjusting for covariates, participants who slept for less than 6 hours had higher odds of having anxiety than participants who slept for 8–10 hours (aOR, 1.17; 95% CI, 1.01 to 1.35 in boys; aOR, 1.22; 95% CI, 1.06 to 1.40 in girls). The at-risk group for smartphone over-dependence also showed elevated ORs compared to the normal group (aOR, 2.46; 95% CI, 2.26 to 2.67 in boys; aOR, 2.30; 95% CI, 2.13 to 2.49 in girls).
Results of the multiple logistic regression analysis of the association between sleep quality and anxiety
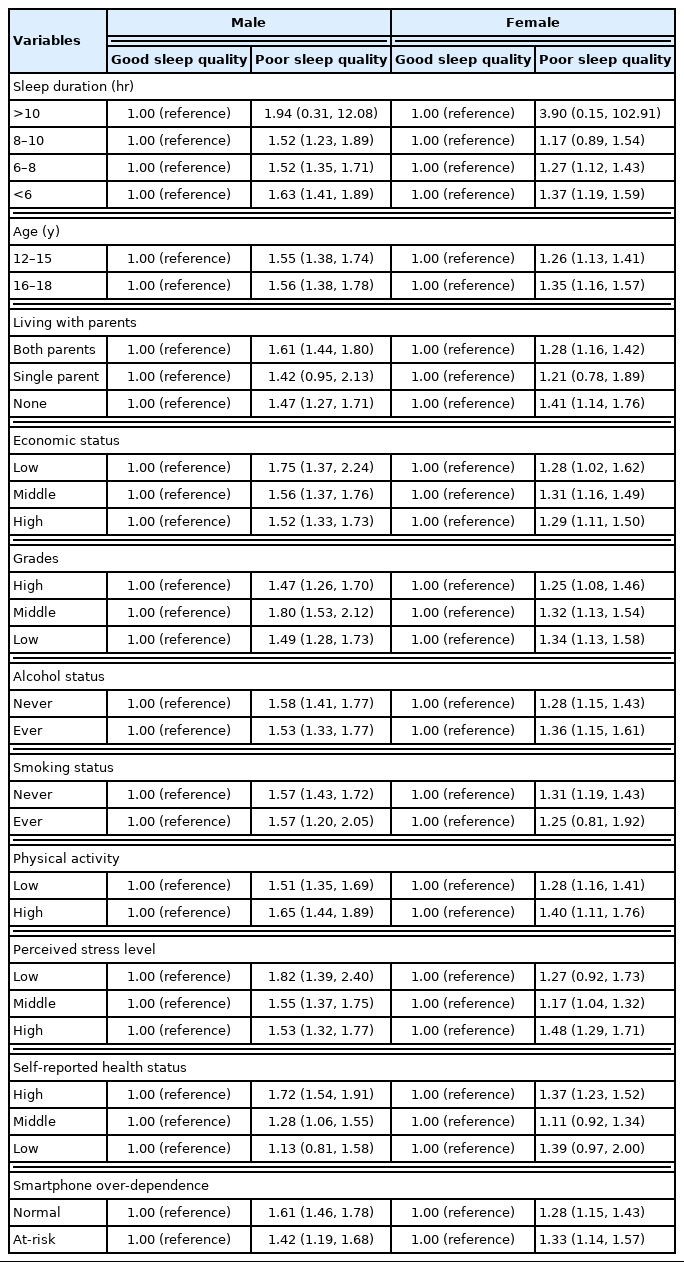
The results of the subgroup analysis are shown in Table 3. After categorizing participants according to sleep duration, the group with poor sleep quality had higher odds of having anxiety than those with good sleep quality, although this result was not statistically significant in the group of participants who slept for more than 10 hours. Multiple logistic regression analysis of subgroups stratified by anxiety severity revealed a higher prevalence of anxiety in participants with poor sleep quality in all subgroups (Table 4). This association was stronger in participants with moderate/severe anxiety than in those with mild anxiety. Figure 1 shows the results of multiple logistic regression analysis conducted using raw scores based on the answer to the question on sleep quality. The ORs generally increased as sleep quality decreased.
Subgroup analysis of the association between sleep quality and anxiety stratified by socio-demographic variables
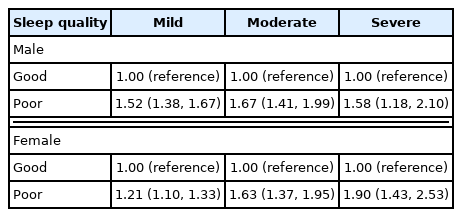
Results of the multiple logistic regression analysis of the associations between sleep quality and mild, moderate, and severe anxiety

Results of the multiple logistic regression analysis of the association between anxiety and sleep quality. The group with very good sleep quality serves as the reference. aOR, adjusted odds ratio; GAD-7, Generalized Anxiety Disorder-7.
DISCUSSION
In this study, we found that anxiety was associated with sleep quality in Korean adolescents. This association was maintained even after adjusting for covariates and subgrouping according to socio-demographic variables, sleep duration, and sex.
Our results are consistent with those of previous studies that found associations between sleep problems and anxiety in adolescents. A short sleep duration has been found to be associated with anxiety [15,25]. A longitudinal study suggested that sleep problems predicted and were predicted by generalized anxiety/depression and oppositional defiant disorder; however, that study also found that sleep disorders predicted, but were not predicted by, anxiety disorder (odds ratio, 3.3) [26]. Another study investigated the directionality of the association between sleep problems and anxiety and found that sleep problems were significantly associated with anxiety and predicted future anxiety, but the reverse association was not established [27]. Other longitudinal studies have also suggested that sleep problems might be a risk factor or predictor for anxiety disorder [28,29].
In previous studies, anxiety disorders showed sex differences in adolescents, with girls having a higher prevalence and cumulative hazard for anxiety disorders [30,31]. In our study, female participants showed a higher percentage of GAD-7 scores ≥5, but male adolescents showed a higher OR for GAD-7 scores ≥5 in the poor sleep quality group than female participants. These results might imply that sleep quality is more strongly associated with anxiety in male adolescents than in female adolescents. Smartphone over-dependence also showed an association with anxiety, as shown by the results in Table 2. Nevertheless, in a subgroup analysis, both the normal group and at-risk group showed an association between sleep quality and anxiety. These results might suggest that sleep quality is an important factor associated with anxiety regardless of smartphone dependence; this possibility warrants further investigation.
Unlike previous studies, we focused not only on sleep duration, but also on the subjective feeling of satisfaction with the effectiveness of sleep for relieving fatigue. Poor sleep quality was consistently associated with anxiety in all sleep duration subgroups. This might indicate that regardless of sleep duration, subjective sleep quality has an important association with anxiety disorder. We also assessed sleep quality using a simple and easily understandable question, which can be used for screening anxiety disorder in children or adolescents.
The mechanism underlying the association of sleep disturbance with anxiety disorder remains unclear, but several hypotheses have suggested biological, psychological, and social mechanisms [32]. The biological mechanism hypothesis suggests that sleep problems not only precede anxiety disorder, but can also be a risk factor for anxiety disorder [32–35]. In previous studies, sleep disorders were associated with a higher prevalence of physical problems, and they can therefore induce a poor general condition and anxiety symptoms [36]. Considering these relationships, appropriate treatment of sleep disturbances is needed to improve or prevent anxiety disorder in adolescents.
This study has several limitations. First, cross-sectional data were used, and we could not confirm a causal relationship between sleep quality and anxiety in adolescents. Second, as the data were collected through a self-reported web-based survey, the possibility of recall bias or the participants having misunderstood questions cannot be eliminated. In particular, answers about socioeconomic status might have lacked accuracy because of the participants’ lack of understanding of their parents’ economic condition. However, our results are based on subjectively reported economic status, which has been found to more accurately reflect feelings of anxiety than objectively reported data. Third, as the survey targeted youths, the questionnaire was deliberately kept simple and did not include a scale for assessing objective sleep quality.
Despite these limitations, our study possesses certain strengths. Although the KYRBS has the limitation of cross-sectional data, it contains nationally representative data, making the findings generalizable to the entire adolescent population of Korea. Additionally, a relatively simple question was used to assess sleep quality, and we found that sleep quality assessed using this question was significantly associated with anxiety. Therefore, this question can be readily and easily used to evaluate adolescents in other situations.
In conclusion, we identified a relationship between sleep quality and anxiety in Korean adolescents. This association was consistent regardless of sleep duration. Further research with a prospective design and the use of objective measures to assess sleep quality should be conducted to validate these findings.
ACKNOWLEDGEMENTS
None.
Notes
CONFLICT OF INTEREST
The authors have no conflicts of interest associated with the material presented in this paper.
FUNDING
None.
AUTHOR CONTRIBUTIONS
Conceptualization: Kim H, Jang SI. Data curation: Kim H. Formal analysis: Kim H, Kim SH. Funding acquisition: None. Methodology: Kim H. Project administration: Park EC. Visualization: Kim H, Kim SH. Writing – original draft: Kim H. Writing – review & editing: Kim H, Kim SH, Jang SI, Park EC.