
Articles
- Page Path
- HOME > J Prev Med Public Health > Volume 44(3); 2011 > Article
-
Original Article
Changes in the Distribution of Maternal Age and Parity and Increasing Trends in the Low Birth Weight Rate in Korea Between 1995 and 2005 - Jisuk Bae1, Jung Han Park1, Yoo Keun Park2, Jong-Yeon Kim1, Sang-Won Lee3, Soon-Woo Park1
-
Journal of Preventive Medicine and Public Health 2011;44(3):111-117.
DOI: https://doi.org/10.3961/jpmph.2011.44.3.111
Published online: May 17, 2010
1Department of Preventive Medicine, Catholic University of Daegu School of Medicine, Daegu, Korea.
2Wonchodang Oriental Medical Clinic, Seoul, Korea.
3Department of Preventive Medicine, CHA University, Gumi, Korea.
- Corresponding author: Jung Han Park, MD, MPH, DrPH. 3056-6 Daemyung-4dong, Nam-gu, Daegu, 705-718, Korea. Tel: +82-53-650-4495, Fax: +82-53-654-3881, jhpark@cu.ac.kr
• Received: July 12, 2010 • Accepted: December 20, 2010
Copyright © 2011 The Korean Society for Preventive Medicine
This is an Open Access article distributed under the terms of the Creative Commons Attribution Non-Commercial License (http://creativecommons.org/licenses/by-nc/3.0/) which permits unrestricted non-commercial use, distribution, and reproduction in any medium, provided the original work is properly cited.
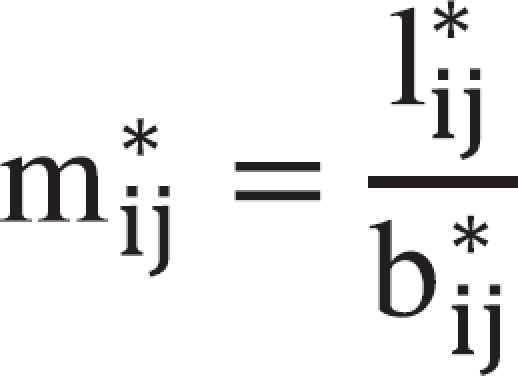
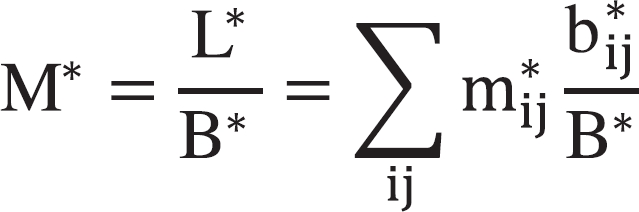
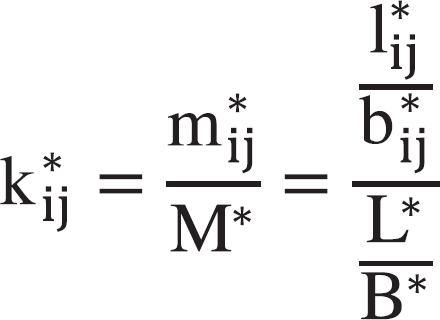
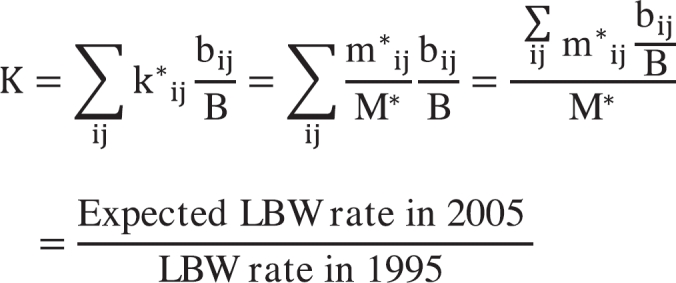
 is the proportion of births in 2005 in the ij-th cells. K is named the age-parity score, which can be directly interpreted as the percentage difference in the LBW rate with reference to the standard population.
Figure & Data
References
Citations
Citations to this article as recorded by 
- Incidence, Long-Term Visual Outcomes, and Mortality in Retinopathy of Prematurity in Korea: A Nationwide Population-Based Study
Kun-Hoo Na, Kyoung Hoon Kim, Tae Uk Kang, Hoo Jae Hann, Hyeong Sik Ahn, Hyun Jung Kim
Investigative Opthalmology & Visual Science.2020; 61(10): 14. CrossRef - Factors associated with low birth weight at term: a population-based linkage study of the 100 million Brazilian cohort
Ila R. Falcão, Rita de Cássia Ribeiro-Silva, Marcia F. de Almeida, Rosemeire L. Fiaccone, Aline dos S. Rocha, Naiá Ortelan, Natanael J. Silva, Enny S. Paixao, Maria Yury Ichihara, Laura C. Rodrigues, Mauricio L. Barreto
BMC Pregnancy and Childbirth.2020;[Epub] CrossRef - Modeling the Effect of Mother's Characteristics on the Weight of a Newborn
Oluwafemi Samson Balogun, Donald Douglas Atsa'am, Toluwalase Janet Akingbade, Emmanuel Awuni Kolog, Richard O. Agjei, Samuel Nii Odoi Devine
International Journal of Childbirth.2020; 10(4): 206. CrossRef - Impact of Changes in Maternal Age and Parity Distribution on the Increasing Trends in the Low Birth Weight and Very Low Birth Weight Rates in South Korea, 2005-2015
Yujin Oh, Jisuk Bae
Journal of Preventive Medicine and Public Health.2019; 52(2): 123. CrossRef - Factors Associated With Failure to Thrive Among Children Aged 3 to 72 Months in Jahrom, Southern Iran
Vahid Rahmanian, Yaser Sarikhani, Keramatollah Rahmanian, Elham Mansoorian, Mahdieh Zare
Shiraz E-Medical Journal.2018;[Epub] CrossRef - Adverse Child’s Birth Outcomes and Maternal Age at Birth: 1997-98, 2014-15 Birth Certificate Data of Korea
Sang Hwa Park, Jong Seok Kim, Dar Oh Lim
Journal of Health Informatics and Statistics.2017; 42(3): 294. CrossRef - Experiences of Prenatal Genetic Screening and Diagnostic Testing Among Pregnant Korean Women of Advanced Maternal Age
Myunghee Jun, Vipavee Thongpriwan, Kyung Sook Choi
Journal of Transcultural Nursing.2017; 28(6): 550. CrossRef - Reproductive Health of Women in Rural Areas of East Azerbaijan – Iran, before and after Implementation of rural Family Physician Program: an Ecologic Study
Mahasti Alizadeh, Hossein Jabbari Birami, Siavash Moradi
Journal of Caring Sciences.2015; 4(4): 321. CrossRef - Risk Assessment of Adverse Birth Outcomes in Relation to Maternal Age
Yi-Hao Weng, Chun-Yuh Yang, Ya-Wen Chiu, Lynette K. Rogers
PLoS ONE.2014; 9(12): e114843. CrossRef - The association between maternal nonylphenol exposure and parity on neonatal birth weight: A cohort study in Taiwan
Chia-Huang Chang, Mei-Lien Chen, Kai-Wei Liao, Yen-An Tsai, I-Fang Mao, Tzu-Hao Wang, Shiaw-Min Hwang, Yu-Jen Chang, Ming-Song Tsai
Chemosphere.2013; 93(6): 1145. CrossRef
 PubReader
 ePub Link
 Cite
Cite
