Serum 2,3,7,8-Tetrachlorodibenzo-p-dioxin Levels and Their Association With Age, Body Mass Index, Smoking, Military Record-based Variables, and Estimated Exposure to Agent Orange in Korean Vietnam Veterans
Article information
Abstract
Objectives
The aim of this study was to examine the levels of serum 2,3,7,8-tetrachlorodibenzo-p-dioxin (TCDD) and evaluate their association with age, body mass index, smoking, military record-based variables, and estimated exposure to Agent Orange in Korean Vietnam veterans.
Methods
Serum levels of TCDD were analyzed in 102 Vietnam veterans. Information on age, body mass index, and smoking status were obtained from a self-reported questionnaire. The perceived exposure was assessed by a 6-item questionnaire. Two proximity-based exposures were constructed by division/brigade level and battalion/company level unit information using the Stellman exposure opportunity index model.
Results
The mean and median of serum TCDD levels was 1.2 parts per trillion (ppt) and 0.9 ppt, respectively. Only 2 Vietnam veterans had elevated levels of TCDD (>10 ppt). The levels of TCDD did not tend to increase with the likelihood of exposure to Agent Orange, as estimated from either proximity-based exposure or perceived self-reported exposure. The serum TCDD levels were not significantly different according to military unit, year of first deployment, duration of deployment, military rank, age, body mass index, and smoking status.
Conclusions
The average serum TCDD levels in the Korean Vietnam veterans were lower than those reported for other occupationally or environmentally exposed groups and US Vietnam veterans, and their use as an objective marker of Agent Orange exposure may have some limitations. The unit of deployment, duration of deployment, year of first deployment, military rank, perceived self-reported exposure, and proximity-based exposure to Agent Orange were not associated with TCDD levels in Korean Vietnam veterans. Age, body mass index and smoking also were not associated with TCDD levels.
INTRODUCTION
In the Vietnam War, from 1961 to 1971, the US military sprayed about 76 million liters of tactical herbicides (hereafter, "Agent Orange"). During the manufacturing process of 2,4,5-trichlorophenoxyacetic acid, a major ingredient of Agent Orange, 2,3,7,8-tetrachlorodibenzo-p-dioxin (TCDD) was included as an impurity [1]. About 320 000 Korean Vietnam veterans were estimated to be exposed to the Agent Orange that included TCDD [2]. Since the 1980s, research has been performed on the TCDD concentrations in human samples of US veterans [3,4]. In the meantime, the research on TCDD concentrations among Korean veterans has not been substantial [5], and no research that deals with individual serum TCDD concentrations has yet been presented on the scientific journal. It has been reported that the serum TCDD concentration of Korean veterans was lower than that of an occupational cohort or US veterans [3,5-8]. Past studies have used pooled samples, not individual samples, and thus had some limitations, including that about 40% of the analyzed TCDD concentration was below the detection limit [5].
Although there has been substantial interest in the health effects of veterans' exposure to Agent Orange, it is a challenging task to develop a new exposure index that is valid and reliable [1]. Individuals with high exposure to TCDD still have high TCDD concentrations even years after the exposure [4,6]. Past studies on veterans and occupational cohorts who were exposed to a high level of TCDD-contaminated chemicals have reported a relationship between the TCDD concentration in human tissue samples and TCDD exposure-related records [6,8]. An occupational cohort study reported a relationship between the duration of exposure to processes involving TCDD contamination and TCDD concentrations in the human body [6]. A study on US veterans presented the impacts of military positions and ranks of the veterans on serum TCDD concentrations [8]. Thus, the researchers investigated whether TCDD concentrations among veterans' specimens could be a reliable tool for measuring the exposure to Agent Orange and whether they could have associations with the newly developed exposure index of Agent Orange in US veterans [3]. Korean researchers investigated the correlation between categorized exposure to Agent Orange and serum TCDD concentration as a reference [5]. They, however, did not examine the links between TCDD levels and veterans' military records including military ranks. Meanwhile, the TCDD concentration in the human tissue was reported to have relationships with age [9-11], gender [11-13], body mass index (BMI) [10,11], and smoking [14,15]. There have been limited reports about the influences of these variables on TCDD concentration among Koreans [16].
Thus, this study first analyzed TCDD concentrations among Korean Vietnam veterans and investigated whether TCDD concentrations can be used as an objective tool to measure exposure to Agent Orange. In addition, we investigated how the serum TCDD concentration is related to the Agent Orange exposure index that was developed from self-reported health information and military variables. This would help us validate a newly developed exposure index [3,5] and evaluate whether serum TCDD concentrations could be utilized as an effective tool to measure the exposure of Korean Vietnam veterans to Agent Orange. Third, we investigated how serum TCDD concentrations were associated with age, BMI, and smoking.
METHODS
Study Subjects and TCDD Measurement
Ohrr et al. [17] conducted health examinations and a survey among 2012 Korean Vietnam veterans at 11 participating hospitals in 2001. At two hospitals, researchers took blood samples in blood bags without anticoagulant from a convenience sample of 105 Vietnam veterans who provided written consent and kept the serum frozen at -72℃ [2]. In 2007, the serum TCDD was analyzed by the research team of the School of Environmental Science and Engineering at Pohang University of Science and Technology in Korea. The serum was analyzed for 102 of the veterans, that is, all but 3 veterans from whom specimens were lacking.
The measurement of dioxin was implemented by high resolution gas chromatography / high resolution mass spectrometry. About 50 mL of serum was analyzed and the limit of detection (LOD) was 1 parts per quadrillion per gram serum or about 0.3 to 0.4 parts per trillion (ppt) per gram lipid. The two samples with less than the LOD were considered to have concentrations as the half of LOD. More details about dioxin measurements, equipment, and quality control can be found in other documents from the same analytic team [18].
Measures of Potential TCDD-related Factors
During the health examination in 2001, researchers collected the subjects' smoking, weight, and height information from a self-reported survey [17]. Their BMI was calculated as a subject's weight in kilograms divided by the square of the subject's height in meters. Smoking status (current smoker, past smoker, and never smoker) and pack-years, which was calculated using the amount of smoking (number of cigarettes) and duration of smoking, were obtained. The pack-year analysis was only available for current smokers since only a limited amount of smoking information was collected for past smokers.
Information on the veterans' unit at the division / brigade level, duration of deployment, and military ranks were obtained from the Ministry of Defense [2]. The duration of deployment was calculated by day and then divided into tertiles. Information about the veterans' unit at the battalion / company level was collected from a postal survey in 2004 [2].
Agent Orange Exposure Index
Perceived exposure index to Agent Orange
The perceived exposure index to Agent Orange, composed of six items, was adopted from previous research [19]. Respondents were grouped into one of 4 categories- no, low, moderate, and high exposure-according to their answers to the six questions [19]. A respondent who had sprayed Agent Orange (question 1) or handled spray equipment (question 2) was put in the "high" category. A respondent who was present during the spraying (question 3) or had the Agent Orange on their skin or clothing (question 4) was assigned to the "moderate" category. A veteran who had walked through a defoliated area (question 5) or had been exposed in ways not described in questions 1 to 4 (question 6) was placed in the "low" group. Those responding "no" to all of the above 6 questions were treated as a "no" exposure group. Then, the "no" category and "low" category were combined and designated the "low" group while the "moderate" category and "high" category were collapsed into the "high" group, thus resulting in 2 groups in the end.
Proximity-based exposure index to Agent Orange
This exposure opportunity model was based on the proximity of the military unit to the sprayed area. The exposure opportunity index model E4, developed by Stellman et al. [20], was applied. Researchers identified the Korean military unit's post location (for the battalion level and higher), tactical area of responsibility, and operational area. The records obtained from the Ministry of Defense contained information of deployed unit in Vietnam veterans on 3 combat units (the Capital division, Ninth division, and the Marine second brigade, as far as the division / brigade level only) and 4 support units. The self-reported survey revealed information on the battalion level and company level (for artillery and some units). This study constructed the division / brigade level exposure index from military records and the battalion / company level exposure index from the self-reported survey.
The E4 scores were calculated for geographic locations and calendar dates [20], and those results were combined with the location histories of the military units to calculate unit level E4 scores [21]. Veterans with the same military unit and service period would have the same exposure score. After adding 1 to each E4 score, the common log-transformed E4 score (Le4) was used as the individual's Agent Orange exposure index. The division / brigade level exposure index had 102 veterans and the battalion and company level exposure index had 75 veterans who participated in the 2004 survey. The veterans were categorized into 2 groups (low [Le4<4.0] and high exposure [Le4≥4]) and 4 groups (no [Le4<0.1], low [0.1≤Le4<4.0], moderate [4.0≤Le4<5.0], and high exposure [Le4≥5.0]). The details about the exposure index and group classification can be found elsewhere [2].
Statistical Analysis
As the TCDD concentration is frequently considered to follow a log-normal distribution [13], the common log-transformed TCDD (Log10TCDD) was used as a basis for analysis. The TCDD concentration was analyzed in the forms of the geometric mean, geometric standard deviation, arithmetic mean, minimum value, 25th percentile, median, 75th percentile, and maximum value.
The Log10TCDD concentration and non-transformed TCDD concentration did not follow a normal distribution (Shapiro-Wilk test p<0.001, p<0.001, respectively). An ANOVA test was used to demonstrate differences in the TCDD levels between the health variables (including age, smoking, BMI, and obesity) and the military variables (including deployed unit, first year of deployment, duration of deployment, military ranks, and exposure index) that were potentially related to the TCDD levels. A multiple regression analysis was done to demonstrate the impacts of these variables on the TCDD concentrations while controlling other variables. A correlation analysis was implemented to investigate the relationships between TCDD-related variables and TCDD concentrations. The p-value was calculated with two-sided tests and a statistical significance level of 0.05 was applied. All statistical analysis was performed using SAS version 9.2 (SAS Inc., Cary, NC, USA).
RESULTS
The average age and BMI of veterans in 2001 were 56.5±3.7 and 24.2±2.8, respectively. 41 veterans (40.2%) were current smokers and 78 veterans (76.5%) were part of combat units. 38 veterans (37.3%) had been deployed more recently than 1970 while 66 veterans (64.7%) had an enlisted rank (Table 1). The average duration of deployment in Vietnam was 394.8±117 days and the median duration was 382.5 days. For the division / brigade level exposure index, the high exposure group (of 2 groups) had 51 veterans (50.0%). For the battalion / company level exposure index, the high exposure group (of 2 groups) had 28 veterans (37.3%). For the perceived self-reported exposure index, the high exposure group (of 2 groups) had 46 veterans (45.1%) (Table 1).
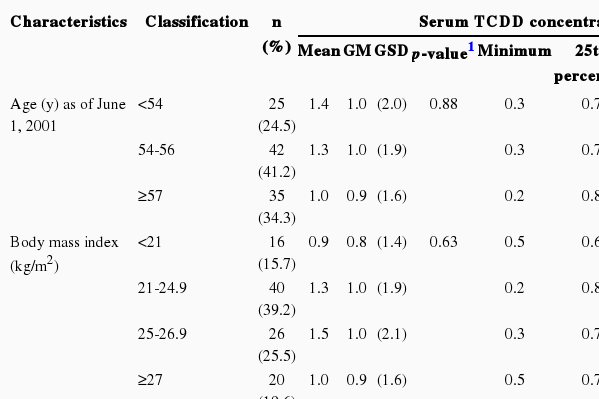
Number of cases and serum TCDD concentrations by characteristics in subjects (n=102)
The range of serum TCDD concentrations of entire sample of veterans was 0.2 to 11.4 ppt. In ANOVA analysis, when the TCDD concentrations were compared by veteran characteristics, there were not significant differences in TCDD concentrations among the groups from the perspectives of selected variables that included age, BMI, military variables, and the exposure index of the Agent Orange (Table 1).
Although correlation analysis found that the exposure index of the battalion / company level had a relatively high correlation coefficient, there were not statistically significant relationships between TCDD concentrations and the variables of age, BMI, and the proximity-based exposure index as continuous variables (Table 2).
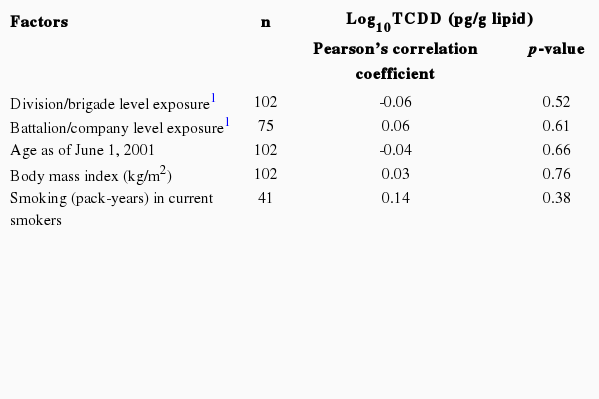
Correlation of exposure-related factors with serum TCDD levels
No multiple regression model was significant in explaining the serum TCDD concentrations. In the 4 group analysis of the exposure index of Agent Orange, when controlling for age, BMI, smoking, and military variables, the low exposure group of the battalion / company level exposure, compared to the no exposure group, had significantly high TCDD concentrations and the high perceived exposure group had significantly high TCDD concentrations compared to the no perceived exposure group. In the multiple regression analysis, the results by age, smoking, and other potentially related variables are presented from a model that included the battalion / company level exposure index due to the highest R-squared value (Table 3). Similar to the results of ANOVA, there were not statistically significant differences between TCDD concentrations and age, smoking, BMI, and other variables.
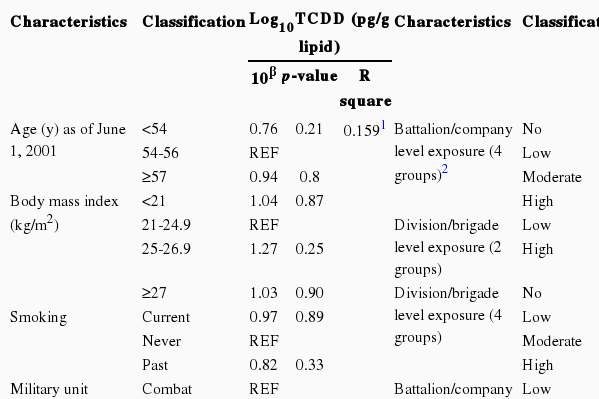
Multiple regression analysis for TCDD levels by characteristics in subjects (n=102)
In the distribution of TCDD concentrations, the largest number of veterans (n=25) were with the range of 0.8-0.9 ppt, and the concentrations overall had a right skewed distribution (Figure 1). There were 2 veterans who had concentrations higher than 10 ppt and 2 veterans below the LOD.
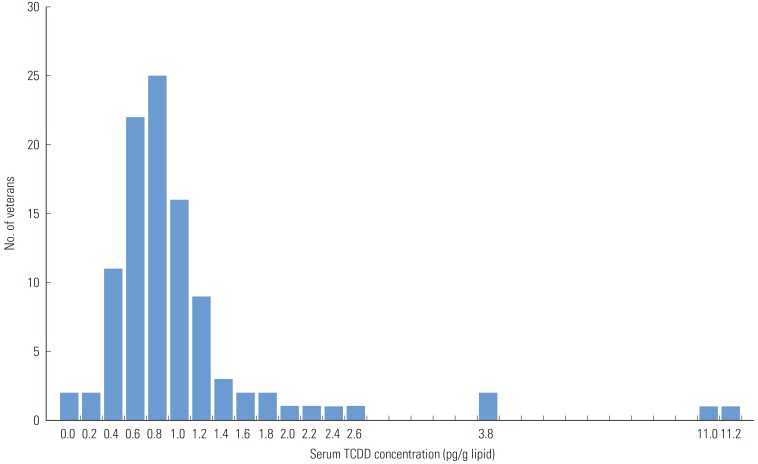
Distribution of serum 2,3,7,8-tetrachlorodibenzo-p-dioxin (TCDD) concentrations in Korean Vietnam veterans as of June, 2001 (n=102). Two cases below the detection limit assigned to be 0.
The study found the mean value of the veterans' TCDD concentration was 1.2 ppt and median value was 0.9 ppt. Specifically, these values were higher than what Kim et al. reported in 2003 (mean 0.7 ppt) [5] but lower than Zone A residents of Seveso (median 447 ppt), workers at a TCDD-contaminated plant in the US (mean 233 ppt) [7], Ranch Hand veterans (median 12.4 ppt) [8], sprayers in US Army Chemical Corps (mean 4.3 ppt) [22], and Vietnam veterans from a Centers for Disease Control (CDC) study (mean 4.2 ppt) [3] (Table 4).

Serum TCDD levels in selected populations
DISCUSSION
This study analyzed the serum TCDD concentrations among Vietnam veterans and investigated the relationships between TCDD concentrations and the Agent Orange exposure indices, and other potentially related variables. The serum TCDD concentrations among Korean Vietnam veterans were lower than those reported in other studies, and the serum TCDD concentrations did not have relationships with the military record-based variables, Agent Orange exposure indices, age, BMI, or smoking.
The study's serum TCDD concentration among Korean veterans was higher than that of other reports on Korean Vietnam veterans [5] and lower than that of US Vietnam veterans. Specifically, this study found that the serum TCDD concentration among Korean veterans was lower than that of the Seveso residents in Italy, workers of the TCDD-contaminated factory, and veterans of US Ranch Hand and the US Army Chemical Unit, who directly sprayed Agent Orange [8,22]. This suggests that Korean veterans were not as highly exposed to Agent Orange or TCDD as the US Ranch Hand veterans and Seveso residents.
The Korean veterans had lower TCDD concentrations than their US counterparts who did not spray Agent Orange [3]. There may be some explanations. While the CDC study in the US collected the blood samples during 1986 and 1987, the current project accumulated them in 2001. There is a gap of about 14 to 15 years between the blood collection periods, which allows for the span of two half-lives of TCDD in the human body [1]. If the concentration in the US veterans was 4 ppt in 1986 and the concentration was about the same as that of Korean veterans, then after two half-lives it would be 1 ppt. Second, the average American's background exposure level might be higher than that of Koreans. It is presumed that the US population's exposure to TCDD was highest in the late 1960s and early 1970s [9,10,23]. Ever since, the average American's TCDD concentration is considered to have been decreasing [4,6,23,24]. The TCDD concentration level among US veterans who were not part of the Agent Orange spraying units was not higher than that of the general US population [3,22,23]. In the 1960s in Korea, since it cost less to cut grass by hand than use herbicides [25], spraying herbicides such as 2,4,5-T [26], was not popular. The TCDD concentrations among Korean residents near municipal waste incinerators and workers were less than 0.3 ppt on average [16,18,27,28]. A study on the Shihwa industrial area in Korea reported that the serum TCDD concentration for workers was 2.0 ppt on average, while the nearby residents had an average concentration of 0.1 ppt [29]. Another study found that the concentration level of a pooled sample of non-Vietnam veteran controls in Korea was below the LOD [5]. In other words, the concentration of the US veterans was higher than that of the Korean veterans due to the fact that background TCDD level of the US population was likely to be higher than that of the Koreans, not because US military had more exposure to Agent Orange than its Korean counterparts. At the same time, we cannot rule out that Korean veterans may have had less exposure to Agent Orange than US veterans. For instance, the Ranch Hand study found that enlisted soldiers had higher TCDD concentrations than officers [8]. The present study had 35% officers and noncommissioned officers, while the US study investigated only the enlisted. Furthermore, US research only incorporated military units where there had been extensive spraying of Agent Orange [3], thus focusing on those likely to have had the greatest exposure.
The study results imply that the serum TCDD level of Korean veterans might not be an objective index to use in investigating exposure to Agent Orange; only 2 veterans (2.0%) had higher than 10 ppt. One answered that he had never been exposed to Agent Orange. The concentration in the Korean veterans was not higher than that in the general US population [13,23]. Although there is a possibility that the level of the Korean veterans is higher than that of the general Korean population [5,18,27-29], we have to consider that the LOD for TCDD is more precise in this study. Above all, compared to the past literature, the TCDD concentration of the 1 ppt for each veteran is hard to be interpreted as a high level of exposure [30]. Further, we have to consider the lapse of time since the war, the half-life differences among people [31,32], and the environmental exposure to incinerators, food, etc. Unless we focus on the high exposure groups, such as US Ranch Hand veterans, in which a larger concentration of TCDD still remains, the current TCDD levels of veterans such as the Koreans in this study could be an indicator of recent TCDD exposure rather than Vietnam War exposure, given that the war occurred several decades ago.
In multiple regression analysis, no model, including duration of deployment, unit of deployment, military ranks, perceived exposure index, or proximity-based exposure index, could significantly explain the TCDD levels among Korean Vietnam veterans. The National Institute for Occupational Safety and Health (NIOSH) cohort study [6], Seveso population [33], and Ranch Hand veterans [8] showed meaningful differences in TCDD concentration levels according to their work duration at the contaminated factory, residential area, military ranking, and duties performed. In the meantime, a study on US veterans excluding the spraying units reported that neither military records nor self-reported information had significant relationships with serum TCDD concentrations [3]. This study's results suggest that it is a difficult undertaking to find individuals among non-spraying Korean veterans who were very highly exposed to Agent Orange-as in the case with Ranch Hand veterans, the NIOSH cohort, and Seveso residents-by using an Agent Orange exposure index based on self-reported information and military records.
Past TCDD-related investigations in the US have reported strong relationships between high TCDD concentrations and old age and high BMI [9-13]. On the other hand, the current research in Korea found that age, BMI, and smoking did not make a difference in the concentration level. Studies in other countries found that the relationship between age and TCDD concentration was not linear [34] and younger age was related to higher TCDD concentration [35]. When focusing on Koreans in their 50s and above, the association between age and TCDD concentrations was not clear-cut [16,28,36]. Similarly, the research on those in the US, when the subjects were restricted to males in their 50s in the general population, did not show a clear association between age and TCDD [11,13]. In the current study, the age range of the Korean veterans was narrow since most of them were in their 50s, so age may not have impacted the concentration level. Other studies of Koreans found BMI did not have an influence on TCDD concentrations [16,36]. While US studies included participants with a BMI higher than 40 [10], in our study, the highest BMI was below 30. There is still room for debate concerning TCDD concentrations among smokers. While some studies have reported that smokers had higher TCDD concentrations [14,15], others found that smokers had lower TCDD concentrations [11,37]. Additional research is needed to gather conclusive evidence on whether the TCDD concentration among Koreans has strong associations with age, BMI, or smoking status.
One of the limitations of this study was the utilization of a convenience sampling method when we recruited the veterans for blood samples. There were no differences in self-reported health status in general (p=0.18), self-reported health status compared to the same age group (p=0.24), veterans' age (p=0.55), and BMI (p=0.47) among the 105 veterans who agreed to the blood and other veterans. When we contacted possible recruits for the study, the proximity-based exposure index was not being developed and the perceived exposure index was completed after the medical examination. Even though the researchers adopted a convenience sampling method, the veterans who gave blood samples were selected neither by the exposure index nor health status. We, unfortunately, could not obtain blood samples from a non-Vietnam veteran control group. We should note, however, that the same analytic team has examined TCDD levels in the Korean general population in the past [16,18,27-29,36]. It is not feasible to make direct comparisons with them due to the difference in the LOD. We missed the opportunity to assess the links between age and BMI and TCDD among the veterans and a control group. In the meantime, the main focus for serum TCDD research in Koreans has been the workers at the contamination sources, including incinerators, and neighboring residents [16,18,29,36], along with a few studies on the general population and residents who do not live nearby a contamination source [27,28]. As food is the main source of exposure in human accumulation of polychlorinated dibenzo-dioxins / -furans, the way food is consumed can make a difference in the human TCDD concentration level [34,38]. Thus, the lack of inclusion of food intake was another challenge we must consider in the future.
In conclusion, as of 2001, Korean veterans' serum TCDD concentration was lower than that of other environmental, occupational, and US veterans' studies and may be similar to that of the general Korean population. Considering that the Vietnam War was over 40 years ago and the Korean veterans have since been exposed to other environments, it would not be straightforward to assess their exposure to Agent Orange by using the serum TCDD concentration unless we could identify some Korean veterans who were very highly exposed to Agent Orange as much as the US Ranch Hand veterans were. This study found that there were no significant relationships between serum TCDD concentration and deployment duration, unit of deployment, year of first deployment, military ranks, and the perceived exposure index and two proximity-based exposure indices to Agent Orange developed by the current research team. As the serum TCDD concentration itself seems to have some limitations as a solid measurement of the exposure to Agent Orange, constructing a more accurate indicator of exposure to Agent Orange, based on military records or self-reported information, in order to clearly identify the high exposure group among Korean veterans would be a challenge. The study also discovered that there were no significant relationships between serum TCDD concentration, and age, BMI, and smoking in Korean Vietnam veterans.
ACKNOWLEDGEMENTS
This study was supported by a research grant of the Korean Ministry of Patriots and Veterans Affairs, 1999, 2003, and 2007. The authors truly thank Dr. JM Stellman and Dr. SD Stellman for their permission to use their herbicide exposure data. We also sincerely thank YS Chang and his research team at the School of Environmental Science and Engineering at Pohang University of Science and Technology for their TCDD measurements.
Notes
The authors have no conflicts of interest with the material presented in this paper.