Demographic and Survivorship Disparities in Non–muscle-invasive Bladder Cancer in the United States
Article information

Abstract
Objectives
To examine survivorship disparities in demographic factors and risk status for non–muscle-invasive bladder cancer (NMIBC), which accounts for more than 75% of all urinary bladder cancers, but is highly curable with early identification and treatment.
Methods
We used the US National Cancer Institute’s Surveillance, Epidemiology, and End Results registries over a 19-year period (1988-2006) to examine survivorship disparities in age, sex, race/ethnicity, and marital status of patients and risk status classified by histologic grade, stage, size of tumor, and number of multiple primary tumors among NMIBC patients (n=29 326). We applied Kaplan-Meier (K-M) and Cox proportional hazard methods for survival analysis.
Results
Among all urinary bladder cancer patients, the majority of NMIBCs were in male (74.1%), non-Latino white (86.7%), married (67.8%), and low-risk (37.6%) to intermediate-risk (44.8%) patients. The mean age was 68 years. Survivorship (in median life years) was highest for non-Latino white (5.4 years), married (5.4 years), and low-risk (5.7 years) patients (K-M analysis, p<0.001). We found significantly lower survivorship for elderly, male (female hazard ratio [HR], 0.96), Latino (HR, 1.20), and unmarried (married HR, 0.93) patients.
Conclusions
Survivorship disparities were ubiquitous across age, sex, race/ethnicity, and marital status groups. Non-white, unmarried, and elderly patients had significantly shorter survivorship. The implications of these findings include the need for a heightened focus on health policy and more organized efforts to improve access to care in order to increase the chances of survival for all patients.
INTRODUCTION
Non–muscle-invasive bladder cancer (NMIBC), or non-invasive papillary transitional cell carcinoma, is an early-stage tumor that accounts for approximately 75 to 85% of all urinary bladder cancers [1]. The 5-year survival rate in this early stage is remarkably high (well over 90%), but decreases significantly for high-risk and late-stage tumors [2,3]. Most importantly, NMIBC is highly curable by the surgical removal of tumor cells. However, the survivorship of NMIBC can be threatened if this “non–muscle-invasive” or “superficial” type of bladder tumor is not clearly identified [4,5].
A study found that the low sensitivity of differentiating NMIBC from muscle-invasive bladder cancer (i.e., subepithelium/submucosa) in low-grade tumors was a problem [6]. Nevertheless, to improve the survivorship of NMIBC patients, it is essential to specify the stage of tumor progression using the tumor–node–metastasis (TNM) staging system, with a particular focus on distinguishing among Ta (non-invasive papillary carcinoma confined to the urothelium, 70% of NMIBCs), T1 (a tumor invading the subepithelial connective tissue, 20%), and Tcis (carcinoma in situ: a “flat tumor” confined to the urothelial layer, 10%) [5]. Risk classification/stratification is another distinction that should be made to better understand and predict NMIBC survivorship. It was used in the early European Organization for Research and Treatment of Cancer (EORTC) randomized trials to predict the short- and long-term risks of recurrence and progression, as well as in other studies [7-9]. This classification may be ideal when it includes multifocality (single or multiple tumor sites), prior recurrence (less than 3 months or less than 1 year), the presence of concomitant Tcis, histologic grade, stage (Ta, T1), and size (3 cm) of a tumor for individual NMIBC patients [7,8]. However, this approach to risk classification can be challenging to apply to population-based surveillance data due to limited information [9,10]. A few studies also found that demographic factors (e.g., race/ethnicity and sex) of patients with NMIBC made a significant contribution to survivorship disparities among populations [11,12], and many studies have included patients’ characteristics as confounders [7,8,12-14].
In this population-based study that used a national dataset, we attempted to identify and risk-stratify NMIBC by histologic grade, stage, size of the tumor, and number of primary tumors, and we examined demographic, risk profile, and survivorship disparities among NMIBC patients.
METHODS
Data Source
We retrospectively analyzed the National Cancer Institute’s Surveillance, Epidemiology, and End Results (SEER) registry datasets longitudinally collected from 1988 to 2006 (19 years). The SEER registries contain nationally representative population-based cancer surveillance data, and they routinely collect information on the incidence and survival rates of cancer, covering approximately 28% of the US population [15]. Our data analysis encompassed 17 regional registries in the US [15]. That is, of the 18 SEER registries that were grouped by time periods for analytic purposes (i.e., 1988-1991, 1992-1999, and 2000-2006), we included the following 17: Atlanta, Connecticut, Detroit, Hawaii, Iowa, New Mexico, San Francisco-Oakland, Seattle-Puget Sound, Utah, Los Angeles, San Jose-Monterey, Rural Georgia, the Alaska Native Tumor Registry, Greater California, Greater Georgia, Kentucky, and New Jersey. Louisiana was excluded due to the impact of Hurricanes Katrina and Rita from July to December 2005.
The SEER public database provides the following information of patients with cancer: age, sex, race/ethnicity, and marital status at the time of diagnosis; all reportable malignancies of in situ, benign, and borderline primary tumors over the lifetime of a patient; month and year of diagnosis; primary site of the tumor based on the International Classification of Diseases for Oncology, Third Edition (ICD-O-3) for topography codes; grade determined by pathology tests to describe the degree of an abnormal cell’s resemblance to its normal counterpart; tumor size in millimeters; SEER historical stage; number of primary tumors; survival time; and vital status [16,17].
We extracted all records with the SEER Site Recode ICD-O-3 criteria C67.0 to C67.9 (n=128 927) [17]. Out of those 128 927 patients, we were able to identify and analyze 29 326 NMIBC patients who had a single primary malignant site, representing a very early stage of a tumor, and met the American Joint Committee on Cancer coding algorithm for TNM and stage in the SEER data [18]. We excluded cases that contained multiple primary tumors/malignant sites over the total lifetime, recurrence of bladder cancer, and inappropriate coding or missing values.
Our demographic factors included both categorical (i.e., sex, race/ethnicity, and marital status) and continuous variables (age). The rate of NMIBCs was calculated by dividing the number of NMIBCs by the number of urinary bladder cancers. We also classified risk by stratifying NMIBC patients into risk groups (low, intermediate, and high). The factors for our risk classification were distinguishable from those used for the EORTC risk table in that we included a single primary site over the total lifetime, stage, and tumor size together, regardless of the recurrence of bladder cancer [7].
(1) Low-risk groups: Single primary malignant site; stage Ta; grade I (well differentiated) or II (moderately differentiated); and tumor size <3 cm.
(2) High-risk groups: Single primary malignant site: stage Ta, T1, or Tcis (grade III [poorly differentiated]) or IV (undifferentiated); and tumor size ≥3 cm.
(3) Intermediate-risk groups: Single primary malignant site: stage Ta or T1 (grade III or IV); and tumor size <3 cm.
Statistical Analysis
Our statistical analyses included the Student t-test, analysis of variance, and the chi-square test to compare the mean differences between or among groups and to examine the relationships between categorical variables, respectively. Furthermore, we conducted survival analyses by patient demographics using the Kaplan-Meier method to estimate the median survival time for each risk status and multivariate Cox proportional hazard regression to estimate hazard ratios (HRs), with tumor death as the binary outcome variable after controlling for risk status and demographics. Risk status was measured as low, intermediate, and high. All statistical significance was determined at the 95% confidence interval (CI) level (p<0.05) using SAS version 9.2 (SAS Institute Inc., Cary, NC, USA).
RESULTS
Figure 1 indicates that from 1988 to 2006, the average NMIBC rate was 73.2% among patients with urinary bladder cancer over time. Moreover, the number of NMIBC patients increased over time from 3174 in 1988 to 11 079 in 2006, which reflected the increasing number of SEER registries (i.e., 9 registries in 1988-1991; 13 registries in 1992-1999, and 18 registries in 2000-2006). Table 1 shows that the majority of NMIBC patients were males (74.1%), non-Latino white (86.7%), and married (67.8%). The older patients were in the higher-risk group. Males were at higher risk than females (p<0.01). High risk status was more common in non-Latino black participants than in non-Latino white participants (19.8 vs. 17.6%; p<0.01). Overall, unmarried patients were at higher risk than married patients (p<0.001). The risk of the tumor significantly increased with age. Table 2 presents the median survivorship. Non-Latino white participants had a 0.6-year longer median survival than non-Latino black participants (p<0.001). Married participants had a 0.2-year longer survivorship than unmarried participants (p<0.001). The median survivorship of the low-risk group was 1.3 years longer than that of the higher-risk group (p<0.001).
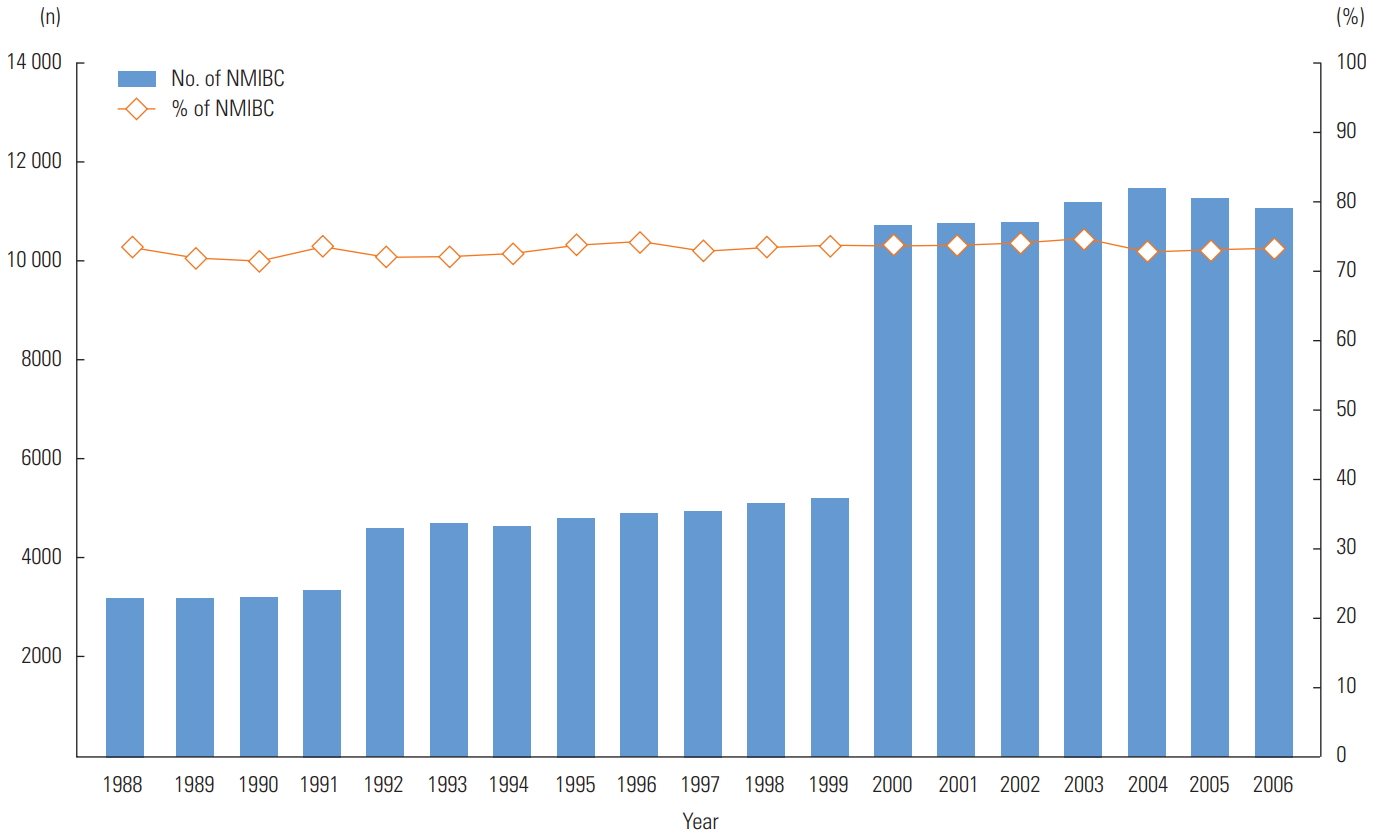
Distribution of non-muscle-invasive bladder cancer (NMIBC) patients, 1988-2006. The rate of NMIBC was calculated by dividing NMIBC patients that meet the International Classification of Disease for Oncology, Third Edition criteria, C67.0 to C67.9 including tumor stage Ta, T1, Tis (carcinoma in situ) by urinary bladder cancer patients.

Distribution of patients with NMIBC by risk status in the US National Cancer Institute’s Surveillance, Epidemiology, and End Results registries, 1988-2006 (n=29 326)
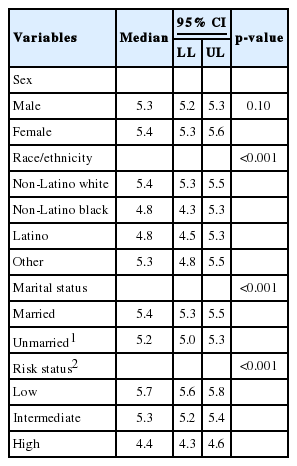
Median survivorship in years by patient demographics and risk status
As Table 3 shows, the Cox proportional HRs regarding the likelihood of survivorship among NMIBC patients indicate that the risk of death among females was lower than among males after controlling for age, race/ethnicity, marital status, and risk status (HR, 0.96; p<0.05). Compared to non-Latino white participants, the risk of death among non-Latino black participants was 13% higher (HR, 1.13; p<0.005). Similarly, the risk of death among Latinos was 20% higher than among non-Latino whites (HR, 1.20; p<0.001). Married patients were less likely to die (HR, 0.93; p<0.001) than their counterparts who were single, separated, divorced, or widowed. The risk of death among NMIBC patients with a high-risk status was 33% higher than the risk of death among those with a low-risk status (HR, 1.33; p<0.001). Regarding age at diagnosis, the risk of death increased by 0.2% with increased age (HR, 1.00; p<0.001).

Multivariate Cox regression results for non–muscle-invasive bladder cancer survivorship
DISCUSSION
Our findings suggest that disparities in survivorship are ubiquitous based on the risk factors investigated in our study (i.e., low-/intermediate-/high-risk status by tumor grade, stage, size, and site) and all demographic factors (i.e., age, sex, race/ethnicity, and marital status). Our study confirmed that the extent of survivorship varies across population-based studies, clinical sample-based studies, and randomized clinical trials. That is, the probability of death in our study was higher for the high-risk group than for the low-risk group by 33%. Interestingly, these increased odds are substantially lower than the findings reported by Millán-Rodríguez et al. [14] based on clinical patient samples, according to which a 15-fold higher risk was present in the high-risk group than in the low-risk group. We believe that the difference in these risk levels for the high-risk groups may have resulted from the different proportions of NMIBC samples in the low- and high-risk groups between studies. For example, in our study, 74.1% were male, 86.7% were non-Latino white, 67.8% were married, and the average age was 67.74 years, in comparison to corresponding rates of 72-81%, 87-95%, 68-75%, and 65-67 years in previous studies, respectively [2,13]. Another point to note is that the rates of NMIBC for low- and high-risk groups between our study with the 19-year SEER data (37.6 and 17.7%, respectively) and another 1-year SEER-based study (36.5 and 16.2%, respectively) [10] appear quite compatible. In contrast, these rates are markedly distinct from those reported in a clinical patient sample-based study (11.5 and 43.9%, respectively) [8].
Another important finding in our study is that poorer survival outcomes in NMIBC patients seemed to be significantly associated with race [11]. Although Latinos had the lowest risk probability of NMIBC, the survival duration of this group was the lowest. We recommend further investigation of any possible relationships between lower survivorship among Latinos and potential socioeconomic barriers to seeking proper clinical cancer care, extending from diagnosis to treatment and follow-up. Such barriers may include health illiteracy, financial burdens or medical debts, and a lower rate of health insurance coverage.
Similarly, non-Latino blacks had a shorter median survivorship than non-Latino whites by 0.6 years, which is supported by a study of Underwood et al. [12], who reported that more non-Latino blacks were in higher-risk groups (i.e., intermediate- and high-risk) than non-Latino whites. Furthermore, our study found that married participants survived longer than unmarried participants (p<0.001). This disparaity most likely reflects the fact that more unmarried patients than married patients were in the higher-risk groups in our analysis.
Our study has some limitations. First, the SEER data only contain prognostic and demographic factors, not other information that might influence survival, recurrence, and tumor progression. Such factors include genetic, behavioral, emotional, and even geographic determinants. Second, the limited prognostic factors used in our study might limit the generalizability of our findings to other clinical, sample-based studies. Nevertheless, the attempt made in this study to apply risk classification and risk adjustment using population-based data can provide preliminary insights for researchers who only rely on clinical patient samples. Third, our multivariate survival analysis did not include other determinants of health care utilization, such as health insurance status, which would have enabled an investigation of problems accessing needed cancer care.
In conclusion, survivorship disparities were found to be ubiquitous across age, sex, race/ethnicity, marital status, and risk status. Non-Latino white, unmarried, elderly, and higher-risk patients had significantly shorter survivorship. The implications of these findings include the need for a heightened focus on health policy and more organized efforts to improve access to care in order to increase the chances of survival for all patients.
ACKNOWLEDGEMENTS
The authors appreciate the assistance of Dr. Ying Li, Meredith Chen, Jonathan Fusfield, and Cahdi Jones.
Notes
CONFLICT OF INTEREST
The authors have no conflicts of interest associated with the material presented in this paper.