The Effects of a 7000-Step Goal and Weekly Group Walking Program for Overweight and Obese Elderly People in Sarawak, Malaysia: A Quasi-experimental Study
Article information

Abstract
Objectives:
Physical inactivity is the fourth leading global risk factor for mortality, followed by obesity. The combination of these risk factors is associated with non-communicable diseases, impaired physical function, and declining mental function. The World Health Organization recommends physical activity to reduce the mortality rate. Thus, this study examined the effects on anthropometric measurements of a 12-week walking program for elderly people in Samarahan, Sarawak, Malaysia with a 7000-step goal and weekly group walking activities.
Methods:
A quasi-experimental study was conducted involving 109 elderly people with a body mass index (BMI) ≥25.0 kg/m2. BMI, body composition, and average daily steps were measured at baseline, 6 weeks, and 12 weeks. Data were analyzed using SPSS version 26.0, and repeated-measures analysis of variance with the paired t-test for post-hoc analysis was conducted.
Results:
In total, 48 participants in the intervention group and 61 participants in the control group completed the study. A significant interaction was found between time and group. The post-hoc analysis showed a significant difference between pre-intervention and post-intervention (within the intervention group). The post-intervention analysis revealed an increase in the mean number of daily steps by 3571.59, with decreases in body weight (-2.20 kg), BMI (-0.94 kg/m2), body fat percentage (-3.52%), visceral fat percentage (-1.29%) and waist circumference (-2.91 cm). Skeletal muscle percentage also showed a significant increase (1.67%).
Conclusions:
A 12-week walking program combining a 7000-step goals with weekly group walking activities had a significant effect on the anthropometric measurements of previously inactive and overweight/obese elderly people.
INTRODUCTION
Physical inactivity is the fourth leading risk factor for global mortality, followed by overweight and obesity in fifth place [1]. “Globesity” is a term coined by the World Health Organization (WHO) in 2001 to reflect the epidemic of obesity around the world [2]. Based on the recent National Health and Morbidity Survey on the elderly in Malaysia [3], the rates of overweight and obesity were about 37.0% and 17.6%, respectively, based on the body mass index (BMI) classification set by WHO in 1998 (Institute of Public Health, 2019). Obesity and overweight were associated with a higher risk of impaired physical function due to reduction in muscle mass, an increased risk of falling, and an increased likelihood of numerous non-communicable diseases (NCDs) such as hypertension, diabetes, heart disease, and dementia [4]. With these multiple morbidities, overweight and obese elderly people are at risk of becoming dependent on others for their activities of daily living and of experiencing an impaired quality of life [5].
According to the Malaysia National Health Morbidity Survey from 2015, the majority (89.8%) of obese elderly people had at least one NCD, and the rate of physical activity (PA) among obese elderly people was about 32.6%, which was significantly lower than that of non-obese elderly people (67.4%) [6]. Statistically speaking, most elderly people who are obese or overweight have multiple comorbidities and are not as physically active as non-obese or overweight elderly people. Thus, health programs should not focus on managing individual diseases alone; rather, they should take a holistic approach to manage the health of elderly people. The recommended program for the health improvement of elderly people is the PA program. There are various PA programs for the elderly, including brisk walking, dancing, swimming, bicycle riding, and others [7]. Walking is the preferred PA program among the elderly, as it does not require any special equipment, facilities, or skills [8].
The current recommended number of steps per day for the elderly is at least 7000 steps [9]. This recommendation is equivalent to 30 minutes of moderate-to-vigorous PA per day as recommended by WHO for older adults, based on direct measurements of walking cadence by the WHO. Limited studies have investigated PA measured by objective methods such as pedometers or accelerometers among the elderly in Malaysia. According to Sazlina et al. [10], the average daily step count of elderly people with diabetes mellitus was 3549 steps per day (standard deviation [SD], 489 steps, n=69). Another study by Azizan et al. [11] reported that the average step count of elders (community-dwelling people) was 1737 steps per day (SD, 225 steps, n=73). Both studies showed that a great majority of elderly people in Malaysia do not meet the recommended level of PA.
A gradual walking program was implemented to encourage the elderly to stop sedentary behavior and become physically active. For the post-menopausal population, walking 10 000 steps per day has been associated with lower BMI, lower body fat percentage, reduced waist circumference, and prevention of skeletal muscle loss [12,13]. However, only limited research has investigated the effect of 7000-step walking programs among the elderly globally. Therefore, the objective of this study was to investigate the effects of a 7000-step walking program on BMI, waist circumference, and body composition among the elderly in Samarahan, Sarawak, Malaysia.
METHODS
Study Design
A quasi-experimental study was conducted for 12 weeks from October 2019 until January 2020, ending before the coronavirus disease 2019 lockdown in Malaysia. The participants were divided into an intervention group and a control group. The intervention group participated in a combination 12-week gradual walking program that used pedometer feedback as a motivation tool and included weekly group activities, such as walking together in a park. The control group did not participate in the program, and participants were asked to continue their routine activities.
Study Participants and Setting
The sample size was calculated using G*Power version 3.1.9.4 with repeated-measures analysis of variance (ANOVA) between groups [14]. The alpha error probability was set at 0.05, and the power (1-β error probability) at 0.95. The number of groups was 2, the number of measurements was 7, and the expected effect size was 0.42 [11]. A total of 46 participants were included in the sample for this study. Since this was a quasi-experimental study, the expected loss to follow-up could be as high as 25% [15]. Thus, the plan was to recruit at least 59 participants for each group.
The selection criteria of participants were elderly people from 60 years to 75 years old and a BMI>24.9 kg/m2. The exclusion criteria were participants with mobility limitations, cognitive impairment, vision and hearing impairment, and those who refused to participate in the study.
The study was conducted at Ministry of Health (MOH) facilities at elderly health clubs (Kelab Warga Emas), which are part of the expanded scope of the primary healthcare division of Malaysia’s MOH. Three elderly clubs within the Samarahan Division (i.e., Sadong Jaya, Asajaya, and Kota Samarahan) were approached. The Sadong Jaya elderly club was randomly selected to be the intervention group and the Asajaya club as the control group. The Kota Samarahan elderly club was unable to participate due to other commitments.
Intervention and Outcome Measurements
The program was a 12-week gradual walking program that used pedometers for daily feedback. This program was adopted from the Department of Health Services, Division of Public Health, Wisconsin, United States [16]. The program’s goal was for participants to achieve physically active status by taking 7000 steps per day. Each participant was given a pedometer that provided daily feedback on step count. The dependent variables were measured at 3 points (baseline, 6 weeks, and 12 weeks). The outcomes were PA and anthropometric measurements.
PA measurements were obtained using Omron HJ 325 pedometers (Omron Healthcare, Vernon Hills, IL, USA) which have been proven to be accurate for counting steps, as validated in another study [17]. The pedometers were calibrated by comparing the number of participants’ actual steps to the number of steps recorded by the pedometer. Pedometers were placed on participants’ right hips according to the manufacturer’s recommendation and given to participants for 7 days before the walking program officially began. Using data from these 7 days, during which participants were asked to go about their daily routines, the average baseline number of steps each participant took per day was measured and recorded. The total number of steps by each participant during this period was recorded and divided by 7, which yielded each participant’s average daily step count.
Height was recorded in centimeters using a Seca 213 stadiometer (Seca, Hamburg, Germany), and waist circumference was recorded in centimeters using a Seca 210 (Seca) measuring tape. Body weight (in kg), body fat percentage, visceral fat percentage, and skeletal muscle percentage were measured using HBF 214 (Omron Healthcare). Weight was recorded to the nearest 0.1 kg, while percentages were measured to the nearest 0.1%. BMI (kg/m2) was calculated using the standard formula (weight in kilograms divided by the height in meters squared) and was auto-calculated with an Omron Karada Scan (Omron Healthcare) after inputting the required information. BMI was classified using the WHO criteria for adults [18].
Upon completion of baseline data collection, the intervention group met in their respective small groups to set their daily step goals. The aim was to increase each participant’s step count gradually, by 500 steps per week starting from their baseline, over the 12-week period until it exceeded 7000 steps. During a feedback session, the participants were asked to list their strategies for increasing their step counts, such as walking with a friend every afternoon, walking to shops, walking to mosques or churches, and walking to the elderly health club from their homes. The pedometer measured participants’ step count over the course of each day and provided feedback on the amount of PA they undertook. Every Friday, there was a gathering at the elderly health club to examine each person’s step counts achieved over the previous week. A walking activity was also scheduled for every Friday morning over the 12 weeks, during which participants walked anywhere from 500 steps to 3500 steps in small groups, which immensely helped to supplement participants’ baseline daily steps.
Of the potential participants, 175 were excluded during the recruitment phase as shown in Figure 1, due to having a normal BMI or meeting other exclusion criteria. At the beginning of the study, there were 60 participants in the intervention group and 68 participants in the control group. Of these participants, 48 from the intervention group and 61 from the control group completed the study. The total loss to follow-up was 12 participants from the intervention group and seven from the control group. Interviews over the phone were conducted with participants who did not complete the study. The main reasons for not completing the study cited were having busy schedules that prevented participants from completing the first and second measurements (n=13) and moving away from the study area (n=6). None of the participants reported adverse events throughout the course of this study.

Study flow of participants.
Statistical Analysis
The data collected were analyzed using SPSS version 26.0 (IBM Corp., Armonk, NY, USA). Continuous data were presented in terms of mean±SD for normally distributed data and medians and interquartile ranges for data with an abnormal distribution. The categorical data were presented in terms of frequencies and percentages. For inferential analysis, repeated-measures ANOVA was used to examine the changes in dependent variables in each group (BMI, body fat percentage, skeletal muscle percentage, visceral fat percentage, and waist circumference). A p-value less than 0.05 was considered to indicate statistical significance. The assumption of a normal distribution of the dependent variables in each group was checked. The Levene test of equality of error variances was met and Box’s M test showed a p-value>0.001; thus, the assumption of homogeneity of variances was met. However, the Mauchly test was significant, showing that the assumption of sphericity was violated. Since repeated-measures ANOVA is robust to some violations, the interpretation of test results was continued by using either the Greenhouse-Geisser (BMI, waist circumference, and body fat percentage) or Huynh-Feldt correction test (skeletal muscle percentage, daily steps) [19].
Ethics Statement
This study received approval from University Malaysia Sarawak Ethics Committee (NUMAS/NC-21/02/03-02 JLD 3 [76]) and National Medical Research Registration (NMRR-18-3850-45388). A consent form was dated and signed by those willing to participate in the study. Participants who wished to withdraw from the study were allowed to do so at any point in time. This study adhered to the principles of the Declaration of Helsinki.
RESULTS
A plurality of participants in the intervention and control groups were 60 years to 64 years old. The mean±SD age for the intervention group was 65.73±5.57 and 66.15±4.25 for the control group. In both groups, there were more female participants than male. Most participants were Malay (85.4% for the intervention group and 96.7% for the control group). There was no statistically significant difference between each group according to ethnicity (χ2 (1)=0.01, p>0.05). Likewise, the two groups did not show a statistically significant difference in education level (χ2 (3)=2.46, p>0.05). In both groups, a majority of the participants had 2 NCDs (52.1% for the intervention group and 52.5% for the control group) (Table 1).

Socio-demographic characteristic of participants in both groups
The mean±SD body weight in the intervention group was 67.71±7.76 kg and 68.40±9.26 kg in the control group. The mean BMI in the intervention group was 28.72±2.50 kg/m2 and 28.73±3.09 kg/m2 in the control group. Body composition measurements showed that the mean±SD body fat percentage was 32.70±5.37% in the intervention group and 35.37±5.66% in the control group. While the mean±SD visceral fat percentage was 14.47±4.85% in the intervention group, it was 13.18±4.63% in the control group. The skeletal muscle percentage was 24.99±3.49% in the intervention group and 25.11±3.32% in the control group. The mean waist circumference was 92.86±6.99 cm in the intervention group and 92.55±7.67 cm in the control group (Table 2).
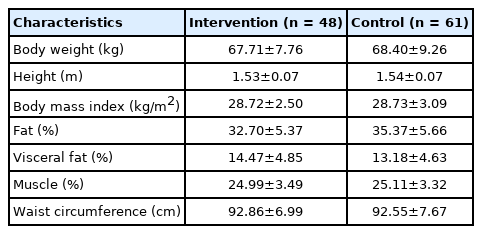
Anthropometric measurements of participants in both groups
There was a significant interaction between time and group for steps per day (F[1.32, 141.11]=597.44, p<0.001). The post-hoc comparison indicated that there were no significant differences between the 2 groups at baseline. Significant differences between the groups were found at 6 weeks and 12 weeks. The mean step count of the intervention group at 6 weeks was 4491.56±1155.48 steps and 6975.31±1017.51 steps at 12 weeks, where as the control group had a mean of 3190.84±903.21 steps at 6 weeks and 3287.23±863.84 steps at 12 weeks. The intervention group had a higher number of daily steps than the control group after 6 weeks and 12 weeks of the intervention (Table 3).
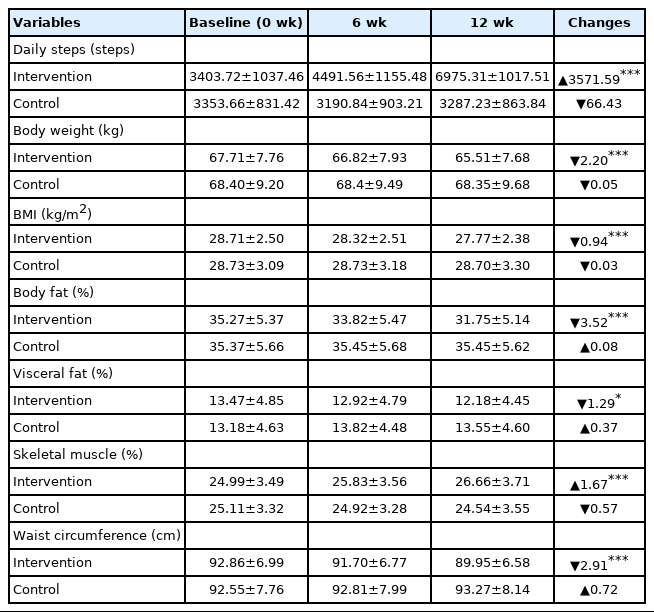
As seen in Table 3, there was a significant interaction between time and group for body weight (F[1.43, 156.67]=40.11, p<0.001). The post-hoc comparison indicated that there was no significant difference between the groups. Simple effect analysis showed a significant difference within group of intervention between baseline body weight 67.71±7.76 kg and body weight at 12 weeks 65.51±7.68 kg as t(1, 47)=14.62 in the intervention group (p<0.001).
Table 3 shows that there was a significant interaction between time and group for BMI (F[1.46, 155.83]=43.31, p<0.001). The post-hoc comparison indicated that there was no significant difference between the groups. There was, however, a significant difference between baseline BMI and BMI after 12 weeks for the intervention group (t[1, 47]=14.13, p<0.001). For the intervention group, the mean BMI at baseline was 28.71±2.50 kg/m2 and 27.77±2.38 kg/m2 at 12 weeks. The intervention group had a lower mean BMI reading after 12 weeks of the intervention.
Table 3 also shows the mean body fat percentage from baseline to 12 weeks for both groups. There was a significant interaction between time and group for body fat percentage (F[1.41, 138.27]=52.69, p<0.001). The post-hoc comparison indicated that there was no difference between the groups at baseline and 6 weeks. Simple effect analysis showed a significant difference at 12 weeks, with the intervention group having a lower mean body fat percentage (31.75±5.14%) than the control group (35.45±5.62%).
As shown in Table 3, there was a significant interaction between time and group for visceral fat percentage (F[1.45, 155.09]=63.65, p<0.001). The post-hoc comparison showed that there was no significant difference between groups; however, there was a change in the mean visceral fat percentage of the intervention group from baseline (13.47±4.85%) to 12 weeks (12.18±4.45%). The intervention group showed a lower mean visceral fat percentage after 12 weeks of the intervention.
Table 3 shows that there was a significant interaction between time and group for waist circumference (F[1.39, 146.76]=112.48, p<0.001). The post-hoc comparison indicated that there was no significant difference between the groups at baseline and 6 weeks. There was a significant difference between groups at 12 weeks, with the intervention group having a lower mean waist circumference (89.95±6.58 cm) than the control group (93.27±8.14 cm).
Table 3 shows the mean skeletal muscle percentage from baseline to 12 weeks for both groups. There was a significant interaction between time and group for skeletal muscle percentage (F[1.35, 146.71]=93.93, p<0.001). The post-hoc comparison indicated that there was no significant difference between the groups at baseline and 6 weeks. There was a significant difference between groups at 12 weeks, with the intervention group showing a higher mean skeletal muscle percentage (26.66±3.71%) than the control group (24.54±3.55%).
DISCUSSION
This study was designed to improve the PA of the elderly while examining the effect of gradual increases to daily step count, with an eventual goal of at least 7000 steps per day, on the BMI, waist circumference, and body composition of elderly people. The program was adopted from the Department of Health Services, Division of Public Health, Wisconsin, United States [16] and entailed a goal of 7000 steps per day, as recommended by Tudor-Locke et al. [9]. Gradual increases in daily step count enable inactive elderly people to become physically active with feedback from a pedometer that serves as a reminder for people to achieve their daily goal.
This study showed a dramatic increase in the intervention group’s mean±SD number of steps per day from 3403.72±1037.46 steps at baseline to 6975.31±1017.51 steps at 12 weeks, corresponding to an increase of about 104%. Similar results were found in other studies, which showed changes from 27.8% to 343% [20-22]. Before the program was conducted, the individuals’ rates of PA were determined according to the classification by Tudor-Locke et al. [22]. Among elderly people in both groups, 14.7% showed basal activity, 80.7% engaged in limited activity, and only 4.6% took part in low levels of activity. None of the participants surpassed the “somewhat active” status. After the intervention, the proportion of participants with low and somewhat active statuses showed a significant increase, with 66.7% in the low-activity group and 31.3% in the somewhat active group.
The present study showed that a gradual increase in daily step goal to 7000 steps over a period of 12 weeks had a modest effect on weight loss (about 2.20 kg, 3.23%) and BMI (-0.94 kg/m2) in the intervention group. Only limited studies in various countries have examined the effect of pedometer interventions on elderly populations. Two studies were conducted on middle-aged and older adults, using pedometer-based interventions over a period of 12 weeks. Those studies found that 12-week interventions produced significant decreases in body weight (ranging from 1.2 to 2.5 kg) and BMI (ranging from 0.6 to 1.0 kg/m2, p<0.001) [23,24].
Another study that examined overweight/obese adults (33-55 years old) found that the effect of a pedometer-based intervention on BMI over a 12-week period with 56% incremental increases in daily step goals did not produce a significant effect on weight loss compared to the control group [25]. Fauzi et al. [26] reported similar results in a study conducted among adults (20-50 years old) over 10 weeks, which showed there was no significant reduction from pre-intervention to post-intervention, with a BMI change of -0.4 kg/m2. The effect of a pedometer-based intervention alone on weight loss was greater on older adults rather than young adults. This can be explained by the fact that younger adults are much more responsive to programs combined with dietary intervention and not just walking interventions alone [26-28]. A second explanation could be natural weight loss or unintentional weight loss in older adults. This can be caused by various malignant and non-malignant factors such as chronic diseases, side effects of medications (especially metformin), social factors, and underlying malignancies [29,30]. This study also showed that 83% of participants had at least 1 NCD, such as hypertension, diabetes, and hypercholesterolemia, and were actively treated with medications at nearby health clinics. A third explanation pertains to the metabolic cost of walking (MCoW). MCoW refers to the amount of energy consumed by the human body in order to move. The MCoW was found to be positively correlated with age and BMI [31].
The reduction of fat percentage and visceral fat percentage contributed to the decrease in body weight. This study reported a decrease in fat percentage of 3.52% (equivalent to 3.01 kg), a decrease in visceral fat percentage of 1.29% (equivalent to 0.95 kg), and a decrease in waist circumference of 2.91 cm. These findings are supported by other studies that showed a range of body fat loss from 1.9% to 3.9% after 12-week and 24-week pedometer-based interventions [21,23,32].
This research showed that there was an increase in skeletal muscle of 1.67% (equivalent to 1.18 kg). However, a limitation of this study is that it only measured whole-body skeletal muscle percentage. In other studies, 10-week walking programs showed significant increases in muscle mass on the thighs and calves of older adults [33]. Walking programs also prevent the expansion of adipose tissue in muscles, thus reducing muscle mass and, consequently, strength [34]. Multiple researchers have shown a relationship between low muscle mass and impaired physical function in older adults [35]. The aging process tends to involve increased muscle lipid content [35], leading to reduced muscle mass, which is an independent risk factor for mobility limitations. The reduction of muscle mass has an effect on muscle strength and increases the risk of disability, potentially resulting in functional limitations of mobility [36].
The limitations of the study are related to its quasi-experimental study design. This design is prone to biases, specifically selection bias, regression to the mean, instrumentation bias, and the Hawthorne effect [37]. Selection bias probably resulted in the inclusion of highly motivated individuals. A high level of motivation could explain the increased walking activity among the participants, which often exceeded the recommended 7000 steps per day. The Hawthorne effect refers to changed behavior in participants simply due to the effects of being observed during the intervention [38]. Therefore, these biases may exaggerate the effectiveness of the program. The second limitation is that the program only included a PA intervention, rather than a combination of diet and PA. Combined interventions usually result in more weight loss than PA interventions alone. The third limitation relates to the loss of some participants to follow-up. Twelve participants withdrew from the intervention group and eight in the control group. Phone interviews revealed that most participants withdrew due to schedule conflicts resulting from the study being conducted over a school holiday (in December). None of the participants who withdrew reported having an adverse event as a result of the intervention. As part of the safety protocol of the study, medical examinations were conducted and health records were reviewed by a team of researchers.
In conclusion, a 12-week walking program, which gradually raised the step goal to 7000 steps, used pedometers to measure walking activity, and conducted weekly group activities such as walking together in a park had significant effects on body weight, body fat percentage, visceral fat percentage, and skeletal muscle percentage after completion of the intervention.
Notes
CONFLICT OF INTEREST
The authors have no conflicts of interest associated with the material presented in this paper.
FUNDING
None.
ACKNOWLEDGEMENTS
We would like to express our gratitude to our research assistants for their help and the utmost appreciation to the elderly respondents who have provided the necessary support to complete this study.
Notes
AUTHOR CONTRIBUTIONS
Conceptualization: WLC, HH. Data curation: MFS. Format analysis: WLC, HH. Funding acquisition: None. Methodology: WLC, HH. Project administration: MFS. Visualization: WLC, HH. Writing – original draft: MFS. Writing – review & editing: MFS, WLC, HH.