Social Contact Patterns Associated With Tuberculosis: A Case-control Study in Southwest Iran
Article information

Abstract
Objectives
Tuberculosis (TB) is a major public health concern worldwide. Social contact patterns can affect the epidemiology and risk of airborne diseases such as TB. This study was designed to investigate the social contact patterns associated with TB.
Methods
In this case-control study, groups of participants with and without TB were matched by age and sex. Participants reported the nature, location, frequency, and average duration of social contacts over 1 month. The duration and number of social and spatial contacts were compared between groups using the chi-square test and the t-test. Odds ratios (ORs) with 95% confidence intervals (CIs) were used to quantify the relationship between social contact time and TB status. Data were analyzed using Stata version 11 statistical software. A p-value of <0.05 was considered to indicate statistical significance.
Results
In this study, 80 patients with TB and 172 control participants were included, and a total of 3545 social contacts were registered. Social contact with family members (OR, 1.72; 95% CI, 1.10 to 2.40), contact with a person with TB (OR, 1.53; 95% CI, 1.16 to 2.01), and contact at the participant’s home (OR, 1.42; 95% CI, 1.19 to 1.82) were significantly associated with TB status.
Conclusions
The duration of long-term social contact, rather than the number of contacts, may be the main contact-related factor associated with TB transmission in this population. The focus of contact-tracing efforts should be on finding and treating both family members and long-term contacts in non-household settings.
INTRODUCTION
Tuberculosis (TB), which is caused by Mycobacterium tuberculosis, is the most common cause of death due to infectious disease in the world. Among all causes of death, the disease ranks 10th globally and first in developing countries [1]. The incidence rates in the world, the Eastern Mediterranean region, Iran, and the Khuzestan province of Iran are 132, 114, 16, and 14.5 cases per 100 000 people, respectively, representing a decrease relative to previous years [2,3]. World Health Organization reports indicate distinct geographical distributions of TB in different parts of the world [4]. Epidemiological studies have shown that several factors can increase the risk of TB. These include injection drug use, smoking, malnutrition, a body mass index of less than 18.5 kg/m2, and vitamin D deficiency [5,6]. Diseases such as silicosis, diabetes, kidney failure, various cancers, and bone marrow or organ transplants are also associated with an increased risk of TB [7,8].
TB is considered a social disease, and its infection and progression are strongly associated with socioeconomic factors as well as social and environmental interactions, including financial insecurity and congestion in living spaces [9–11]. Studies have shown that social contact patterns, including the frequency, duration, situation, and location of daily social interactions, are closely associated with the risk of heterogeneous infection in the community [12], which may indicate discrepancies in the risk of TB across communities [13,14]. In previous studies, researchers have largely identified patterns of social contact related to general populations without describing or comparing patterns of contact in high-risk populations or with persons with TB [15,16]. Identifying notable social contact patterns associated with TB may lead to new control interventions. Additionally, it can aid in contact tracing and case detection to prevent transmission by focusing attention on high-risk, high-priority contacts [17]. The identification of TB-associated contact patterns may also be useful for the development of mathematical transfer models used to identify high-risk groups (such as age or sex groups) in communities [11,18].
Contact with a person with TB is a key factor in the transmission of the disease; if a patient with active TB is placed in a closed environment, those in close contact may be infected within 12 hours [10]. In recent studies, a high rate of TB spread in different environments has been observed due to exposure to infected individuals in the community [14]. By identifying areas of the community at high-risk of TB, we can improve diagnosis and public health monitoring, and by performing environmental interventions, we may reduce the risk of exposure and transmission of the disease [17,19].
In the present study, we examined the patterns of social contact associated with TB with the primary goal of assessing the relationship between this disease and the duration of social contact. We hypothesized that longer social contact times were more likely to be reported by participants with TB. Our secondary goal was to identify specific types and locations of social contact associated with TB.
METHODS
Study Population
A case-control study was conducted to assess the social contact patterns associated with TB. The selected cases were newly registered, bacteriologically confirmed pulmonary TB patients who were over 18 years old and were referred to 36 health centers in Ahvaz, southwest Iran. The controls were attendees who were matched with the cases regarding age and sex and were referred to the same health centers for non-TB health problems.
Sampling Procedure
Selection of cases
The cases were newly identified patients who presented for treatment at the selected health centers in Ahvaz. The basic tests for pulmonary TB included a sputum smear test as well as a complete medical evaluation for TB including chest radiology (X-rays), culture, medical history, a physical examination, and a tuberculin skin test. In the data collection process, all newly registered TB patients were included until the required sample size was reached. For each case, 2 control participants were selected.
Selection of health facility controls
Attendees at the same facility who were age-matched (within 5-year age bands) and sex-matched with an individual case were selected as controls. Those who met the age and sex criteria were evaluated on a day when the clinic was operating. If a selected patient refused to participate in the study, the next eligible clinic attendee was evaluated. To manage the control patients’ medical conditions and to exclude pulmonary TB, they were visited by a doctor associated with the study. If the individual showed any sign of TB, the necessary laboratory tests for TB were performed according to the national diagnostic algorithm. Acid-fast bacilli microscopy tests are provided free of charge at the institutions, so participants were not charged for those exams. However, the costs of any necessary additional investigations, such as X-ray imaging, were covered by the study.
Data Collection
After selecting the research sample based on the inclusion criteria, explaining the study objectives, and assuring the participants of the confidentiality of the information collected, informed consent was obtained from all participants. Then, information was collected through face-to-face interviews using checklists and standard forms. The data collected included basic demographic data (age, sex, education level, monthly income, and employment status), as well as type and place of contact. In this study, all social contacts with the case and control participants during the month prior to entering the study were examined. All participants reported contacts according to the type of social relationship (family, friend, co-worker, or neighbor) and main places where the social contacts took place (private home, relatives’ home, school, workplace, mosque, market or store, restaurant, park, hairdresser, or health center). For each reported social contact, we asked the participant to indicate the average number of times per week they were in contact during the past month (e.g., daily, twice, or 3 times) and the average duration (in hours) of each contact.
Statistical Analysis
The contact time was calculated for every reported location and social contact. The estimation was performed by multiplying the average weekly frequency of each contact by the average duration of that contact. For example, if a participant reported meeting a social contact twice a week for 2.5 hours per meeting, the contact time would be 5 hours per week. To obtain an overall exposure time, the estimated contact time for each social contact was found for each participant. Reported social contacts and contact times were summarized in tables.
To analyze and compare the demographic variables in both groups, the t-test and chi-square test were used for continuous and categorical data, respectively. Logistic regression was used to estimate odds ratios (ORs) for the association between total social contact time and TB infection. The ORs for TB disease and total social contact time for each category of contact and location were also estimated.
Age and sex were included in the model to adjust for frequency matching. Income and education levels were included in the regression models to control for potential confounding due to their association with TB status and duration of social contact. Data were analyzed using Stata version 11 (StataCorp., College Station, TX, USA). A p-value of <0.05 was considered to indicate statistical significance.
Ethics Statement
This study was part of a PhD thesis that was approved by the Ethics Committee of Ahvaz Jundishapur University of Medical Sciences (IR.AJUMS.REC.1400.240). All methods were performed in accordance with the relevant guidelines and regulations of the Helsinki Declaration. Informed written consent/assent was obtained from all participants, who were assured of the confidential nature of the information gathered. All data collected were anonymized using unique study identifiers.
RESULTS
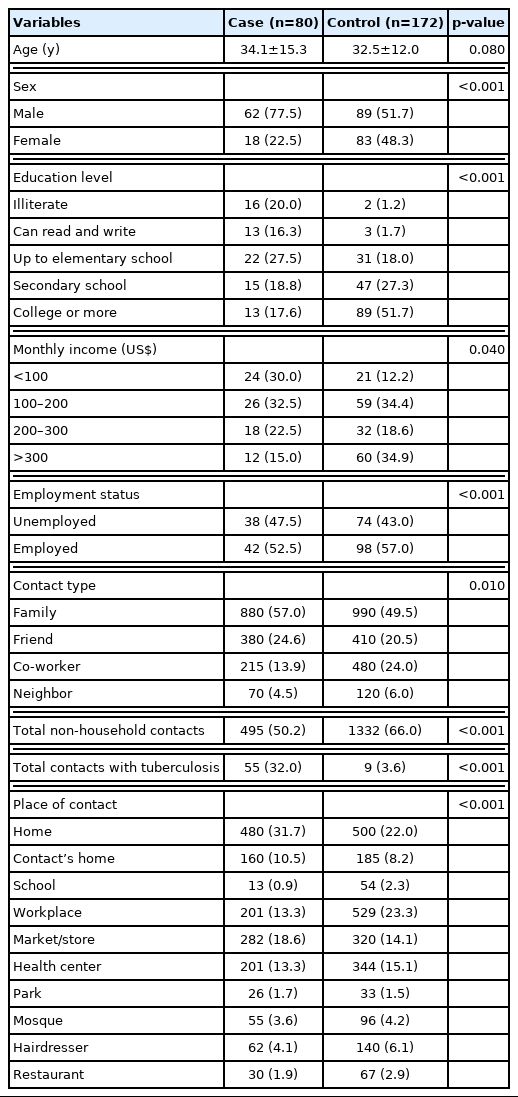
A total of 80 cases and 172 controls were included in the study. The mean ages of participants in the case and control groups were 34.1 years and 32.5 years, and more than half of the participants were male (59.9%). The control participants were more educated (p<0.001) and had higher employment levels (p<0.001) and monthly income (p=0.04) than the case group.
Overall, over the 1-month period, cases (n=1545) reported fewer social contacts than controls (n=2000). Family members represented the highest proportion of reported contacts for both case (n=880, 57.0%) and control (n=990, 49.5%) groups. The second most frequent type of social contact was with friends (n=380, 24.6%) in the case group and with colleagues (n=480, 24.0%) in the control group. Social contacts reported by cases most frequently occurred in the participants’ homes (n=480, 31.7%), while the most common location reported by the control participants was the workplace (n=529, 23.3%). The differences between groups regarding place of contact were statistically significant (Table 1).
Demographic factors and social contacts reported by case and control participants
Among the cases, the longest reported contact time was with family members (81.0%), followed by friends (10.0%) and co-workers (8.0%). In the control group, most of the contact time was with family members (70.0%), but the second contact time was with a colleague (22.0%) and then friends (5.0%) (Figure 1). In general, the highest reported contact time ratio for both case and control occurred at home and work (Figure 2).
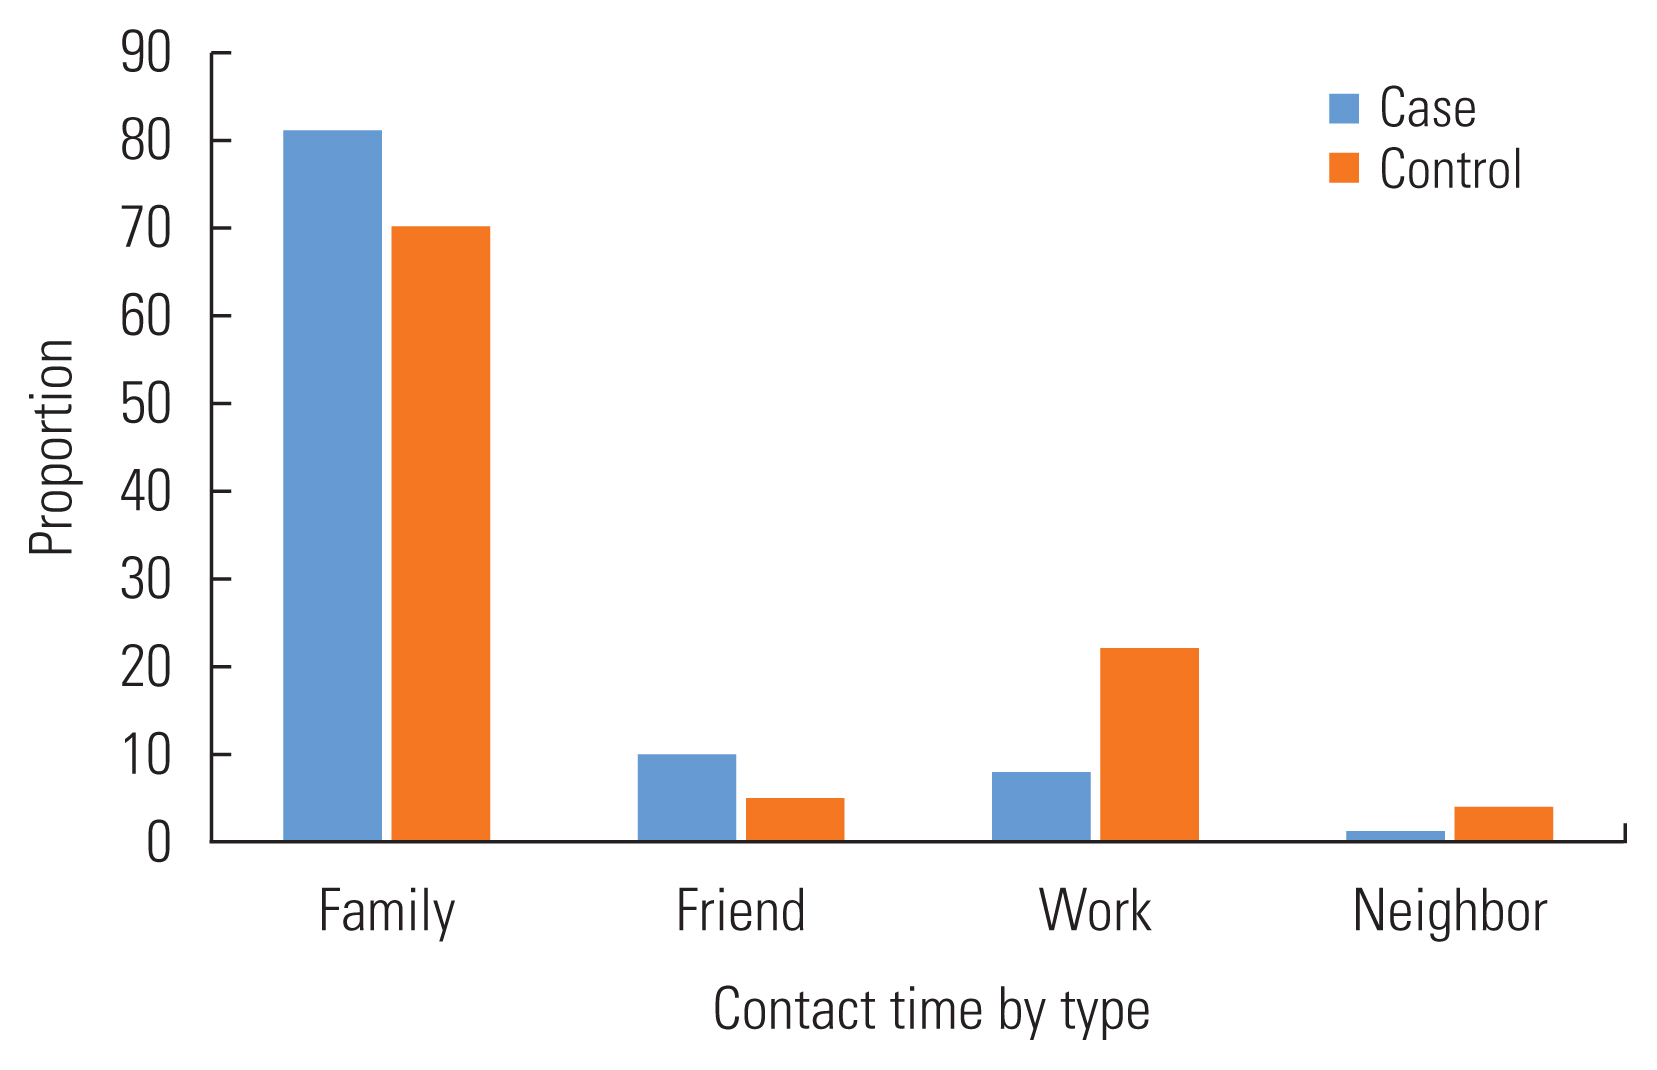
Total contact time reported by case and control participants based on social contact type.

Total contact time reported by case and controls based on the location of social contact.
The total contact duration with persons with TB was 947 hours (9% of overall contact time) in the case group but only 129 hours (1%) in the control group (Supplemental Material 1). The average numbers of social contacts reported by cases and controls are shown in Table 2. On average, the control group reported significantly more social contacts (mean±standard deviation, 23.92±13.45) than the case group (23.41±14.52) (p<0.001), and social contacts outside the home were similarly more frequent in the control group (7.68±5.44) than in the case group (7.21±5.35) (p=0.02). Regarding social contacts with people with TB, the case group reported significantly more contacts (1.15±3.23) than the control group (0.15±0.48, p<0.001) (Table 2). While controls reported more social contacts than did cases, the overall contact time was shorter among control participants (11.67±12.43 hr/wk) than cases (13.71±10.22 hr/wk). This difference was statistically significant (p=0.03) (Table 2). While the average numbers of family and home contacts did not differ significantly between cases and controls (p=0.08), the case group reported significantly more social contact time with family members than the control group (p<0.001) as well as more social contact time at home (p=0.02). Both groups reported more social contact time in the workplace, markets, stores and health centers (Table 2).
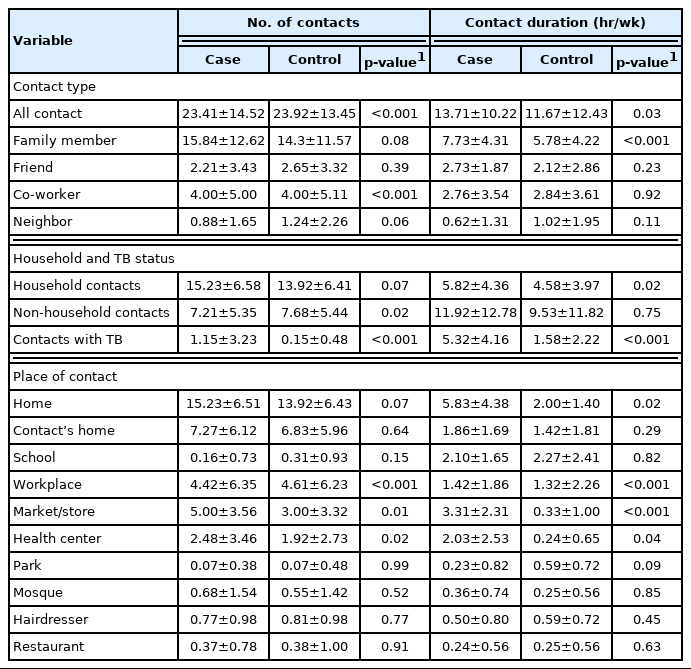
Social contacts in the prior month by type and location for case and control participants
Contact times per individual contact are reported in Supplemental Material 2. Generally, cases reported significantly longer social contact times per individual contact than the control participants (p<0.001). Cases reported significantly longer social contact times for each family member (p<0.001), co-worker (p=0.01), friend (p=0.04), and non-household contact (p=0.01). Cases reported longer social contacts in their homes (p=0.02), markets and stores, workplaces, and health centers than the control group (p<0.001).
After adjusting for age, sex, income, and education level, both duration of social contact with family members (OR, 1.72; 95% CI, 1.10 to 2.40; p=0.01) and history of contact with a patient with TB (OR, 1.53; 95% CI, 1.16 to 2.01; p<0.001) were significantly associated with TB status. Duration of social contact in the participant’s home (OR, 1.42; 95% CI, 1.19 to 1.82; p=0.03) was also associated with TB (Table 3).
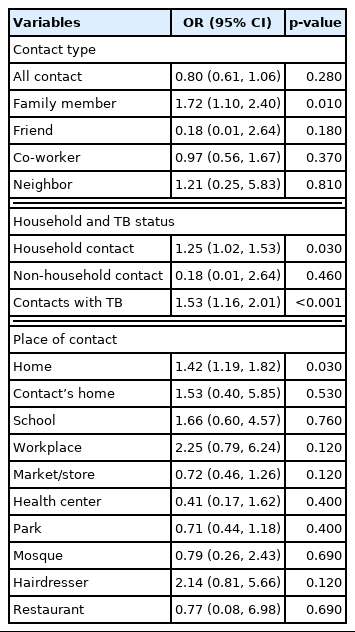
Adjusted logistic regression results by contact type and location
DISCUSSION
In this case-control study, we compared patterns of social contact between TB patients and healthy individuals to identify patterns that may be associated with disease transmission. Control participants reported more social contact than the case group, but cases had longer overall contact times than the control group, especially with family members and people with TB. These results demonstrate the possible types of exposure to TB cases that may confer higher risk of transmitting the TB disease due to longer contact times. These findings may be used by health organizations to strengthen and improve disease detection and infection control programs in environments with a high-risk of TB exposure. Although we found no association between overall contact time and TB, we noted that in almost all subgroups, cases reported longer contact periods than controls.
TB status was significantly associated with only duration of contact with family members and history of contact with people with TB. While most TB transmission and infection are thought to occur in non-household settings, we found that most social contact occurs in homes and with other families. Studies from Peru Town and Lima have demonstrated that a minority of tuberculosis transmission occurs within households [20].
Previous studies have demonstrated that participants with TB had a higher proportion of social contact with others with TB than did control participants, which was consistent with the results of our study [21]. Perhaps most importantly, most contacts with other known cases of TB occurred in non-home environments, indicating a risk of transmission to the community [22].
Contact time at home was significantly associated with TB status. Contact times at others’ homes, schools, markets or stores, workplaces, and hairdressers were associated with TB, but not to a statistically significant degree. The durations of social contact in health centers, parks, and restaurants were not associated with TB status. These results are somewhat consistent with the findings of a study conducted by Bui et al. [20].
Our study had several limitations. We used face-to-face interviews to collect long-term social contact data, and recall bias may have resulted in underestimation of social contacts or differential recall of contacts among cases. For example, the numbers of social contacts in parks, hairdressers, and restaurants were much lower than the figures reported in other studies in which diaries were used to collect social contact information [22,23]. Previous studies have shown that the use of prospective paper diaries, which require participants to record contacts during the day, yields more contacts than the retrospective questionnaire format used in the present study [22,24]. These results suggest that disease detection may be enhanced by focusing on long-term efforts in non-household environments.
In this study, the social contact patterns of participants with TB were compared with those of healthy individuals. We found that contact duration in the household and with individuals with TB are risk factors for TB, although most contacts with known TB cases occurred outside the home. Finally, participants with TB had fewer contacts but had longer durations of contact than control participants, and this pattern of contact may reflect TB transmission in the target population.
SUPPLEMENTAL MATERIALS
Supplemental materials are available at https://doi.org/10.3961/jpmph.22.335.
Notes
CONFLICT OF INTEREST
The authors have no conflicts of interest associated with the material presented in this paper.
FUNDING
Financial support was provided by the Vice-Chancellor for Research at Ahvaz Jundishapur University of Medical Sciences.
ACKNOWLEDGEMENTS
We appreciate all the observers who helped us to conduct this project.
Notes
AUTHOR CONTRIBUTIONS
Conceptualization: Alavi SM, Amoori N. Data curation: Alavi SM, Amoori N. Formal analysis: Amini P, Amoori N. Funding acquisition: Alavi SM. Methodology: Cheraghian B, Amoori N, Alavi SM. Project administration: Alavi SM, Amoori N. Visualization: Amoori N, Amini P, Cheraghian B, Alavi SM. Writing – original draft: Amoori N, Alavi SM, Amini P, Cheraghian B. Writing – review & editing: Amoori N, AlaviSM, Cheraghian B, Amini P.