
Articles
- Page Path
- HOME > J Prev Med Public Health > Volume 51(6); 2018 > Article
-
Original Article
Short-term Effect of Ambient Air Pollution on Emergency Department Visits for Diabetic Coma in Seoul, Korea -
Hyunmee Kim1
 , Woojin Kim1, Jee eun Choi2, Changsoo Kim1,2,3, Jungwoo Sohn3
 -
Journal of Preventive Medicine and Public Health 2018;51(6):265-274.
DOI: https://doi.org/10.3961/jpmph.18.153
Published online: October 29, 2018
1Department of Preventive Medicine, Yonsei University College of Medicine, Seoul, Korea
2Department of Public Health, Yonsei University Graduate School, Seoul, Korea
3Institute of Human Complexity and Systems Science, Yonsei University, Incheon, Korea
- Corresponding author: Jungwoo Sohn, MD, PhD Institute of Human Complexity and Systems Science, Yonsei University, 85 Songdogwahak-ro, Yeonsu-gu, Incheon 21983, Korea E-mail: son0603@yuhs.ac
Copyright © 2018 The Korean Society for Preventive Medicine
This is an Open Access article distributed under the terms of the Creative Commons Attribution Non-Commercial License (http://creativecommons.org/licenses/by-nc/4.0/) which permits unrestricted non-commercial use, distribution, and reproduction in any medium, provided the original work is properly cited.
ABSTRACT
-
Objectives
- A positive association between air pollution and both the incidence and prevalence of diabetes mellitus (DM) has been reported in some epidemiologic and animal studies, but little research has evaluated the relationship between air pollution and diabetic coma. Diabetic coma is an acute complication of DM caused by diabetic ketoacidosis or hyperosmolar hyperglycemic state, which is characterized by extreme hyperglycemia accompanied by coma. We conducted a time-series study with a generalized additive model using a distributed-lag non-linear model to assess the association between ambient air pollution (particulate matter less than 10 μm in aerodynamic diameter, nitrogen dioxide [NO2], sulfur dioxide, carbon monoxide, and ozone) and emergency department (ED) visits for DM with coma in Seoul, Korea from 2005 to 2009.
-
Methods
- The ED data and medical records from the 3 years previous to each diabetic coma event were obtained from the Health Insurance Review and Assessment Service to examine the relationship with air pollutants.
-
Results
- Overall, the adjusted relative risks (RRs) for an interquartile range (IQR) increment of NO2 was statistically significant at lag 1 (RR, 1.125; 95% confidence interval [CI], 1.039 to 1.219) in a single-lag model and both lag 0-1 (RR, 1.120; 95% CI, 1.028 to 1.219) and lag 0-3 (RR, 1.092; 95% CI, 1.005 to 1.186) in a cumulative-lag model. In a subgroup analysis, significant positive RRs were found for females for per-IQR increments of NO2 at cumulative lag 0-3 (RR, 1.149; 95% CI, 1.022 to 1.291).
-
Conclusions
- The results of our study suggest that ambient air pollution, specifically NO2, is associated with ED visits for diabetic coma.
- The effects of air pollution on health have been actively studied, and its associations with the development and aggravation of cardiovascular disease, respiratory disease, and cerebrovascular disease have been explored through many studies. According to a World Health Organization report, diabetes mellitus (DM) has reached global epidemic status, and the worldwide prevalence of DM is estimated at about 8.5% (422 million). Fifteen million people die each year due to DM, which is the eighth most common cause of death. In spite of the great concern about the health effects of air pollution and the high disease burden of DM, few studies have investigated the impact of air pollution on metabolic disease, and furthermore, the results have been inconsistent among those studies that have been performed [1].
- A large-scale cohort study conducted in Europe [2] showed that both nitrogen dioxide (NO2) and ozone (O3) were significantly associated with the incidence and prevalence of DM. Another study [3] also suggested that air pollution appears to increase the risk of acute complications of DM that lead to hospitalization.
- Many experimental studies have shown that possible pathways mediating the effects of air pollution on DM may include endothelial dysfunction, exaggerated sympathetic nervous system response, changes in the immune response in visceral adipose tissue, alterations in mitochondria and brown adipocytes, and endoplasmic reticulum stress resulting in dysregulation of insulin signaling, insulin sensitivity, and glucose metabolism [4]. Because some of these pathways are significantly associated with exposure to air pollutants, it is possible that high exposure to air pollutants might increase the incidence of DM. One of the most notable complications of DM is diabetic coma caused by diabetic ketoacidosis (DKA) [5] and hyperosmolar hyperglycemic state (HHS). These two serious acute complications represent an extreme hyperglycemic condition with coma, and if not treated properly, the mortality rate of this condition reaches 10-20% [6]. Diabetic coma can occur if the balance of fasting blood glucose—which is typically maintained by a combination of the patient’s usual diet, physical activity, and hypoglycemic drugs—is broken by changes in the external environment.
- Considering the inflammatory and oxidative responses after exposure to air pollutants, it is possible that among patients with DM, the incidence of diabetic coma might be associated with high exposure to air pollutants. However, few studies have addressed this issue. Thus, in this study, we investigated the association between ambient air pollution and the risk of emergency department (ED) visits for diabetic coma using national representative emergency care utilization data in the South Korea (hereafter Korea).
INTRODUCTION
- Study Population
- All subjects who visited an ED in Seoul, Korea from January 1, 2005, to December 31, 2009, were included in this study. The participants were enrolled based on health claims data obtained from the Health Insurance Review and Assessment Service (HIRA), which is part of the National Health Insurance (NHI) program of the Korea. Health claims data includes age, sex, diagnosis code (International Classification of Diseases, 10th Revision, ICD-10), and data about the hospital visit (ED, outpatient clinic, or admission), and regional code of the hospital.
- Diabetic coma was defined according to the ICD-10: E100, E110, E120, E130, and E140. E100 denotes type 1 DM with coma; E110, type 2 DM with coma; E120, malnutrition-related DM with coma; E130, other specified DM with coma; and E140, unspecified DM with coma. To identify pre-existing illnesses, we used the prior medical service utilization history of each subject. We defined pre-existing illness as a disease that had been reported on during at least 2 outpatient visits, or more than 1 hospitalization for the disease during the 3 years prior to the ED visit. The subjects were classified into 4 groups according to pre-existing illnesses: cardiovascular disease (hypertensive disease [ICD-10: I10, I11, I12, I13, I14, I15], ischemic heart disease [ICD-10: I20, I21, I22, I23, I24, I25]), chronic obstructive pulmonary diseases (COPD; ICD-10: J40, J41, J42, J43, J44), and asthma (ICD-10: J45, J46).
- The unit of analysis was daily ED visits for diabetic coma. All observations of ED visits for diabetic coma during the study period were included, allowing duplication of participants.
- Air Pollutants and Meteorological Data
- Particulate matter less than 10 μm in aerodynamic diameter (PM10), sulfur dioxide (SO2), NO2, O3, and carbon monoxide (CO) were considered to be ambient air pollutants in this study. This data was collected by the National Institute of Environmental Research under the Ministry of Environment of Korea from January 1, 2005, to December 31, 2009. Air pollutants were measured at 27 stations in Seoul, which were distributed to be representative of 25 districts in Seoul. The daily mean value was calculated using the hourly measured concentration of each air pollutant. For O3, the 8-hour average concentration was used. The methods of measurement were as follows: beta-ray absorption method (PM10, μg/m3), chemiluminescent method (NO2, parts per billion [ppb]), pulsed ultraviolet (UV) fluorescence method (SO2, ppb), UV photometric method (O3, ppb), and non-dispersive infrared method (CO, parts per million). The meteorological data including temperature (°C) and relative humidity (%) were obtained from the Korea Meteorological Administration.
- Study Design and Statistical Analysis
- To explore the association between daily ED visits for diabetic coma and short-term exposure to air pollution, we applied a time-series design that has been generalized to use distributed-lag non-linear models (DLNMs) [7]. We used a generalized additive model with quasi-Poisson regression because this model permits non-parametric adjustments to non-linear confounding effects of the season, trend, and weather variables in a time-series study of air pollution [8].
- A general model for illustrating the time series of outcomes (the number of ED visits for diabetic coma) is as below:
- Log [E(Y)]=α+cb1 ambient air pollution+cb2 (temperature, df=6)+β1 day of week+β2 holiday+s (relative humidity, df=3)+offset (log[population of the year])
- E(Y): estimated daily ED visits for diabetic coma
- s( ): the natural cubic spline for the non-linear variable
- cb1: cross-basis function illustrating the relationship of a 2-dimensional linear function model for air pollutants and for 3 strata for lags (lag 0-1, lag 2, lag 3)
- cb2: cross-basis function modelling the natural cubic spline function with 6 df per year for the mean temperature and for 2 strata for lags (lag 0-1, lag 2-3)
- df: the degree of freedom for the prediction space and the lag space
- α: the intercept
- β: the parameter vector that predicts the effect of environmental factors
- offset: correction of the number of events for an estimate of population size
- Daily average relative humidity was included as a natural cubic spline function with 3 degrees of freedom (df) per year to control for the potential non-linear confounding effects of weather conditions. The day of the week and public holidays were also added into the models as dummy variables to adjust for the effects of long-term trends.
- To evaluate the lag effect of air pollutants on diabetic coma prior to ED visits, DLNMs were used [7]. A DLNM is defined through a cross-basis function, which is composed of the basis function for the 2-dimensional exposure, as well as lag, and so allows the simultaneous estimation of a non-linear exposure-response association and delayed effects across lags. In this study, the exposure-response function of each air pollutant was assumed to be linear, and the lag structure was assumed to be constant within each stratum of the lag day, which is known as the lag-stratified distributed-lag model. We also included a cross-basis function of the daily mean temperature, modelling the relationship using a natural cubic spline with 6 df per year and the lag structure defined by 3 strata (lag 0-1, lag 2, lag 3). Because of the linear relationship of air pollutants, they are actually distributed-lag linear models, even if the distributed lag function of the temperature is included as a non-linear term [9]. The df for both relative humidity and daily mean temperature were determined empirically. In a sensitivity analysis, the direction of the relationship and the strength of the association did not change (Table S1).
- Final estimates are presented as the relative risks (RRs) (with 95% confidence intervals [CIs]) of daily visits for diabetic coma for an interquartile range (IQR) increment in each air pollutant. All analyses were performed with the R version 3.3.2 (https://cran.r-project.org/bin/windows/base/old/3.3.2/) using the mgcv and dlnm packages.
METHODS
- A total of 3532 cases of ED visits. for diabetic coma occurred during the study period. Of these, 3527 events were included in the study, after excluding 5 cases without information on the patient’s age and sex (Table 1). The average age of the study subjects was 57.66 (standard deviation [SD], 17.44); 50.7% were male. Table 2 summarizes the annual average concentration of air pollutants during the study.
- In both single- and cumulative-response models, the risk of ED visits for diabetic coma was significantly associated with NO2 concentration at single lag 1 (RR, 1.125; 95% CI, 1.039 to 1.219) and at cumulative lags 0-1 (RR, 1.120; 95% CI, 1.028 to 1.219) and lag 0-3 (RR, 1.092; 95% CI, 1.005 to 1.186) (Table 3).
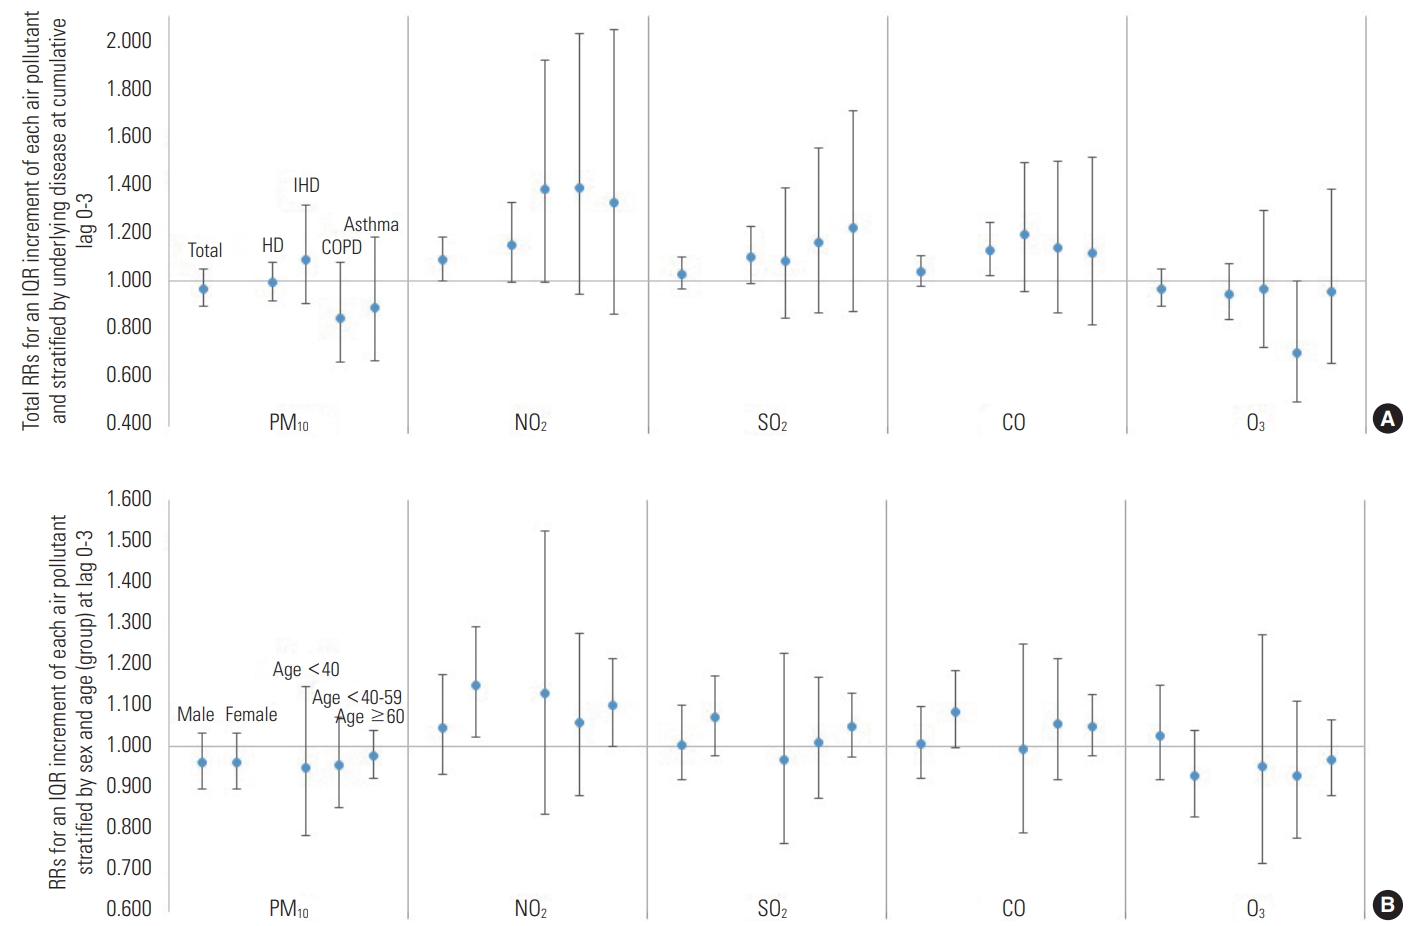
- For an IQR increase at lag 0-3, NO2 was positively associated with ED visits for diabetic coma (Figure 1). The RR for annual average NO2 was 1.092 (95% CI, 1.005 to 1.186) at lag 0-3. In the subgroup analysis by sex, the RR of NO2 for females at cumulative lag 0-3 (1.149; 95% CI, 1.022 to 1.291) was statistically significant (Figure 1). The RR of NO2 for males was not significant at cumulative lag 0-3, but was significant at single lag 1 (1.136; 95% CI, 1.015 to 1.271) (Table 4).
- In the subgroup analysis by age group, the RRs for NO2 were statistically significant in people aged 60 years or over at single lag 1 (RR, 1.108; 95% CI, 1.009 to 1.218) and cumulative lag 0-1 (RR, 1.112; 95% CI, 1.006 to 1.230) (Table 4).
- After stratifying the underlying diseases, for individuals with a history of hypertensive disease, a positive association was found for an IQR increment of NO2 at cumulative lag 0-2 (RR, 1.168; 95% CI, 1.014 to 1.346) and for CO (RR, 1.130; 95% CI, 1.026 to 1.243) at cumulative lag 0-3 (Figure 1 and Table 3). For individuals without any history of hypertensive disease, ischemic heart disease, asthma, or COPD, the RR for NO2 was 1.164 (95% CI, 1.039 to 1.305) at single lag 1 and 1.145 (95% CI, 1.014 to 1.293) at cumulative lag 0-1.
- In the seasonal analysis, the association was sustained in sp-ring at cumulative lag 0-2 (RR, 1.174; 95% CI, 1.001 to 1.377) and in autumn at single lag 1 (RR, 1.231; 95% CI, 1.029 to 1.473) and cumulative lag 0-2 (RR, 1.201; 95% CI, 1.020 to 1.414) and lag 0-3 (RR, 1.190; 95% CI, 1.015 to 1.395) (Figure 1 and Table S2).
RESULTS
- In our study, IQR increases in the concentration of NO2 were positively associated with ED visits for diabetic coma. The association was statistically significant at single lag 1 and cumulative lags 0-1 and 0-3. Other pollutants were partially associated with ED visits for diabetic coma, but not sustained for all lags. For example, the RR for CO at lag 1 was 1.106 (95% CI, 1.026 to 1.194), and at cumulative lag 0-1 it was 1.085 (95% CI, 1.011 to 1.166). However, this relationship was not found at other lags.
- We found some suggestive effect modifiers. In females and those aged over 60, the RR at cumulative lag 0-3 was higher than the total average RR. Comorbid hypertensive disease, ischemic heart disease, COPD, or asthma was not associated with increased ED visits for diabetic coma.
- This finding was consistent with previous studies. There have been relatively few studies that have investigated the association between the acute effects of air pollution and diabetic coma compared with the number of epidemiologic studies of the relationship between air pollution and the prevalence or incidence of DM. A time-series study was done in Chile in 2012 [3] to investigate the relationship between daily air pollution concentration and daily hospitalizations of patients with DM for coma and ketoacidosis. There was a positive association, and the RR for an IQR (27.95) increment of NO2 was 1.12 (1.05, 1.20) (IQR, 27.94). These results were consistent with the findings of our study.
- In a study conducted to evaluate the relationship between chemical components of air pollution and emergency hospital admissions for type 2 DM [10], short-term exposure to PM10 components such as nitrate and elemental carbon increased the risk of acute complications or exacerbation of symptoms of DM. Considering that the nitrate radical has been observed as a result of the flash photolysis of NO2 [11], this finding is compatible with the results of our study.
- In a series of studies, the effects of air pollution on the prevalence or incidence of DM have shown relatively consistent results. In a large cohort study involving 51 818 subjects followed for 9.7 years that was performed in Denmark [12], mean NO2 levels were statistically significantly associated with confirmed cases of DM (RR, 1.04; 95% CI,1.00 to 1.08). A meta-analysis [13] including 10 studies assessed the effect of air pollutants on the occurrence of diabetes. The overall effect on DM incidence was significant for NO2 (adjusted hazard ratio, 1.13; 95% CI, 1.01 to 1.22).
- Given that DM is a disease characterized by elevated blood glucose levels, the impact of air pollution on DM can be quantified by serum glucose increments. A longitudinal study that included 131 882 subjects [14] revealed that serum glucose increased among subjects with normal glucose. Impaired fasting glucose and DM were associated with a 6.36-ppb increase of NO2 at lag 1, 2, and 3 (0.40% [0.31, 0.50], 0.56% [0.40, 0.71], and 1.08% [0.86, 1.29], respectively).
- Insulin resistance mediated by air pollution has been hypothesized as the underlying physiological mechanism of the relationship between air pollution and acute DM [15]. In a cross-sectional study [16], a 1-ppb increment in the annual average of particulate matter less than 2.5 μm aerodynamic diameter (PM2.5), elevated fasting glucose of 0.07 mmol/L (p=0.005) and insulin resistance assessed by the homeostatic model increased by 4.58. But was borderline significant (p=0.07).
- In our study, being female was a suggestive effect modifier for the association between air pollutants and diabetic coma. Several studies have reported a stronger effect in females than males [12,17-19]. In pooled analysis [4] of these studies, the RR for males was 1.04 (95% CI, 0.93 to 1.17), which was not statistically significant, whereas the RR for females was 1.14 (95% CI, 1.03 to 1.26). There are some hypotheses that may explain this effect. One possible explanation is, of course, that females are more susceptible to air pollution. The other possibility is exposure measurement error. Males in the Korea tend to engage in more physical activity and more often commute or engage in other activities far from home than female do. Exposure to air pollutant is calculated based on residence address, so long commute and frequent activities might cause an exposure measurement error. There are some possible explanations for the seasonal interaction, including the diurnal temperature range, which is an important meteorological variable related to climate change and urbanization. A previous study showed that a greater diurnal temperature range is related to an increase in non-traumatic, cardiovascular, and cardiorespiratory mortality [20].
- The mechanism for the relationship between exposure to air pollution and DM is not known, but hypotheses include an inflammatory response or oxidative stress response [21]. There is evidence that exposure to PM2.5 appears to be strongly associated with systemic inflammatory markers including white cell count [22], interleukin-6 (IL-6), fibrinogen [23], and C-reactive protein [18]. An air pollution-induced inflammatory response in the lungs mediates alterations to autonomic balance, and this may exacerbate systemic insulin resistance via overactivity of the sympathetic nervous system [24,25]. Endothelial dysfunction also plays a role in disruption of glucose homeostasis [26] via insulin resistance. Co-exposure to multiple air pollutants (SO2, NO2, and PM2.5) caused endothelial dysfunction by elevating endothelin-1 expression [27] and repressing the endothelial nitric oxide synthase level, as well as stimulating the inflammatory response by increasing the levels of cyclooxygenase 2, inducible nitric oxide synthase, tumor necrosis factor-a, and IL-6.
- These relationships can explain the long-term effects of air pollution on the development of DM, but they cannot fully explain the complications caused by acute exacerbation of DM. Another explanation is the effect of counter-regulatory hormones. The most important mechanism in the development of diabetic coma due to DKA or HHS is hyperglycemia, and the osmotic diuretic effect caused by hyperglycemia exacerbates hyperosmolar hyperglycemia itself [28]. In this mechanism, insulin and glucagon, the two hormones that regulate serum glucose, play a key role. Absolute or relative insulin deficiency, glucagon oversecretion, and insulin-antagonistic counter-regulatory hormones such as catecholamine [29] and cortisol all contribute to the development of diabetic coma. Secretion of catecholamine by the activated autonomic system can induce hyperglycemia in susceptible individuals with predisposing factors [30].
- The predisposing or precipitating factors for DKA and HHS are inadequate insulin treatment or non-compliance, as well as acute illnesses which induce relative insulin deficiency including infection, cerebrovascular accident, myocardial infarction, and endocrine disorders. In our study, old age was suggested as a possible effect modifier. Old age [31] and low socioeconomic status [32] interfere with regular health screenings and periodic insulin dose adjustments. This may contribute to diabetic coma due to increased serum glucose caused by air pollution in individuals who already had unrecognized hyperglycemia.
- The present study has several strengths. First, to the best of our knowledge, this is the first study to establish a correlation between air pollution and diabetic coma in Korea. Second, by using the HIRA database, almost the entire population of Seoul, Korea was included. The HIRA database includes all residents of the Korea because the NHI covers the whole population as a compulsory social insurance system and HIRA uses the national claim database of the NHI for quality assessment.
- Third, we applied an advanced statistical approach: distributed non-linear lag models that flexibly account for the delayed and non-linear effects of air pollutants and temperature and provide simultaneous estimates of the lag-specific risks and cumulative effect.
- Nevertheless, our study has some potential limitations. First, considering that DKA is characteristically associated with type 1 DM [33], whereas HHS most commonly develops with type 2 DM, it could be more appropriate to analyze type 1 DM with coma (E10.0) and type 2 DM with coma (E11.0) separately. However, even though DKA is more common in younger patients with type 1 DM, it can also occur with type 2 DM. DKA and HHS are part of a spectrum, representing the metabolic consequences of insulin deficiency, glucagon excess, and counter-regulatory hormonal responses to stressful triggers in patients with DM [34].
- Second, we used the average concentrations of 27 monitoring sites in Seoul rather than personal measures for air pollution exposures because we were not able to obtain data on individual exposure to air pollutants. However, this measurement error may bias our results toward the null, underestimating the RRs [35].
- Third, potential confounding from individual-level risk factors for diabetic coma, including inadequate application of treatments such as oral hypoglycemic drugs or insulin, as well as poor dietary patterns, lack of physical activity, and poor medical compliance, could not be fully excluded due to the inherent characteristics of an ecological study. Nevertheless, the time-series design we applied in this study assesses the short-term effect of air pollutants and its unit of analysis is time. Thus, the temporal nature of a time-series design can avoid some concerns about personal confounders that do not change over short durations of time [36].
- In this study, exposure to ambient air pollutants was correlated with ED visits for diabetic coma especially in females and those 60 and older. These findings may help establish specific recommendations or guidelines for high-risk individuals by identifying susceptible populations to air pollution.
DISCUSSION
-
CONFLICT OF INTEREST
The authors have no conflicts of interest associated with the material presented in this paper.
Notes
SUPPLEMENTAL MATERIALS
| Underlying disease |
Lag |
||||||
|---|---|---|---|---|---|---|---|
| 0 | 1 | 2 | 3 | 0-1 | 0-2 | 0-3 | |
| Total | |||||||
| PM10 | 0.998 (0.961, 1.037) | 1.016 (0.975, 1.059) | 0.973 (0.928, 1.020) | 0.976 (0.936, 1.019) | 1.014 (0.972, 1.059) | 0.987 (0.938, 1.038) | 0.963 (0.916, 1.014) |
| NO2 | 0.995 (0.923, 1.073) | 1.125 (1.039, 1.219) | 0.975 (0.901, 1.055) | 1.000 (0.933, 1.072) | 1.120 (1.028, 1.219) | 1.092 (0.998, 1.194) | 1.092 (1.005, 1.186) |
| SO2 | 1.026 (0.959, 1.098) | 1.015 (0.941, 1.095) | 0.992 (0.920, 1.069) | 1.000 (0.940, 1.064) | 1.042 (0.972, 1.117) | 1.033 (0.961, 1.111) | 1.033 (0.969, 1.101) |
| CO | 0.981 (0.919, 1.048) | 1.106 (1.026, 1.194) | 0.957 (0.887, 1.033) | 1.003 (0.942, 1.068) | 1.085 (1.011, 1.166) | 1.039 (0.966, 1.116) | 1.042 (0.980, 1.108) |
| O3 | 1.009 (0.932, 1.092) | 0.963 (0.886, 1.047) | 1.001 (0.922, 1.087) | 1.005 (0.931, 1.084) | 0.972 (0.889, 1.063) | 0.973 (0.887, 1.068) | 0.978 (0.902, 1.060) |
| Without past history1 | |||||||
| PM10 | 1.002 (0.952, 1.055) | 0.990 (0.927, 1.057) | 0.960 (0.892, 1.033) | 0.961 (0.902, 1.024) | 0.992 (0.929, 1.059) | 0.952 (0.884, 1.026) | 0.915 (0.850, 0.986) |
| NO2 | 0.983 (0.883, 1.095) | 1.164 (1.039, 1.305) | 0.894 (0.799, 1.000) | 1.038 (0.941, 1.145) | 1.145 (1.014, 1.293) | 1.023 (0.901, 1.161) | 1.062 (0.944, 1.195) |
| SO2 | 1.047 (0.951, 1.153) | 0.964 (0.864, 1.076) | 0.971 (0.870, 1.083) | 0.981 (0.897, 1.073) | 1.010 (0.913, 1.116) | 0.980 (0.882, 1.089) | 0.962 (0.876, 1.055) |
| CO | 0.982 (0.893, 1.080) | 1.086 (0.973, 1.211) | 0.912 (0.817, 1.018) | 0.996 (0.911, 1.089) | 1.067 (0.962, 1.182) | 0.973 (0.876, 1.080) | 0.969 (0.886, 1.059) |
| O3 | 1.022 (0.914, 1.143) | 0.967 (0.860, 1.088) | 1.066 (0.949, 1.198) | 0.919 (0.824, 1.024) | 0.988 (0.870, 1.121) | 1.054 (0.924, 1.201) | 0.968 (0.863, 1.085) |
| Hypertensive disease | |||||||
| PM10 | 0.987 (0.927, 1.051) | 1.026 (0.968, 1.087) | 0.988 (0.927, 1.053) | 0.996 (0.940, 1.056) | 1.013 (0.951, 1.078) | 1.000 (0.926, 1.081) | 0.997 (0.918, 1.082) |
| NO2 | 1.010 (0.907, 1.126) | 1.074 (0.948, 1.218) | 1.076 (0.952, 1.216) | 0.983 (0.887, 1.091) | 1.086 (0.957, 1.232) | 1.168 (1.014, 1.346) | 1.149 (0.996, 1.325) |
| SO2 | 1.004 (0.912, 1.106) | 1.049 (0.937, 1.176) | 1.015 (0.907, 1.137) | 1.032 (0.941, 1.132) | 1.054 (0.952, 1.167) | 1.070 (0.957, 1.197) | 1.104 (0.992, 1.229) |
| CO | 0.985 (0.897, 1.080) | 1.118 (0.996, 1.255) | 1.008 (0.899, 1.131) | 1.018 (0.929, 1.115) | 1.101 (0.995, 1.218) | 1.110 (0.997, 1.236) | 1.130 (1.026, 1.243) |
| O3 | 0.968 (0.859, 1.090) | 0.958 (0.842, 1.090) | 0.944 (0.830, 1.072) | 1.086 (0.969, 1.219) | 0.927 (0.810, 1.060) | 0.875 (0.758, 1.009) | 0.950 (0.841, 1.074) |
| Ischemic heart disease | |||||||
| PM10 | 1.058 (0.948, 1.181) | 1.088 (0.993, 1.191) | 1.031 (0.915, 1.161) | 0.921 (0.782, 1.084) | 1.151 (1.035, 1.279) | 1.186 (1.022, 1.377) | 1.092 (0.907, 1.315) |
| NO2 | 1.027 (0.796, 1.325) | 1.296 (0.962, 1.747) | 1.031 (0.769, 1.384) | 1.006 (0.785, 1.289) | 1.332 (0.992, 1.788) | 1.374 (0.990, 1.906) | 1.382 (0.997, 1.915) |
| SO2 | 0.860 (0.686, 1.079) | 1.459 (1.137, 1.873) | 0.961 (0.737, 1.253) | 0.860 (0.686, 1.079) | 1.256 (1.003, 1.571) | 1.206 (0.934, 1.557) | 1.084 (0.847, 1.387) |
| CO | 0.977 (0.786, 1.213) | 1.372 (1.045, 1.803) | 0.914 (0.693, 1.207) | 0.976 (0.784, 1.216) | 1.340 (1.060, 1.694) | 1.226 (0.953, 1.576) | 1.197 (0.960, 1.492) |
| O3 | 1.287 (0.980, 1.689) | 0.813 (0.599, 1.102) | 0.936 (0.695, 1.261) | 0.992 (0.758, 1.298) | 1.046 (0.766, 1.427) | 0.979 (0.703, 1.364) | 0.971 (0.727, 1.296) |
| COPD | |||||||
| PM10 | 0.994 (0.861, 1.146) | 0.993 (0.832, 1.185) | 0.933 (0.751, 1.160) | 0.924 (0.759, 1.125) | 0.986 (0.824, 1.181) | 0.920 (0.732, 1.156) | 0.850 (0.668, 1.081) |
| NO2 | 1.385 (1.031, 1.862) | 0.915 (0.651, 1.286) | 1.088 (0.784, 1.509) | 1.006 (0.761, 1.329) | 1.268 (0.910, 1.766) | 1.379 (0.949, 2.002) | 1.387 (0.950, 2.025) |
| SO2 | 1.113 (0.864, 1.435) | 0.966 (0.710, 1.315) | 0.940 (0.689, 1.282) | 1.149 (0.899, 1.468) | 1.076 (0.817, 1.416) | 1.011 (0.746, 1.371) | 1.162 (0.870, 1.551) |
| CO | 1.153 (0.892, 1.489) | 0.891 (0.648, 1.226) | 1.075 (0.786, 1.471) | 1.034 (0.802, 1.334) | 1.028 (0.779, 1.356) | 1.105 (0.821, 1.487) | 1.143 (0.871, 1.498) |
| O3 | 0.671 (0.479, 0.939) | 1.132 (0.799, 1.604) | 0.837 (0.591, 1.184) | 1.113 (0.811, 1.526) | 0.760 (0.524, 1.102) | 0.636 (0.426, 0.948) | 0.707 (0.500, 1.000) |
| Asthma | |||||||
| PM10 | 0.864 (0.677, 1.103) | 1.162 (1.004, 1.345) | 0.909 (0.723, 1.144) | 0.977 (0.789, 1.211) | 1.004 (0.829, 1.217) | 0.913 (0.689, 1.211) | 0.893 (0.672, 1.186) |
| NO2 | 1.146 (0.817, 1.607) | 1.096 (0.741, 1.622) | 0.866 (0.595, 1.259) | 1.222 (0.892, 1.674) | 1.256 (0.854, 1.846) | 1.087 (0.710, 1.666) | 1.329 (0.864, 2.044) |
| SO2 | 1.110 (0.823, 1.496) | 0.986 (0.687, 1.414) | 0.916 (0.636, 1.318) | 1.221 (0.920, 1.620) | 1.094 (0.793, 1.508) | 1.001 (0.702, 1.429) | 1.222 (0.877, 1.705) |
| CO | 0.912 (0.676, 1.232) | 1.235 (0.857, 1.781) | 0.852 (0.591, 1.228) | 1.163 (0.874, 1.546) | 1.127 (0.817, 1.555) | 0.960 (0.680, 1.355) | 1.116 (0.823, 1.515) |
| O3 | 1.042 (0.725, 1.498) | 0.886 (0.595, 1.318) | 1.195 (0.811, 1.762) | 0.868 (0.606, 1.243) | 0.923 (0.614, 1.386) | 1.103 (0.719, 1.694) | 0.958 (0.663, 1.383) |
RR, relative risk; CI, confidence interval; IQR, interquartile range; PM10, particulate matter less than 10 μm in aerodynamic diameter; NO2, nitrogen dioxide; SO2, sulfur dioxide; CO, carbon monoxide; O3, ozone; COPD, chronic obstructive pulmonary disease.
1 Past history includes hypertensive disease, ischemic heart disease, COPD, and asthma.
- 1. Alderete TL, Chen Z, Toledo-Corral CM, Contreras ZA, Kim JS, Habre R, et al. Ambient and traffic-related air pollution exposures as novel risk factors for metabolic dysfunction and type 2 diabetes. Curr Epidemiol Rep 2018;5(2):79-91ArticlePubMedPMCPDF
- 2. Renzi M, Cerza F, Gariazzo C, Agabiti N, Cascini S, Di Domenicantonio R, et al. Air pollution and occurrence of type 2 diabetes in a large cohort study. Environ Int 2018;112: 68-76ArticlePubMed
- 3. Dales RE, Cakmak S, Vidal CB, Rubio MA. Air pollution and hospitalization for acute complications of diabetes in Chile. Environ Int 2012;46: 1-5ArticlePubMed
- 4. Eze IC, Hemkens LG, Bucher HC, Hoffmann B, Schindler C, Künzli N, et al. Association between ambient air pollution and diabetes mellitus in Europe and North America: systematic review and meta-analysis. Environ Health Perspect 2015;123(5):381-389ArticlePubMedPMC
- 5. Misra S, Oliver NS. Diabetic ketoacidosis in adults. BMJ 2015;351: h5660ArticlePubMed
- 6. Pasquel FJ, Umpierrez GE. Hyperosmolar hyperglycemic state: a historic review of the clinical presentation, diagnosis, and treatment. Diabetes Care 2014;37(11):3124-3131ArticlePubMedPMC
- 7. Gasparrini A, Armstrong B, Kenward MG. Distributed lag non-linear models. Stat Med 2010;29(21):2224-2234ArticlePubMedPMC
- 8. Hastie T, Tibshirani R. Generalized additive models for medical research. Stat Methods Med Res 1995;4(3):187-196ArticlePubMed
- 9. Gasparrini A. Distributed lag linear and non-linear models in R: the package dlnm. J Stat Softw 2011;43(8):1-20
- 10. Sun S, Qiu H, Ho KF, Tian L. Chemical components of respirable particulate matter associated with emergency hospital admissions for type 2 diabetes mellitus in Hong Kong. Environ Int 2016;97: 93-99ArticlePubMed
- 11. Husain D, Norrish RG. The production of NO3 in the photolysis of nitrogen dioxide and of nitric acid vapour under isothermal conditions. Proc R Soc Lond A Math Phys Sci 1963;273(1353):165-179Article
- 12. Andersen ZJ, Raaschou-Nielsen O, Ketzel M, Jensen SS, Hvidberg M, Loft S, et al. Diabetes incidence and long-term exposure to air pollution: a cohort study. Diabetes Care 2012;35(1):92-98ArticlePubMed
- 13. Balti EV, Echouffo-Tcheugui JB, Yako YY, Kengne AP. Air pollution and risk of type 2 diabetes mellitus: a systematic review and meta-analysis. Diabetes Res Clin Pract 2014;106(2):161-172ArticlePubMed
- 14. Sade MY, Kloog I, Liberty IF, Katra I, Novack L, Novack V. Air pollution and serum glucose levels: a population-based study. Medicine (Baltimore) 2015;94(27):e1093ArticlePubMedPMC
- 15. Liu C, Ying Z, Harkema J, Sun Q, Rajagopalan S. Epidemiological and experimental links between air pollution and type 2 diabetes. Toxicol Pathol 2013;41(2):361-373ArticlePubMed
- 16. Chen Z, Salam MT, Toledo-Corral C, Watanabe RM, Xiang AH, Buchanan TA, et al. Ambient air pollutants have adverse effects on insulin and glucose homeostasis in Mexican Americans. Diabetes Care 2016;39(4):547-554ArticlePubMedPMC
- 17. Dijkema MB, Mallant SF, Gehring U, van den Hurk K, Alssema M, van Strien RT, et al. Long-term exposure to traffic-related air pollution and type 2 diabetes prevalence in a cross-sectional screening-study in the Netherlands. Environ Health 2011;10: 76ArticlePubMedPMCPDF
- 18. Brook RD, Jerrett M, Brook JR, Bard RL, Finkelstein MM. The relationship between diabetes mellitus and traffic-related air pollution. J Occup Environ Med 2008;50(1):32-38ArticlePubMed
- 19. Krämer U, Herder C, Sugiri D, Strassburger K, Schikowski T, Ranft U, et al. Traffic-related air pollution and incident type 2 diabetes: results from the SALIA cohort study. Environ Health Perspect 2010;118(9):1273-1279ArticlePubMedPMC
- 20. Lim YH, Hong YC, Kim H. Effects of diurnal temperature range on cardiovascular and respiratory hospital admissions in Korea. Sci Total Environ 2012;417-418: 55-60ArticlePubMed
- 21. Rajagopalan S, Brook RD. Air pollution and type 2 diabetes: mechanistic insights. Diabetes 2012;61(12):3037-3045ArticlePubMedPMC
- 22. Sullivan JH, Hubbard R, Liu SL, Shepherd K, Trenga CA, Koenig JQ, et al. A community study of the effect of particulate matter on blood measures of inflammation and thrombosis in an elderly population. Environ Health 2007;6: 3ArticlePubMedPMCPDF
- 23. Rückerl R, Phipps RP, Schneider A, Frampton M, Cyrys J, Oberdörster G, et al. Ultrafine particles and platelet activation in patients with coronary heart disease-results from a prospective panel study. Part Fibre Toxicol 2007;4: 1ArticlePubMedPMC
- 24. Simon SA, Liedtke W. How irritating: the role of TRPA1 in sensing cigarette smoke and aerogenic oxidants in the airways. J Clin Invest 2008;118(7):2383-2386ArticlePubMedPMC
- 25. Snow SJ, Henriquez AR, Costa DL, Kodavanti UP. Neuroendocrine regulation of air pollution health effects: emerging insights. Toxicol Sci 2018;164(1):9-20ArticlePubMedPMCPDF
- 26. Prieto D, Contreras C, Sánchez A. Endothelial dysfunction, obesity and insulin resistance. Curr Vasc Pharmacol 2014;12(3):412-426ArticlePubMed
- 27. Zhang Y, Ji X, Ku T, Sang N. Inflammatory response and endothelial dysfunction in the hearts of mice co-exposed to SO2, NO2, and PM2.5. Environ Toxicol 2016;31(12):1996-2005ArticlePubMed
- 28. Umpierrez G, Korytkowski M. Diabetic emergencies - ketoacidosis, hyperglycaemic hyperosmolar state and hypoglycaemia. Nat Rev Endocrinol 2016;12(4):222-232ArticlePubMedPDF
- 29. Azam M, Gupta G, Baquer NZ. Modulation of insulin receptors and catecholamines in rat brain in hyperglycemia and hyperinsulinemia. Biochem Int 1990;22(1):1-9ArticlePubMed
- 30. Barth E, Albuszies G, Baumgart K, Matejovic M, Wachter U, Vogt J, et al. Glucose metabolism and catecholamines. Crit Care Med 2007;35(9 Suppl):S508-S518ArticlePubMed
- 31. Kesavadev JD, Short KR, Nair KS. Diabetes in old age: an emerging epidemic. J Assoc Physicians India 2003;51: 1083-1094PubMed
- 32. Rathmann W, Haastert B, Giani G, Koenig W, Imhof A, Herder C, et al. Is inflammation a causal chain between low socioeconomic status and type 2 diabetes? Results from the KORA Survey 2000. Eur J Epidemiol 2006;21(1):55-60ArticlePubMed
- 33. Unger RH, Orci L. Glucagon and the A cell: physiology and pathophysiology (first two parts). N Engl J Med 1981;304(25):1518-1524ArticlePubMed
- 34. Diamond MP, Hallarman L, Starick-Zych K, Jones TW, Connolly-Howard M, Tamborlane WV, et al. Suppression of counterregulatory hormone response to hypoglycemia by insulin per se. J Clin Endocrinol Metab 1991;72(6):1388-1390ArticlePubMedPDF
- 35. Zeger SL, Thomas D, Dominici F, Samet JM, Schwartz J, Dockery D, et al. Exposure measurement error in time-series studies of air pollution: concepts and consequences. Environ Health Perspect 2000;108(5):419-426ArticlePubMedPMC
- 36. Bell ML, Samet JM, Dominici F. Time-series studies of particulate matter. Annu Rev Public Health 2004;25: 247-280ArticlePubMed
REFERENCES
Figure & Data
References
Citations
- Criteria air pollutants and diabetes mortality classified by different subtypes and complications: A nationwide, case-crossover study
Peng Yin, Huihuan Luo, Ya Gao, Wei Liu, Su Shi, Xinyue Li, Xia Meng, Haidong Kan, Maigeng Zhou, Guanglin Li, Renjie Chen
Journal of Hazardous Materials.2023; 460: 132412. CrossRef - Comparison of different hybrid modeling methods to estimate intraurban NO2 concentrations
Inbo Oh, Mi-Kyoung Hwang, Jin-Hee Bang, Wonho Yang, Soontae Kim, Kiyoung Lee, SungChul Seo, Jiho Lee, Yangho Kim
Atmospheric Environment.2021; 244: 117907. CrossRef - Short-term effect of NO2 on outpatient visits for dermatologic diseases in Xinxiang, China: a time-series study
Ling Chao, Mengxue Lu, Zhen An, Juan Li, Yuchun Li, Qian Zhao, Yinbiao Wang, Yue Liu, Weidong Wu, Jie Song
Environmental Geochemistry and Health.2021; 43(9): 1. CrossRef - Assessing short-term effects of ambient air pollution on respiratory diseases in Guwahati, India with the application of the generalized additive model
Abhishek Dutta, Wanida Jinsart
Human and Ecological Risk Assessment: An International Journal.2021; 27(7): 1786. CrossRef - Does ozone inhalation cause adverse metabolic effects in humans? A systematic review
Judy S. LaKind, Carol J. Burns, Lynn H. Pottenger, Daniel Q. Naiman, Julie E. Goodman, Satori A. Marchitti
Critical Reviews in Toxicology.2021; 51(6): 467. CrossRef - Joint effect of heatwaves and air quality on emergency department attendances for vulnerable population in Perth, Western Australia, 2006 to 2015
Dimpalben Patel, Le Jian, Jianguo Xiao, Janis Jansz, Grace Yun, Andrew Robertson
Environmental Research.2019; 174: 80. CrossRef
 PubReader
 ePub Link
 Cite
Cite

