Articles
- Page Path
- HOME > J Prev Med Public Health > Volume 55(1); 2022 > Article
-
Review
A Review of the Types and Characteristics of Healthy Life Expectancy and Methodological Issues -
Young-Eun Kim1
 , Yoon-Sun Jung2, Minsu Ock3,4, Seok-Jun Yoon5
 -
Journal of Preventive Medicine and Public Health 2022;55(1):1-9.
DOI: https://doi.org/10.3961/jpmph.21.580
Published online: January 16, 2022
1Department of Big Data Strategy, National Health Insurance Service, Wonju, Korea
2Institute for Future Public Health, Graduate School of Public Health, Korea University, Seoul, Korea
3Department of Preventive Medicine, University of Ulsan College of Medicine, Ulsan, Korea
4Department of Preventive Medicine, Ulsan University Hospital, University of Ulsan College of Medicine, Ulsan, Korea
5Department of Preventive Medicine, Korea University College of Medicine, Seoul, Korea
- Corresponding author: Minsu Ock, Department of Preventive Medicine, Ulsan University Hospital, University of Ulsan College of Medicine, 877 Bangeojinsunhwando-ro, Dong-gu, Ulsan 44033, Korea E-mail: ohohoms@naver.com
- Co-corresponding author: Seok-Jun Yoon, Department of Preventive Medicine, Korea University College of Medicine, 73 Goryeodae-ro, Seongbuk-gu, Seoul 02841, Korea E-mail: yoonsj02@korea.ac.kr
Copyright © 2022 The Korean Society for Preventive Medicine
This is an Open Access article distributed under the terms of the Creative Commons Attribution Non-Commercial License (http://creativecommons.org/licenses/by-nc/4.0/) which permits unrestricted non-commercial use, distribution, and reproduction in any medium, provided the original work is properly cited.
ABSTRACT
- An index that evaluates the health level of a population group considering both death and loss of function due to disease is called a summary measure of population health (SMPH). SMPHs are broadly divided into life year indices and life expectancy indices, the latter of which comprise healthy life expectancy (HLE). HLE is included as a policy target in various national and regional level healthcare plans, and the term “HLE” is commonly used in academia and by the public. However, the overall level of understanding of HLE—such as the precise definition of HLE and methods of calculating HLE—still seems to be low. As discussed in this study, the types of HLE are classified into disability-free life expectancy, disease-free life expectancy, quality-adjusted life expectancy, self-rated HLE, and disability-adjusted life expectancy. Their characteristics are examined to facilitate a correct understanding and appropriate utilization of HLE. In addition, the Sullivan method, as a representative method for calculating HLE, is presented in detail, and major issues in the process of calculating HLE, such as selection of the population group and age group, estimation of death probability, calculation of life years, and incorporation of health weights, are reviewed. This study will help researchers to select an appropriate HLE type and evaluate the validity of HLE research results, and it is expected to contribute to the vitalization of HLE research.
- The health assessment of a given population group should consider not only the death rate, but also the incidence, prevalence, and consequent functional losses (or occurrence of disability) of various diseases. Thus, an index that evaluates the health level of a population group considering both death and loss of function due to disease is called a summary measure of population health (SMPH) [1]. SMPHs are useful for monitoring the changes in the health level of population groups and quantifying levels of inequality [2]. They may also be applied to compare the health levels of international population groups or evaluate the effects of a policy or intervention [3].
- SMPHs are broadly divided into life year indices and life expectancy indices. The former category includes disability-adjusted life-years (DALYs) and quality-adjusted life-years (QALYs), while the latter includes disability-free life expectancy, disease-free life expectancy, disability-adjusted life expectancy (DALE) or health-adjusted life expectancy (HALE), and quality-adjusted life expectancy (QALE), which are collectively referred to as the healthy life expectancy (HLE). HLE is reflected in the policy goals of various national and regional public healthcare plans. For example, the Health Plan 2030 in Korea aimed to increase the HLE by 2.9 years, from 70.4 years in 2018 to 73.3 years in 2030 [4].
- HLE is the life expectancy including disease-related disability or dysfunction and decreased health-related quality of life (QoL). Hence, HLE not only expresses how long an individual is likely to live, but also how healthy that individual’s life might be. Compared to DALY and QALY, an advantage of HLE is that it can be easily understood by both the public and policymakers. Furthermore, the goals of HLE can be readily implemented on a quantitative level; thus, the utility of HLE has gradually increased. Nevertheless, the overall understanding of the precise definition of HLE and the methods used to estimate HLE still seems to be low compared to the extent to which the term “HLE” is used in academia and by the public. In addition, the various types of HLE are used without proper distinction, leading to misunderstanding and confusion.
- For HLE to function appropriately as a policy goal, it must be accurately understood. Thus, this study reviews the various types of HLE and their characteristics and discusses issues in the methodology of HLE estimation through examples. Hence, a theoretical review of HLE may facilitate accurate estimations of HLE and promote a better understanding of HLE estimations and the utility of HLE in policy development.
INTRODUCTION
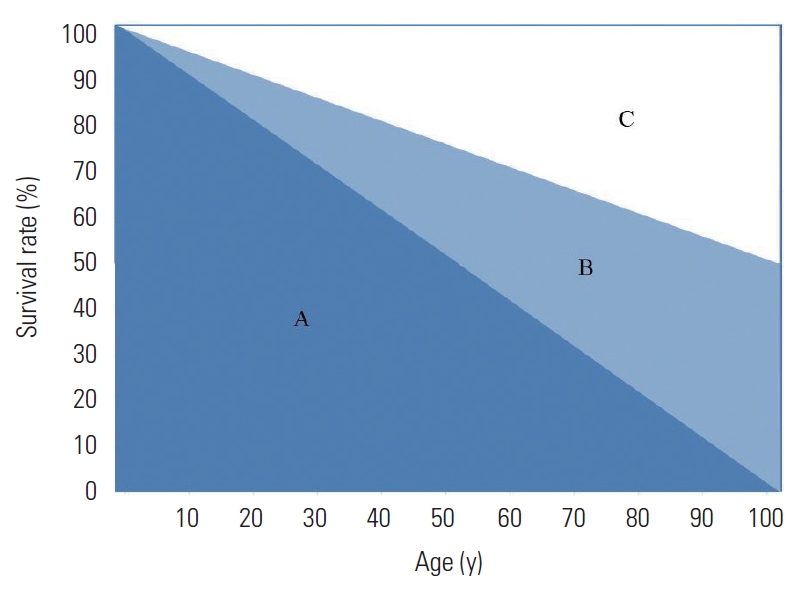
- HLE has several types, which differ in the precise definition and estimation method used to assess the level of health or dysfunction. Figure 1 shows a hypothetical case that depicts the rate of survival by age for a certain population group; however, only half the population survives to the age of 100 years. Here, the life expectancy is obtained by dividing the sum of the areas of the survival rate by the population size (i.e., dividing the sum of the areas of A and B by 100 000 persons). If the level of dysfunction corresponds to the area of B in this population group, then the HLE is estimated by dividing A by 100 000 persons. Thus, different types of HLE exist depending on the method used to quantify the weight of the level of dysfunction (B). The types and characteristics of HLE are reviewed further in the following sections.
- Disability-free Life Expectancy
- Disability-free life expectancy is a type of HLE that reflects the presence or absence of a disability. The weight of the level of dysfunction is classified as 0 (absence of disability) or 1 (presence of disability), wherein a disability is handled in the same manner as death. As the health level is assessed based on the presence or absence of a disability, an advantage is that it can be calculated even with insufficient data sources; thus, many early HLE studies used disability-free life expectancy [5,6]. However, as this type of HLE assesses the level of health on a binary scale of disability, it is not sensitive to differences in the health levels of a population group. It is also difficult to test the presence or absence of a disability, which is generally done using a measure of activity limitations [7]. It is therefore important for studies applying disability-free life expectancy to clearly define disability.
- Disease-free Life Expectancy
- Disease-free life expectancy is a type of HLE that reflects the level of reduced health caused by diseases, such as cancer, cardiovascular disease, and dementia, which have a high mortality rate and are highly prevalent. The advantage of this type of HLE is that the influence of a specific disease can be expressed in a readily understandable form, which can increase the level of interest from the perspective of public health. As with disability-free life expectancy, disease-free life expectancy was utilized in early HLE studies [8,9], and the scope of research has recently extended to the estimation of the effect sizes of interventions aiming to improve the disease-free life expectancy [10]. However, similar to disability-free life expectancy, the level of health is assessed based on the presence or absence of a disease alone, which may lead to an overestimation of the disease-related burden. Although it is possible to estimate disease-free life expectancy in a way that simultaneously considers various diseases [11], there are limitations to the inclusive estimation of HLE within a population group.
- Quality-adjusted Life Expectancy
- QALE is a type of HLE that incorporates health-related QoL into health expectancy. Based on the definition of health-related QoL and its method of estimation, QALE may be further specified. Health-related QoL can comprehensively reflect the multiple dimensions of health [12]. In general, among the subcategories of physical, psychological, and social dimensions, those suitable for a given population group are combined within an instrument to evaluate the health-related QoL. The result of this evaluation is converted to an index expressed as a single quantitative value, which is used to estimate HLE [13]. Hence, this index acts as a utility weight representing the level of health-related QoL.
- QALE can be estimated when data are available to estimate the life expectancy and there are responses to a health-related QoL instrument that can be converted to an index. For example, several previous studies have attempted to estimate QALE using index values obtained from representative health-related QoL instruments, such as the EuroQoL 5-Dimension (EQ-5D) and Short Form Six Dimensions [14,15]. However, QALE inevitably shares the limitations of the instruments used to measure health-related QoL. An inherent feature of health-related QoL measurement is that the state of health is assessed by the respondent; thus, the result is often unreliable for children and illiterate or mentally challenged individuals, who find it difficult to properly assess their health-related QoL. Therefore, in the estimation of QALE, estimated values are substituted for the health-related QoL of these participants who have difficulty responding appropriately. For example, the health-related QoL of a child is presumed to be based solely on a healthy state, for which a weight of 1 is given [16]. Due to this methodological limitation, interpretations of QALE should consider the potential of overestimation.
- Nevertheless, QALE is advantageous for certain population groups, as it can be more comprehensively assessed than disability-free or disease-free life expectancy. In addition, this type of HLE is unambiguous if data on health-related QoL are available, enabling relatively easy comparisons of HLE among different population groups or monitoring of changes in the annual trends of HLE. Another notable advantage of QALE is that the HLE of small-scale regions can be easily estimated on a level similar to that for districts, cities, or provinces.
- Self-rated Healthy Life Expectancy
- Self-rated HLE is a broader form of QALE, since the HLE estimation is based on self-rated health as a way of measuring health-related QoL. Self-rated health is also referred to as self-reported health, self-assessed health, or perceived health and, despite slight differences in phrasing, it is generally defined as the collection of responses to the question “How do you rate your health?” on a 5-point scale (very good, good, moderate, bad, or very bad) [17]. Individuals who respond “bad” or “very bad” on self-rated health surveys are considered to have an “unhealthy” status, for which a health weight of 0 is assigned in the estimation of self-rated HLE [18]. Thus, self-rated HLE resembles QALE and disability-free life expectancy.
- Compared to health-related QoL, instruments measuring self-rated health involve a more subjective assessment of an individual’s state of health. While these instruments are frequently used to achieve a highly facilitated assessment of health, the results of which can be used to estimate HLE, caution is required as self-rated HLE has similar drawbacks to those of self-rated health. As with instruments used to measure health-related QoL, self-rated health cannot be measured in individuals with cognitive impairment. In addition, while self-rated health requires the respondents to comprehensively consider the physical and psychological aspects of their health, the substantial influence of external factors such as income level and race could lead to a measure of life expectancy that reflects overall and not specifically health-related QoL [19]. Thus, compared to other HLE types, self-rated health poses a risk of underestimation.
- Disability-adjusted Life Expectancy
- DALE is an HLE index that reflects disability measurements in terms of DALYs. The term “HALE” has recently been used to describe the same concept as DALE [20]. However, HALE may lead to a misguided perception that it is the only index of HLE. Therefore, to clearly differentiate this from other HLE indices, the term DALE appears more reasonable than HALE.
- DALYs are calculated using the sum of the years of life lost and the years lost due to disability (YLD), and YLD is regarded as the parameter that incorporates the level of disability in DALE [21]. Moreover, YLD is an expression of the summed levels of disabilities caused by various diseases in terms of years. The disability level for each disease is evaluated using disability weights, which are quantified for a specific health status or disease-related disability level on a scale between 0 (completely healthy, no disability) and 1 (disability equivalent to death) [22]. For example, in a study evaluating the disability weight of 289 causes of disease, the highest weight (0.906) was given to trachea, bronchus, and lung cancers (stage 4) and the lowest weight (0.049) to acne vulgaris. Thus, compared to disease-free and disability-free life expectancy, which rate the level of disability as 0 or 1, DALE allows HLE to be estimated with a more accurate consideration of disability levels.
- Furthermore, DALE also allows a more objective and nuanced evaluation of levels of disability than QALE or self-rated HLE. Notably, a survey of individuals including children in whom health-related QoL is difficult to assess found that DALE enabled a more valid reflection of disability levels. Thus, the use of DALE should be prioritized over other methods of HLE estimation, specifically for children and handicapped or vulnerable populations.
- Another significant advantage of DALE is that it can be estimated using DALYs to evaluate the priority of the disease burden [23]. Although HLE is a reliable index that represents the health of the overall population, interventions to improve HLE should be designed based on the individual measure of disease burden, which is expressed as DALYs. Hence, synergistic effects are anticipated from applying DALYs in setting priorities for public health policies or projects and DALE when setting goals for the health of the overall population.
HEALTHY LIFE EXPECTANCY: TYPES AND CHARACTERISTICS
- The most well-known method of HLE estimation is the Sullivan method, which is used by the World Health Organization and the Global Burden of Disease study [24]. In this method, the HLE is estimated based on the life expectancy calculated using a life table that incorporates weights for the levels of disability or dysfunction. The only requirement for this estimate is the availability of weight data on the level of disability or dysfunction by age and data on mortality (or death probability) by age. Table 1 shows an example of how the DALE is estimated. The following sections examine the methods of HLE estimation in detail and discuss the issues for each.
- Selection of Population and Age Groups
- The initial steps of HLE estimation are identical to those of life expectancy estimation. Table 1 describes an example of a simulated population group (E) with 100 000 persons at age 0, for which the age group (A) was determined. Instead of selecting a simulated population group, the age structure of an actual population group requiring HLE estimation could be used, in which the population size of the simulated group also remains flexible. If data are available with units of 1 year, a complete life table can also be used. In the given example, the age group was set to a unit of 5 years, and the group of 0-5 years was divided into 0 and 1-4 years (B). However, no group was set for those aged above 100 years.
- Estimation of Death Probability
- The death probability is a key data source for estimating the life expectancy and HLE. It is estimated using the death rate, which is calculated based on the number of population members and deaths in each age group. The methods that apply the death rate to estimate death probability by age vary according to the assumptions underlying the mortality and population distributions [25]. Well-known methods include the Chiang method, which assumes a linear increase in mortality in each age group; the Greville method, wherein the probability of death is calculated assuming a proportional relationship between age and the log-transformed death rate; and the Keyfitz method, which estimates the probability of death using the death rate by assuming that the age-dependent mortality distribution follows a quadratic function [25].
- Statistics Korea provides data on the probability of death alongside the mortality for each age group, which may be directly applied or, if mortality data are available, the probability of death can be estimated. However, there seems to be a lack of clear agreement on the most appropriate method to use for death probability, which may reflect unique patterns in each country. In Korea, the results of different methods of estimating the death probability did not vary significantly using a complete life table; however, the variation became more distinct when an abridged life table was used [25]. Thus, a life table with 1-year units (i.e., a complete life table) is preferable for the direct estimation of the probability of death to provide a more valid estimation of life expectancy or HLE.
- Once data on the probability of death have been collected for each age group (D), the mortality in each age group of a hypothetical population can be calculated (F). For example, if the death probability for an age of 0 is 0.00306, then the mortality in the respective age group would be 306, with 99,694 persons surviving to enter the age group of 1-4 years. Next, applying the death probability for the 1-4 years age group (0.00082), the mortality can be calculated, and so on until the last group (100+ years). For the 100+ years age group, it is assumed that the probability is 1.
- Estimation of Healthy Life Expectancy With Life-year Calculations
- Having estimated the mortality in each age group, life-years by age (G) is then calculated. For example, if 99 612 individuals survive up to 5-9 years of age and 64 deaths occur, then 99 548 individuals will survive to enter the age group of 10-14 years; thus, each of these 99 548 individuals is likely to have survived for 5 years. Although the precise time of death of the 64 individuals cannot be identified, assuming that the time is evenly distributed, the mean life-years of the 64 individuals can be estimated as 2.5 years. This can be expressed as “(99 612*5)+(64*5*0.5),” where the number of life-years is 497 902 for the 5-9 years age group.
- Here, the linearity adjustment (C), a concept for assuming the mortality distribution by age, is applied. It is set to 0.5 for most age groups to indicate an even distribution of mortality. However, as the probability for early deaths is higher in the age groups of 0 and 1-4 years, the linearity adjustments for these groups are set to 0.1 and 0.4, respectively. Using the estimated life-years in each age group, the cumulative life-years (H) can be calculated. For example, the cumulative life-years at the age of 0 is the sum of the life-years from 0 to 100+ years of age (7 850 753), while the cumulative life-years for the next age group (1-4 years) is the sum of the life-years from 1-4 years to 100+ years (7 751 028). Hence, the cumulative life-years for a given age group is the sum of the life-years from that age group to the following group. If the goal is to calculate only the life expectancy, then the cumulative life-years (H) can be divided by the population (E) for that age group. For example, the life expectancy for the 0-year age group is 78.5 years, which is obtained by dividing 7 850 753 by 100 000.
- Estimation of Healthy Life Expectancy Considering Health Weights
- The estimate of HLE uses life-years that reflect the health weights of the level of disability or dysfunction. Hence, the HLE calculation comprises the adjusted life-years (K) as the product of health weight (J) and life-years by age (G). Here, the health weight may vary according to the type of HLE. For instance, in the example of HLE with disability adjustment shown in Table 1, the YLD rate was used as the weight. In the case of QALE, the utility weight can be used instead of the YLD rate.
- The YLD rate is the difference between 1 and the per-person YLD obtained by dividing the sum of the YLD in each age group by the population of the target age group. The problem of comorbidities, which does not pose a significant problem in comparing the magnitude of disease burden, should be considered in the YLD rate calculation. Simply put, if the YLD rate does not consider comorbidities, the per-person YLD will be overestimated, leading to an underestimation of the HLE. Thus, the YLD in each age group must be adjusted by the reduced extent of YLD according to comorbidities, while the YLD rate used in DALE is the comorbidity-adjusted YLD rate.
- Next, the adjusted cumulative life-years (L) can be calculated using the adjusted life-years (K). Hence, as in the case of cumulative life-years (H), which serves as the denominator for life expectancy, the adjusted cumulative life-years in each age group can be calculated. The adjusted cumulative life-year at age 0 is the sum of the adjusted life-years from 0 to 100+years, which is 6 757 036. The HLE is obtained by dividing the adjusted cumulative life-years (L) by the population in the age group (E). For example, the HLE at age 0 is 67.6 years, which is obtained by dividing L (6 757 036) by E (100 000).
HEALTHY LIFE EXPECTANCY: ESTIMATION METHODS AND CURRENT ISSUES
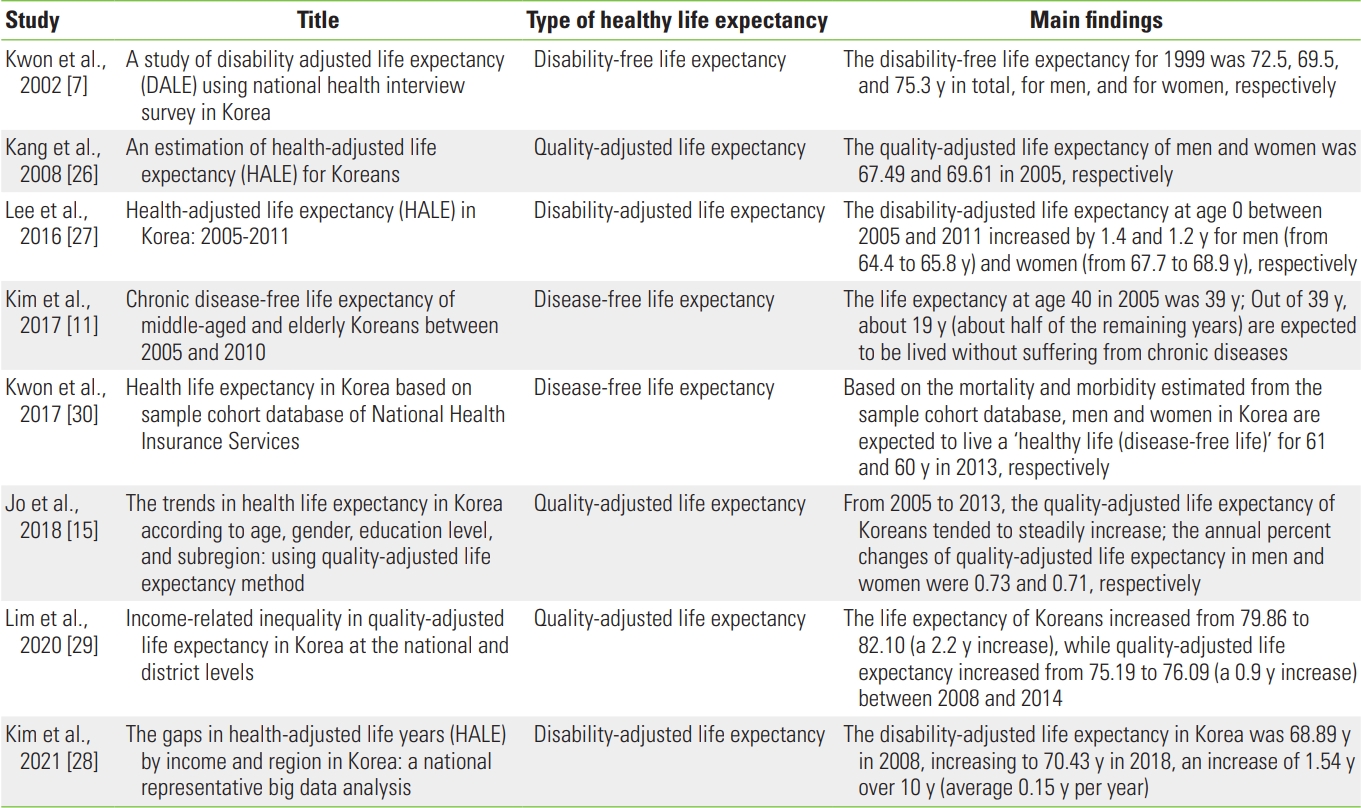
- Table 2 [7,11,15,26-30] summarizes the main findings of HLE studies conducted in Korea. Since the first HLE study by Kwon et al. [7], numerous studies have investigated various HLE types, indicating a steadily increasing scope of research.
- An examination of the methodological characteristics of the main HLE studies shows that several did not clearly establish the concept or methodology of HLE. One of the first studies presented results for the estimation of DALE [7], while the estimation method used appears to be for disability-free life expectancy. Although Kang et al. [26] claimed to have estimated the HALE, which is considered to be identical to the DALE, they instead estimated the QALE based on the EQ-5D of the Korea National Health and Nutrition and Examination Survey (KNHANES).
- More recent studies have shown a trend of using various HLE indices that comprehensively assess or reflect the level of disability or dysfunction, such as QALE or DALE. Furthermore, for the estimation of QALE or DALE, the scale of data was greater than in previous studies; thus, the validity of the estimated health weight can be predicted to be higher. For example, Lee et al. [27] obtained the YLD rate based on KNHANES data, while Kim et al. [28] used data provided by National Health Insurance to improve the validity of the finding. In addition, Lim et al. [29] used utility weights obtained using the EQ-5D of the Korean Community Health Survey, which features the largest sample size in the field of public health.
- Nonetheless, compared to the growing interest and expectations regarding HLE, the number of studies on HLE is rather small. Despite recent advances in HLE estimation methodologies, studies have only identified trends in HLE. Considering the advantages and disadvantages of each HLE type, the scope of disease-free life expectancy, which allows the influence of each disease to be analyzed, should include a greater number of diseases, while QALE and DALE should enable a more comprehensive assessment of the level of disability or dysfunction. Furthermore, as HLE has been recently applied in setting the goals of public health projects on both national and regional levels, more studies should investigate the estimation of HLE on regional and sub-regional levels, as well as HLE variation according to socio-demographic characteristics such as income and education. Moreover, factors related to HLE should be identified to provide supporting evidence for the development of policies and interventions to improve HLE.
CHARACTERISTICS AND FUTURE OF RESEARCH ON HEALTHY LIFE EXPECTANCY IN KOREA
- We reviewed various types of HLE and their characteristics in this study. Since each HLE type has advantages and disadvantages, it is important to select an appropriate HLE type in consideration of the purpose and application of HLE, as well as the availability of data sources. In addition, we provided an example of calculating HLE and discussed points to be noted in the process of calculating HLE. Recognizing the methodological issues of HLE calculation will be important for evaluating the validity of HLE study results. Contrary to the expectation that the academic interest in HLE and its utilization will increase, research on HLE in Korea is still lacking both quantitatively and qualitatively. Research using various HLE indices needs to be further conducted, and the scope of the research topics needs to be expanded, such as HLE research targeting sub-regional levels and vulnerable populations, as well as research that reveals factors related to HLE.
- Ethics Statement
- Ethical review and approval were waived for this study, because this study was not not involving humans or animals.
CONCLUSION
-
CONFLICT OF INTEREST
The authors have no conflicts of interest associated with the material presented in this paper.
-
FUNDING
This research was supported by a grant of the Korea Health Technology R&D Project through the Korea Health Industry Development Institute (KHIDI), funded by the Ministry of Health & Welfare, Republic of Korea (grant No. HI18C0446).
Notes
ACKNOWLEDGEMENTS
-
AUTHOR CONTRIBUTIONS
Conceptualization: Kim YE, Jung YS, Ock M, Yoon SJ. Data curation: Kim YE, Ock M. Funding acquisition: Yoon SJ. Methodology: Kim YE, Jung YS, Ock M, Yoon SJ. Project administration: Jung YS. Visualization: Ock M. Writing – original draft: Kim YE, Ock M. Writing – review & editing: Kim YE, Jung YS, Ock M, Yoon SJ.
Notes

| Study | Title | Type of healthy life expectancy | Main findings |
|---|---|---|---|
| Kwon et al., 2002 [7] | A study of disability adjusted life expectancy (DALE) using national health interview survey in Korea | Disability-free life expectancy | The disability-free life expectancy for 1999 was 72.5, 69.5, and 75.3 y in total, for men, and for women, respectively |
| Kang et al., 2008 [26] | An estimation of health-adjusted life expectancy (HALE) for Koreans | Quality-adjusted life expectancy | The quality-adjusted life expectancy of men and women was 67.49 and 69.61 in 2005, respectively |
| Lee et al., 2016 [27] | Health-adjusted life expectancy (HALE) in Korea: 2005-2011 | Disability-adjusted life expectancy | The disability-adjusted life expectancy at age 0 between 2005 and 2011 increased by 1.4 and 1.2 y for men (from 64.4 to 65.8 y) and women (from 67.7 to 68.9 y), respectively |
| Kim et al., 2017 [11] | Chronic disease-free life expectancy of middle-aged and elderly Koreans between 2005 and 2010 | Disease-free life expectancy | The life expectancy at age 40 in 2005 was 39 y; Out of 39 y, about 19 y (about half of the remaining years) are expected to be lived without suffering from chronic diseases |
| Kwon et al., 2017 [30] | Health life expectancy in Korea based on sample cohort database of National Health Insurance Services | Disease-free life expectancy | Based on the mortality and morbidity estimated from the sample cohort database, men and women in Korea are expected to live a ‘healthy life (disease-free life)’ for 61 and 60 y in 2013, respectively |
| Jo et al., 2018 [15] | The trends in health life expectancy in Korea according to age, gender, education level, and subregion: using quality-adjusted life expectancy method | Quality-adjusted life expectancy | From 2005 to 2013, the quality-adjusted life expectancy of Koreans tended to steadily increase; the annual percent changes of quality-adjusted life expectancy in men and women were 0.73 and 0.71, respectively |
| Lim et al., 2020 [29] | Income-related inequality in quality-adjusted life expectancy in Korea at the national and district levels | Quality-adjusted life expectancy | The life expectancy of Koreans increased from 79.86 to 82.10 (a 2.2 y increase), while quality-adjusted life expectancy increased from 75.19 to 76.09 (a 0.9 y increase) between 2008 and 2014 |
| Kim et al., 2021 [28] | The gaps in health-adjusted life years (HALE) by income and region in Korea: a national representative big data analysis | Disability-adjusted life expectancy | The disability-adjusted life expectancy in Korea was 68.89 y in 2008, increasing to 70.43 y in 2018, an increase of 1.54 y over 10 y (average 0.15 y per year) |
- 1. Field MJ, Gold MR. Summarizing population health: directions for the development and application of population metrics. Washington, DC: National Academy Press; 1998. p. 1-5
- 2. Mathers CD, Murray CJ, Ezzati M, Gakidou E, Salomon JA, Stein C. Population health metrics: crucial inputs to the development of evidence for health policy. Popul Health Metr 2003;1(1):6ArticlePubMedPMC
- 3. Murray CJ, Frenk J. Ranking 37th--measuring the performance of the U.S. health care system. N Engl J Med 2010;362(2):98-99ArticlePubMed
- 4. Oh Y. The National Health Plan 2030: its purpose and directions of development. J Prev Med Public Health 2021;54(3):173-181ArticlePubMedPMC
- 5. Murray CJ, Lopez AD. Regional patterns of disability-free life expectancy and disability-adjusted life expectancy: global burden of disease study. Lancet 1997;349(9062):1347-1352ArticlePubMed
- 6. Gutiérrez-Fisac JL, Gispert R, Solà J. Factors explaining the geographical differences in disability free life expectancy in Spain. J Epidemiol Community Health 2000;54(6):451-455ArticlePubMedPMC
- 7. Kwon YH, Lee JK, Do YK, Yoon SJ, Kim CY, Kim YI, et al. A study of disability-adjusted life expectancy (DALE) using the National Health Interview Survey in Korea. J Prev Med Public Health 2002;35(4):331-339. (Korean)
- 8. Perenboom RJ, Boshuizen HC, Breteler MM, Ott A, Van de Water HP. Dementia-free life expectancy (DemFLE) in the Netherlands. Soc Sci Med 1996;43(12):1703-1707ArticlePubMed
- 9. Franco OH, Steyerberg EW, Hu FB, Mackenbach J, Nusselder W. Associations of diabetes mellitus with total life expectancy and life expectancy with and without cardiovascular disease. Arch Intern Med 2007;167(11):1145-1151ArticlePubMed
- 10. Li Y, Schoufour J, Wang DD, Dhana K, Pan A, Liu X, et al. Healthy lifestyle and life expectancy free of cancer, cardiovascular disease, and type 2 diabetes: prospective cohort study. BMJ 2020;368: l6669ArticlePubMedPMC
- 11. Kim Y, Kim CS, Do YK. Chronic disease-free life expectancy of middle-aged and elderly Koreans between 2005 and 2010. Korea J Popul Stud 2017;40(2):57-77. (Korean)
- 12. Eberst RM. Defining health: a multidimensional model. J Sch Health 1984;54(3):99-104ArticlePubMed
- 13. Jo MW, Lee HJ, Kim SY, Kim SH, Chang H, Ahn J, et al. Development and validation of a novel generic health-related quality of life instrument with 20 items (HINT-20). J Prev Med Public Health 2017;50(1):38-59ArticlePubMedPMC
- 14. Gheorghe M, Wubulihasimu P, Peters F, Nusselder W, Van Baal PH. Health inequalities in the Netherlands: trends in quality-adjusted life expectancy (QALE) by educational level. Eur J Public Health 2016;26(5):794-799ArticlePubMed
- 15. Jo MW, Seo W, Lim SY, Ock M. The trends in health life expectancy in Korea according to age, gender, education level, and subregion: using quality-adjusted life expectancy method. J Korean Med Sci 2018;34(Suppl 1):e88ArticlePubMedPMC
- 16. Love-Koh J, Asaria M, Cookson R, Griffin S. The social distribution of health: estimating quality-adjusted life expectancy in England. Value Health 2015;18(5):655-662ArticlePubMed
- 17. Kim SH, Jo MW, Ock M, Lee SI. Exploratory study of dimensions of health-related quality of life in the general population of South Korea. J Prev Med Public Health 2017;50(6):361-368ArticlePubMedPMC
- 18. Liu Z, Zheng H, Wu Y, Wang S, Liu Y, Hu S. Self-rated healthy life expectancy changes in Jiangxi Province of China by gender and urban-rural differences, 2013-2018. Front Public Health 2021;8: 596249ArticlePubMedPMC
- 19. Shibuya K, Hashimoto H, Yano E. Individual income, income distribution, and self rated health in Japan: cross sectional analysis of nationally representative sample. BMJ 2002;324(7328):16-19ArticlePubMedPMC
- 20. GBD 2017 DALYs and HALE Collaborators. Global, regional, and national disability-adjusted life-years (DALYs) for 359 diseases and injuries and healthy life expectancy (HALE) for 195 countries and territories, 1990-2017: a systematic analysis for the Global Burden of Disease Study 2017. Lancet 2018;392(10159):1859-1922PubMedPMC
- 21. Yoon J, Oh IH, Seo H, Kim EJ, Gong YH, Ock M, et al. Disability-adjusted life years for 313 diseases and injuries: the 2012 Korean Burden of Disease Study. J Korean Med Sci 2016;31(Suppl 2):S146-S157ArticlePubMedPMC
- 22. Ock M, Ko S, Lee HJ, Jo MW. Review of issues for disability weight studies. Health Policy Manag 2016;26(4):352-358. (Korean)Article
- 23. Jung YS, Kim YE, Park H, Oh IH, Jo MW, Ock M, et al. Measuring the burden of disease in Korea, 2008-2018. J Prev Med Public Health 2021;54(5):293-300ArticlePubMedPMC
- 24. Sullivan DF. A single index of mortality and morbidity. HSMHA Health Rep 1971;86(4):347-354ArticlePubMedPMC
- 25. Park YS, Kim SY. A method for construction of life table in Korea. Korean J Appl Stat 2011;24(5):769-789. (Korean)Article
- 26. Kang EJ, Kim NY, Yoon SJ. An estimation of health-adjusted life expectancy (HALE) for Koreans. Health Policy Manag 2008;18(1):108-126. (Korean)Article
- 27. Lee JY, Ock M, Kim SH, Go DS, Kim HJ, Jo MW. Health-adjusted life expectancy (HALE) in Korea: 2005-2011. J Korean Med Sci 2016;31(Suppl 2):S139-S145ArticlePubMedPMC
- 28. Kim YE, Jung YS, Ock M, Park H, Kim KB, Go DS, et al. The gaps in health-adjusted life years (HALE) by income and region in Korea: a national representative bigdata analysis. Int J Environ Res Public Health 2021;18(7):3473ArticlePubMedPMC
- 29. Lim D, Bahk J, Ock M, Kim I, Kang HY, Kim YY, et al. Income-related inequality in quality-adjusted life expectancy in Korea at the national and district levels. Health Qual Life Outcomes 2020;18(1):45ArticlePubMedPMC
- 30. Kwon TY, Lim JY, Park Y. Health life expectancy in Korea based on sample cohort database of National Health Insurance Services. Korean J Appl Stat 2017;30(3):475-486. (Korean)Article
REFERENCES
Figure & Data
References
Citations
- Changing trends in health orientation among older adults: A scoping review
Kana Kazawa, Wakako Maeda‐Sawada, Eri Shizukuishi, Shota Hamada, Mia Kobayashi, Jiro Okochi, Shinya Ishii
Geriatrics & Gerontology International.2024; 24(1): 5. CrossRef - Trends in Healthy Life Expectancy (HALE) and Disparities by Income and Region in Korea (2008–2020): Analysis of a Nationwide Claims Database
Yoon-Sun Jung, Young-Eun Kim, Minsu Ock, Seok-Jun Yoon
Journal of Korean Medical Science.2024;[Epub] CrossRef - Opioid Prescription and Long-term Survival Outcomes in Adults: A Nationwide Cohort Study in Korea
Tak Kyu Oh, In-Ae Song
Journal of Korean Medical Science.2024;[Epub] CrossRef - Estimating quality-adjusted life expectancy (QALE) for local authorities in Great Britain and its association with indicators of the inclusive economy: a cross-sectional study
Andreas Höhn, Nik Lomax, Hugh Rice, Colin Angus, Alan Brennan, Denise Brown, Anne Cunningham, Corinna Elsenbroich, Ceri Hughes, Srinivasa Vittal Katikireddi, Gerry McCartney, Rosie Seaman, Aki Tsuchia, Petra Meier
BMJ Open.2024; 14(3): e076704. CrossRef - Trends of Gaps Between Health-Adjusted Life Expectancy and Life Expectancy at the Regional Level in Korea Using a Group-Based Multi-Trajectory Modeling Approach (2008–2019)
Chung-Nyun Kim, Yoon-Sun Jung, Young-Eun Kim, Minsu Ock, Dal-Lae Jin, Seok-Jun Yoon
Journal of Korean Medical Science.2024;[Epub] CrossRef - Estimating Disease-Free Life Expectancy Based on Clinical Data from the French Hospital Discharge Database
Oleksandr Sorochynskyi, Quentin Guibert, Frédéric Planchet, Michaël Schwarzinger
Risks.2024; 12(6): 92. CrossRef - Differences between subjective and disability health expectancies across ages in older adults
Antoine Gbessemehlan, Emmanuelle Cambois, Nicolas Brouard, Luc Letenneur, Hélène Amieva, Karine Pérès
Scientific Reports.2024;[Epub] CrossRef - Unruptured intracranial aneurysms in older adults: special considerations for treatment and management
Geun Hyuk Choi, Na Young Jeong, Jun Bum Park, Soon Chan Kwon, Jong Min Lee
Journal of Korean Society of Geriatric Neurosurgery.2024; 20(1): 4. CrossRef - Which chronic diseases contribute the most to healthy life years lost in Algeria?
Meryem Chinoune, Farid Flici
Chronic Illness.2024;[Epub] CrossRef - Sex/gender-related differences in inflammaging
Fabiola Olivieri, Francesca Marchegiani, Giulia Matacchione, Angelica Giuliani, Deborah Ramini, Francesca Fazioli, Jacopo Sabbatinelli, Massimiliano Bonafè
Mechanisms of Ageing and Development.2023; 211: 111792. CrossRef - Relevance Index Regional Variation by Each Disease and Its Essential Medical Field: A Retrospective Data Analysis From 2016-2020 in Korea
Young-Eun Kim, Jeehee Pyo, Haneul Lee, HyeRan Jeong, Young-Kwon Park, Jeong-Wook Seo, Minsu Ock, Seok-Jun Yoon
Journal of Korean Medical Science.2023;[Epub] CrossRef - Trends of healthy and unhealthy working life expectancy in Germany between 2001 and 2020 at ages 50 and 60: a question of educational level?
Stefanie Sperlich, Johannes Beller, Jelena Epping, Siegfried Geyer, Juliane Tetzlaff
Journal of Epidemiology and Community Health.2023; 77(7): 430. CrossRef - Updating Korean Disability Weights for Causes of Disease: Adopting an Add-on Study Method
Dasom Im, Noor Afif Mahmudah, Seok-Jun Yoon, Young-Eun Kim, Don-Hyung Lee, Yeon-hee Kim, Yoon-Sun Jung, Minsu Ock
Journal of Preventive Medicine and Public Health.2023; 56(4): 291. CrossRef - The socioeconomic distribution of life expectancy and healthy life expectancy in Chile
Manuel Antonio Espinoza, Rodrigo Severino, Carlos Balmaceda, Tomas Abbott, Baltica Cabieses
International Journal for Equity in Health.2023;[Epub] CrossRef - Comprehensive Measurement of the Burden of Disease due to Adverse Events: A New Analysis of the Cross-Sectional Patient Safety Incident Inquiry
Eun Young Choi, Juyoung Kim, Won Lee, Seung Gyeong Jang, Jeehee Pyo, Minsu Ock
Journal of Korean Medical Science.2023;[Epub] CrossRef - A Scoping Review of Tools and Techniques on Evaluating Population Health and Healthy Life Expectancy
Rui Zhang, Siyuan Wu, Qing Guo, Lizhu Jin, Xuejie Du, Shaoqiong Li, Yujie Meng, Songwang Wang, Xuemei Su, Jing Wu
China CDC Weekly.2023; 5(44): 991. CrossRef - The Primary Process and Key Concepts of Economic Evaluation in Healthcare
Younhee Kim, Yunjung Kim, Hyeon-Jeong Lee, Seulki Lee, Sun-Young Park, Sung-Hee Oh, Suhyun Jang, Taejin Lee, Jeonghoon Ahn, Sangjin Shin
Journal of Preventive Medicine and Public Health.2022; 55(5): 415. CrossRef
 PubReader
 ePub Link
 Cite
Cite