
Articles
- Page Path
- HOME > J Prev Med Public Health > Volume 56(4); 2023 > Article
-
Brief Report
Utilization of the Unlinked Case Proportion to Control COVID-19: A Focus on the Non-pharmaceutical Interventional Policies of the Korea and Japan -
Yeri Jeong1
 , Sanggu Kang1, Boeun Kim2, Yong Jin Gil1, Seung-sik Hwang1, Sung-il Cho3
 -
Journal of Preventive Medicine and Public Health 2023;56(4):377-383.
DOI: https://doi.org/10.3961/jpmph.23.056
Published online: June 21, 2023
- 2,605 Views
- 74 Download
1Department of Preventive Medicine, Graduate School of Public Health, Seoul National University, Seoul, Korea
2Graduate School of Public Health, Seoul National University, Seoul, Korea
3Department of Public Health Science, Graduate School of Public Health, Seoul National University, Seoul, Korea
- Corresponding author: Sung-il Cho, Department of Public Health Science, Graduate School of Public Health, Seoul National University, 1 Gwanak-ro, Gwanak-gu, Seoul 08826, Korea, E-mail: persontime@hotmail.com
Copyright © 2023 The Korean Society for Preventive Medicine
This is an Open Access article distributed under the terms of the Creative Commons Attribution Non-Commercial License (https://creativecommons.org/licenses/by-nc/4.0/) which permits unrestricted non-commercial use, distribution, and reproduction in any medium, provided the original work is properly cited.
ABSTRACT
-
Objectives
- Korea and Japan have managed the spread of coronavirus disease 2019 (COVID-19) using markedly different policies, referred to as the “3T” and “3C” strategies, respectively. This study examined these differences to assess the roles of active testing and contact tracing as non-pharmaceutical interventions (NPIs). We compared the proportion of unlinked cases (UCs) and test positivity rate (TPR) as indicators of tracing and testing capacities.
-
Methods
- We outlined the evolution of NPI policies and investigated temporal trends in their correlations with UCs, confirmed cases, and TPR prior to the Omicron peak. Spearman correlation coefficients were reported between the proportion of UCs, confirmed cases, and TPR. The Fisher r-to-z transformation was employed to examine the significance of differences between correlation coefficients.
-
Results
- The proportion of UCs was significantly correlated with confirmed cases (r=0.995, p<0.001) and TPR (r=0.659, p<0.001) in Korea and with confirmed cases (r=0.437, p<0.001) and TPR (r=0.429, p<0.001) in Japan. The Fisher r-to-z test revealed significant differences in correlation coefficients between the proportion of UCs and confirmed cases (z=16.07, p<0.001) and between the proportion of UCs and TPR (z=2.12, p=0.034) in Korea and Japan.
-
Conclusions
- Higher UCs were associated with increases in confirmed cases and TPR, indicating the importance of combining testing and contact tracing in controlling COVID-19. The implementation of stricter policies led to stronger correlations between these indicators. The proportion of UCs and TPR effectively indicated the effectiveness of NPIs. If the proportion of UCs shows an upward trend, more testing and contact tracing may be required.
- Non-pharmaceutical interventions (NPIs) are key elements of coronavirus disease 2019 (COVID-19) response policies [1]. Strategies for controlling COVID-19 depend on NPIs, particularly on a combination of social distancing, diagnostic testing, contact tracing, and isolation measures [2]. Most countries have employed social distancing as a fundamental measure, with variations in the types and intensities of interventions [1]. Moreover, testing strategies are contingent upon the capacity and policy stance of each nation [3].
- When formulating a sophisticated national policy, it is essential to understand the effectiveness of each NPI under specific circumstances and varying infection intensities [4]. In particular, the Western and Eastern social contexts and attitudes toward government policies differ [5]. Analyzing the effectiveness of NPIs in East Asia will assist Asian nations in shaping policies aimed at addressing new infectious diseases.
- Korea and Japan are similar in terms of public compliance and collectivist attitudes, and the nations developed similar COVID-19 response policies [6]. The Japanese NPIs were referred to as the “3 Cs” (avoidance of closed spaces, crowded places, and close-contact settings) [7]; similarly, social distancing was also the principal Korean countermeasure. In terms of tracing and testing, Japan adopted a cluster-based approach grounded in epidemiological investigations. Cases with the potential to create clusters were selected, followed by limited testing [7,8]. In contrast, Korea favored a “3 Ts” strategy, which emphasized widespread testing, contact tracing, and rigorous treatment [9].
- Thus, a careful examination of different testing and tracing strategies, as well as the progression of the pandemic, in these broadly similar countries that have both embraced basic social distancing policies would be insightful. Of various possible indicators, we focused on unlinked cases (UCs), for which the sources of infection were unknown [10,11]. A few previous studies have noted the distribution of UCs since the early COVID-19 pandemic in both Korea [12,13] and Japan [14]. However, the policy implications of UCs have not been adequately investigated.
- The purpose of the current study was to examine the policy responses of Korea and Japan and assess the role of active testing and contact tracing within NPIs. We utilized the proportion of UCs and test positivity rate (TPR) as indicators representing tracing and testing capacities, respectively. By comparing the proportion of UCs and TPR between the countries, we sought to clarify how these indicators highlight differences in their response strategies.
INTRODUCTION
- We obtained the number of daily confirmed cases per 1 million, the number of daily tests per 1000, and daily TPRs from Our World in Data [15]. The weekly proportions of UCs for Korea and Japan were based on data from the Korea Disease Control and Prevention Agency (KDCA) [16] and the Japanese Ministry of Health, Labor, and Welfare (MHLW) [17], respectively. Data were gathered from May 30, 2020, to January 9, 2022 for both nations.
- First, we outlined the NPI policies implemented in the 2 countries over time. Next, we examined the temporal trends in confirmed cases, UCs, testing capacities, and TPRs from the beginning of the COVID-19 pandemic to just before the Omicron peak. A linked case was defined as one that was epidemiologically connected to a known confirmed case or contact, or in which the individual had been in the same setting at the same time as the case or contact [11,12]. In contrast, UCs lack such a linkage. The KDCA supplied data on the weekly proportions of UCs from May 2020 to mid-January 2022, while the Japanese MHLW data covered the period from April 2020 to September 2022.
- We calculated Spearman correlation coefficients (r-values) between the weekly proportion of UCs and confirmed cases, as well as between the proportion of UCs and TPR. To assess the significance of the difference between correlation coefficients, we employed the Fisher r-to-z transformation, which is a method of transforming correlation coefficients (r-values) into z scores to determine whether a significant difference exists between 2 correlation coefficients [18]. We performed statistical analyses using R version 4.1.3 (R Foundation for Statistical Computing, Vienna, Austria). The Fisher r-to-z transformation was conducted using the DescTools package ( https://cran.rproject.org/web/packages/DescTools/DescTools.pdf ).
- Ethics Statement
- The study does not necessitate ethical approval and consent forms since the data is publicly available and there was no human participant.
METHODS
- Table 1 demonstrates that this strategy was also used in Korea, with social distancing measures enforced starting in March 2020. The primary features of the NPI policies of the 2 countries are displayed in Table 1.
- The KDCA implemented a stepwise approach to social distancing, which reflected the scale of the pandemic (Supplemental Material 1A and C). Japan declared a state of emergency (SE) on April 7, 2020, and additional SEs were subsequently declared as the pandemic progressed, based on recommendations from MHLW experts (Supplemental Material 1B and C). Information on the evolution of NPI policies and social distancing measures in both countries can be found in the Supplemental Material 1.
- Pandemic Progression in Korea and Japan
- Figure 1A shows the weekly number of confirmed cases per million, the number of UCs per million, and TPRs for Korea and Japan from May 2020 to January 2022. The pandemic in Korea was divided into 4 phases: May 30, 2020 to August 11, 2020 (the first phase, involving cases from overseas and the Daegu/Gyeongbuk regional outbreak); August 12, 2020 to November 12, 2020 (the second phase, marked by metropolitan spread); November 13, 2020 to July 6, 2021 (the third phase, characterized by national spread); and the Delta variant spread after July 7, 2021 (the fourth phase) [16].
- Weekly confirmed cases per million increased over time, with the highest number of confirmed cases reaching 113.71 during the fourth period, when the Delta variant was at its peak. The number of weekly tests per 1000 individuals gradually increased, peaking at 4.94 during the fourth period (Figure 1C). Korea’s testing capacity effectively managed the rise in confirmed cases, with TPRs of less than 1.00%, 0.89–2.90%, 0.59–2.98%, and 1.20–2.66% in periods 1 to 4, respectively. The TPR never exceeded 3.00%. The proportions of UCs in periods 1 to 4 were as follows: less than 1.00%, 0.16–1.18%, 0.47–5.47%, and 7.40–48.80%, respectively (Figure 1A).
- We examined 5 waves of the Japanese pandemic, including the second wave (from June 1 to October 30, 2020), the third wave (from November 1 to March 31, 2021), the fourth wave (from April 1 to June 30, 2021), the fifth wave (from July 1 to October 30, 2021), and the sixth wave (from November 1, 2021 to March 6, 2022) [17].
- The weekly confirmed cases peaked at 180.63 during the fifth period; the incidence increased markedly from August to September 2021, when the Tokyo Olympics and the Delta epidemic period coincided, but decreased rapidly starting in October 2021. Then, as the Omicron variant began to spread, the number of confirmed cases increased again. The maximum number of weekly tests per 1000 individuals reached 1.03 during the sixth wave in Japan (Figure 1C). The TPRs were higher than those observed in Korea. Specifically, the TPRs ranged from 1.02–7.00% in the second wave, 2.18–10.88% in the third wave, 2.60–8.37% in the fourth wave, 0.28–19.12% in the fifth wave, and 0.22–10.83% in the sixth wave. The proportion of UCs ranged from 37.0–54.3% in the second wave, 38.7–55.6% in the third wave, 46.5–53.1% in the fourth wave, 47.0–59.9% in the fifth wave, and 42.9–62.7% in the sixth wave (Figure 1B).
- Correlations Between Outcomes
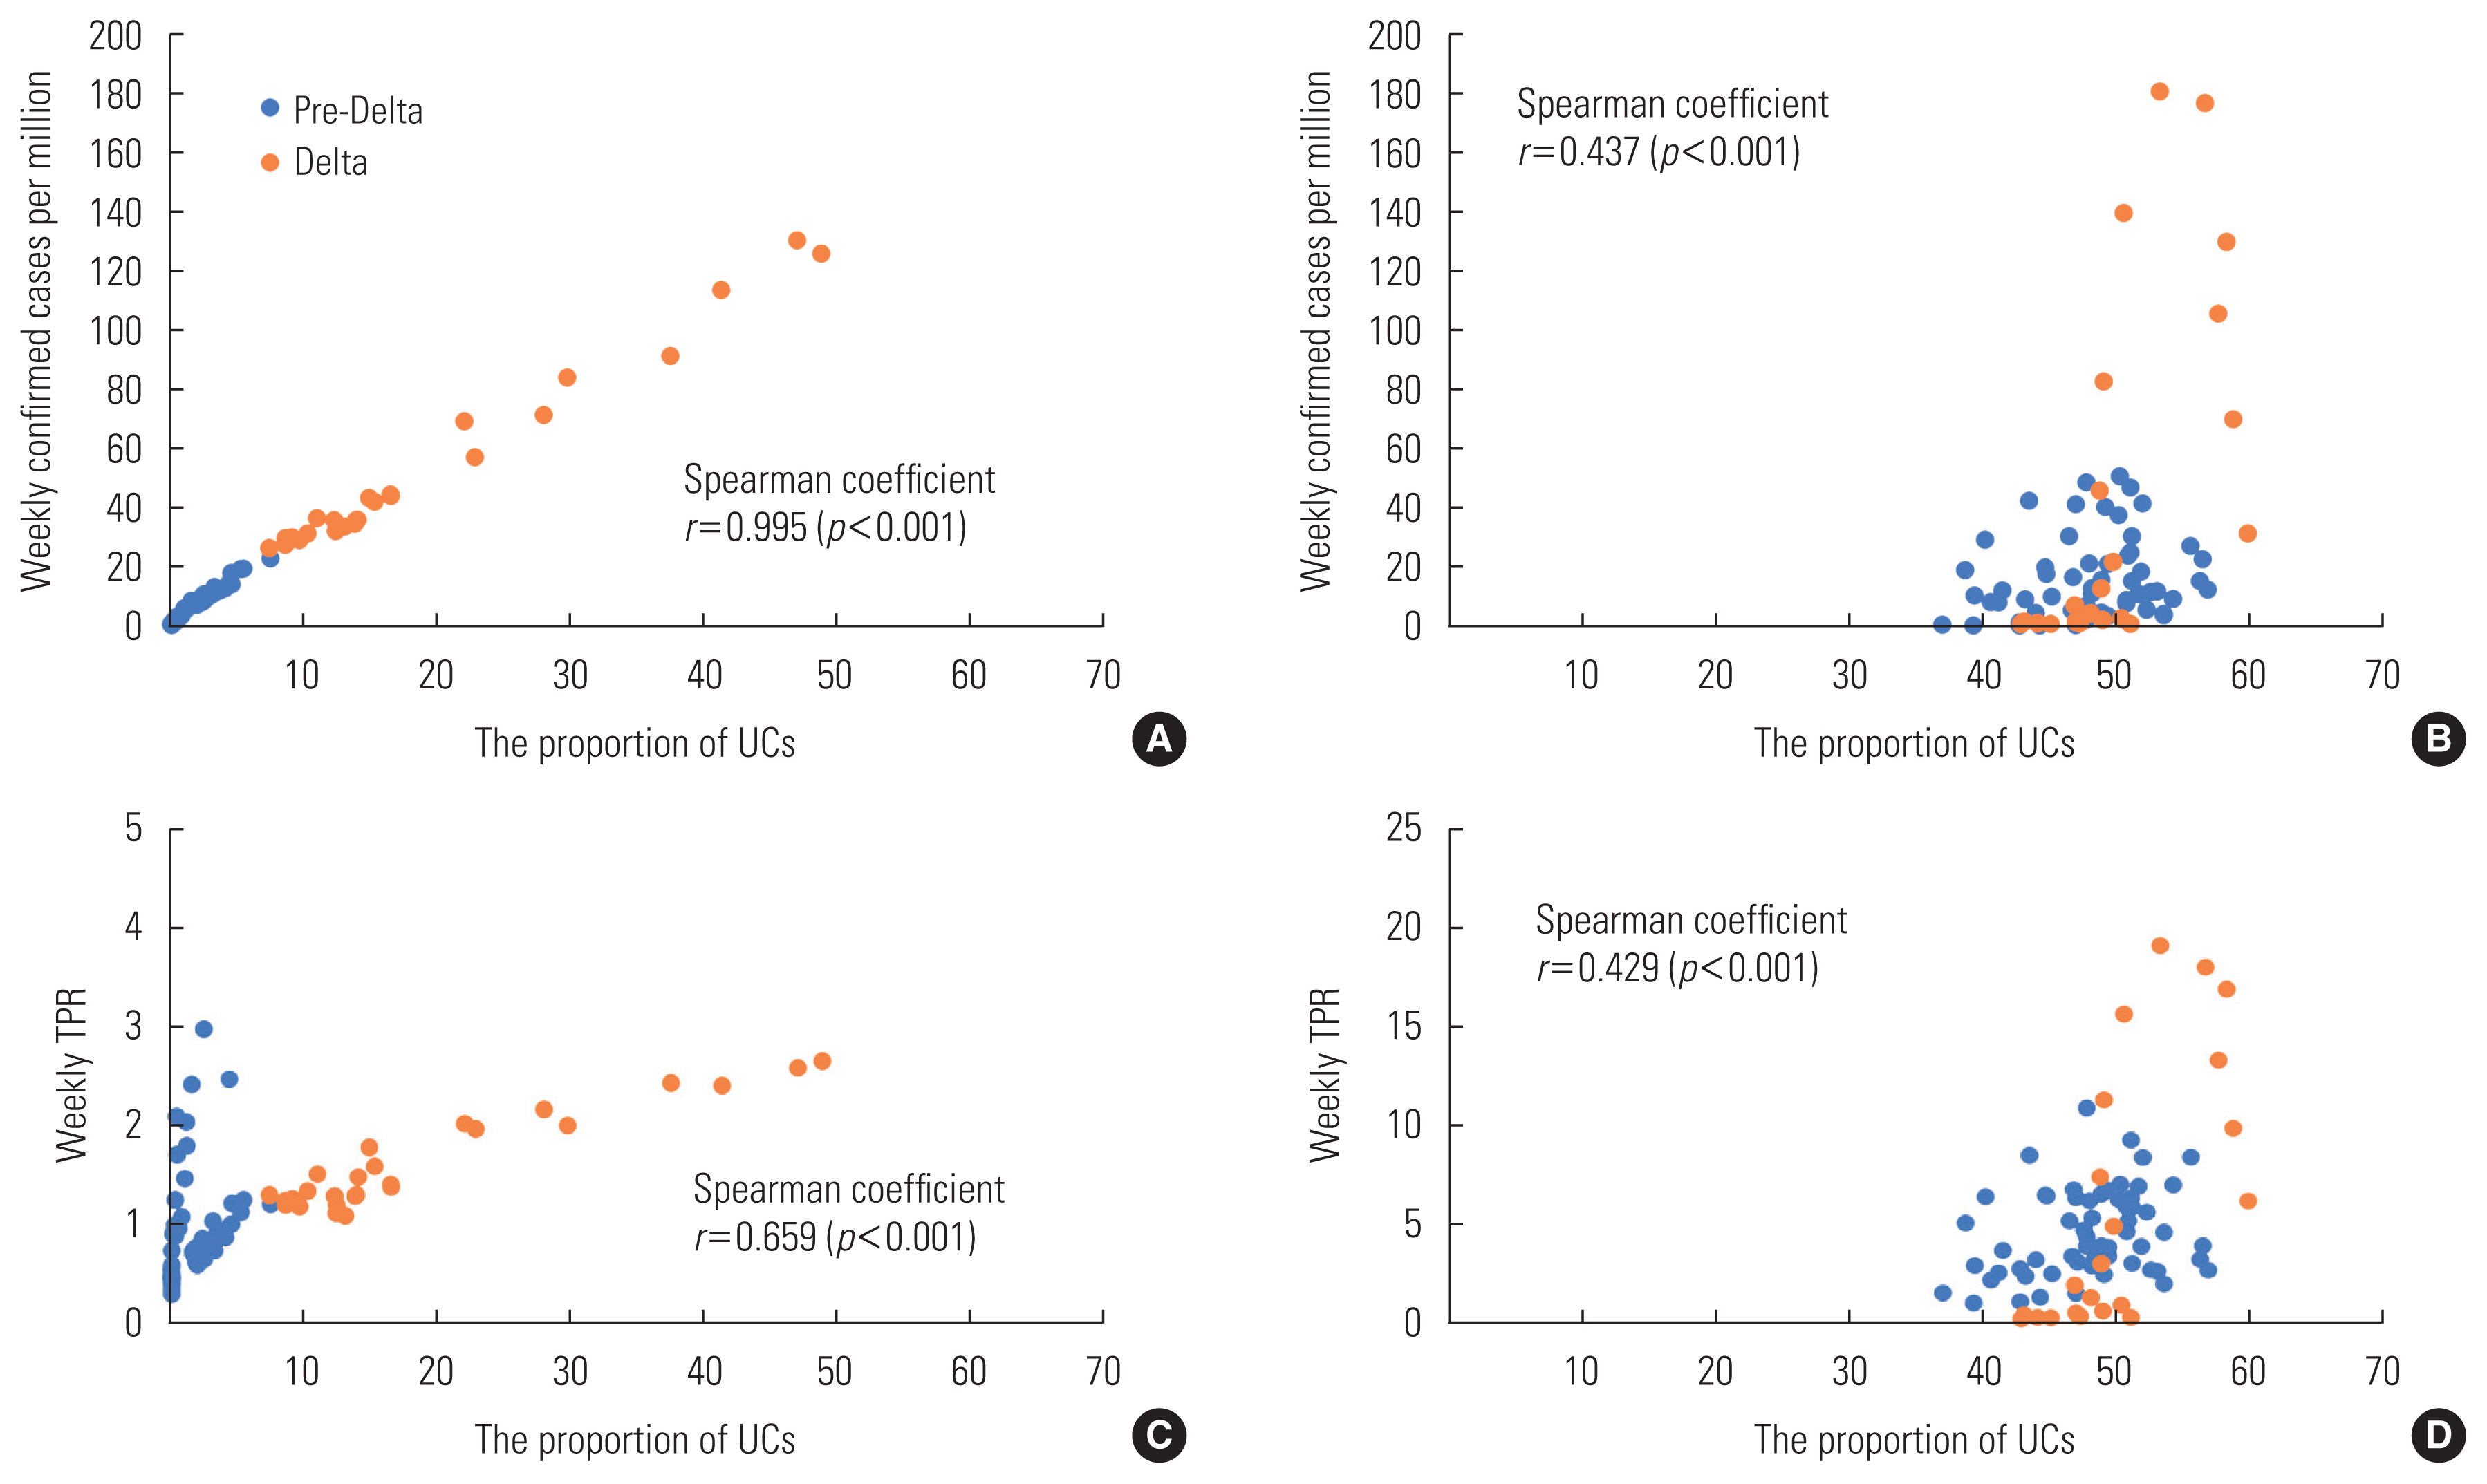
- The proportion of UCs was correlated with both confirmed case numbers (r=0.995, p<0.001) (Figure 2A) and the TPR (r=0.659, p<0.001) (Figure 2C) in Korea. Similarly, in Japan, the proportion of UCs was correlated with confirmed case numbers (r=0.437, p<0.001) (Figure 2B) and the TPR (r=0.429, p<0.001) (Figure 2D). The figures clearly illustrate distinct differences in the proportion of UCs between the pre-Delta and Delta periods in Korea, while in Japan, there is mostly overlap. The effective implementation of a comprehensive tracing and testing approach in Korea may have had maximal impact during the pre-Delta period, but it also achieved a balance during the period with the highly transmissible Delta variant. Notably, the TPR remained consistently below 3% throughout the Delta period, highlighting the complementary role of extensive testing, even when the proportion of UCs was relatively high (Figure 2C).
- The Fisher r-to-z test revealed significant differences in correlation coefficients between the proportion of UCs and confirmed case numbers in Korea and Japan (z=16.07, p<0.001). Additionally, differences in correlation coefficients were observed between the proportion of UCs and TPR in Korea and Japan (z=2.12, p=0.034).
RESULTS
- Social distancing measures in Korea and Japan were largely similar, with minor variations. In Korea, the government enforced social distancing measures through administrative authority based on legislative grounds [11]; in contrast, Japan preferred voluntary participation. When SEs were declared in Japan, citizens exercised self-restraint, and businesses closed in accordance with recommendations [19].
- Korea effectively curbed the spread of the virus through large-scale preemptive testing and contact tracing [11]. Japan focused on testing individuals at risk of causing clusters and employed bidirectional contact tracing, which identified additional infections that could have otherwise been easily overlooked [20]. Consequently, the formation of clusters was minimized. However, a drawback of this approach is that if patients are not identified early on, a series of asymptomatic infections may occur, heightening the risk of widespread transmission [20].
- Monitoring the TPR and the proportion of UCs over time is useful in evaluating the effectiveness of NPIs. From the beginning of the pandemic, Japan utilized the proportion of UCs as an indicator, with a high level serving as the basis for determining the need for a SE [19]. In our pre-Omicron analysis, the proportion of UCs never surpassed 49% in Korea and 63% in Japan. However, as the Omicron pandemic intensified, the proportion of UCs rose to 70–80%, with Japan’s peak reaching 81.3% on August 20, 2021. The proportion of UCs likely increased in Korea during the Omicron period as well, but those data were not available.
- In this study period, both the TPR and the proportion of UCs in Korea were lower than those in Japan. Assuming that these indicators were generated using comparable methods, testing and tracing were likely more effective in Korea than in Japan during the pre-Omicron period.
- This study is the first to report a significant positive correlation between the proportion of UCs and TPR in Korea and Japan. We also validated the previously reported correlation between the proportion of UCs and the number of confirmed cases. Moreover, we found that these correlations were significantly higher in Korea than in Japan. These findings suggest that more robust testing and tracing efforts, as indicated by lower proportion of UCs and TPR, contributed to suppressing the epidemic and reducing confirmed cases. Additionally, the extensive testing and tracing strategy employed in Korea resulted in a more pronounced impact.
- Prior studies have shown that UCs are correlated with time to hospital admission, and a larger number of UCs is associated with a greater pandemic scale [11,13]. In the absence of an epidemiological linkage, UCs tend to be detected slowly, reducing the benefits of contact tracing. These cases serve as an indicator of uncontrolled transmission; a low UC rate suggests that existing quarantine measures are effective.
- This association depends on the degree of testing completeness. Infectious disease transmission creates a network that can be identified through a combination of testing and contact tracing. Incomplete testing results in a greater number of hidden nodes, with a higher TPR and proportion of UCs. Our study emphasizes the importance of the combined roles of testing and tracing. A growing proportion of UCs would suggest that more robust efforts are required in testing and tracing, with a proper balance between these efforts.
- This study had certain limitations. First, we did not evaluate trends during the Omicron pandemic. However, during that time, both countries embraced policies that reduced social distancing and encouraged a return to normalcy. We excluded this period because the focus was no longer on suppression via NPIs. Furthermore, the KDCA did not provide data on UCs during the Omicron period after January 9, 2022. Second, although we identified correlations among the proportion of UCs, confirmed cases, and TPR, their temporal relationships require further study. Third, our study did not account for the effect of vaccination. The epidemic dynamic could be influenced by a combination of vaccination effects and the emergence of mutant viruses. We concentrated on testing and contact tracing, assuming that vaccination did not substantially confound the testing and tracing strategies.
- In conclusion, the present study supports earlier findings of positive correlations between UCs and confirmed cases. In addition, we discovered a correlation between the proportion of UCs and the TPR, suggesting the contribution of testing in combination with contact tracing. Both Korea and Japan have successfully implemented NPI policies, as evidenced by the moderately low proportion of UCs. Monitoring the proportion of UCs and the TPR can be useful in assessing the effectiveness of NPIs. If the proportion of UCs trends upward, more testing and contact tracing efforts may be required.
DISCUSSION
SUPPLEMENTAL MATERIALS
ACKNOWLEDGEMENTS
-
CONFLICT OF INTEREST
The authors have no conflicts of interest associated with the material presented in this paper.
-
FUNDING
This study was supported by funds from the Seegene Medical Foundation (grant No. 200-20210107).
-
AUTHOR CONTRIBUTIONS
Conceptualization: Jeong Y. Data curation: Jeong Y, Kang S. Formal analysis: Jeong Y, Kim B. Funding acquisition: Cho SI. Methodology: Jeong Y, Kang S, Cho SI. Project administration: Kim B, Jeong Y. Visualization: Jeong Y, Gil YJ. Writing – original draft: Jeong Y. Writing – review & editing: Kang S, Kim B, Gil YJ, Hwang SS, Cho SI.
Notes

| Characteristics | Korea1 | Japan2 |
|---|---|---|
| 3 Cs | ||
| Crowded places | ||
| Close-contact settings | ||
| Closed spaces | ||
|
|
||
| 3 Ts | ||
| Testing |
|
|
| Tracing and quarantine | ||
PCR, polymerase chain reaction; QR code, quick response code; COCOA, COVID-19 Contact-Confirming Application.
1 Source from Korea Disease Control and Prevention Agency (KDCA). Analysis of COVID-19 occurrence during the first-class legal infectious disease designation period (2020.1.20 to 2022.4.24) [16].
2 Source from Ministry of Health, Labor and Welfare. COVID-19 case, testing and hospitalization data; 2022 [17].
- 1. Flaxman S, Mishra S, Gandy A, Unwin HJ, Mellan TA, Coupland H, et al. Estimating the effects of non-pharmaceutical interventions on COVID-19 in Europe. Nature 2020;584(7820):257-261PubMed
- 2. Bedford J, Enria D, Giesecke J, Heymann DL, Ihekweazu C, Kobinger G, et al. COVID-19: towards controlling of a pandemic. Lancet 2020;395(10229):1015-1018ArticlePubMedPMC
- 3. Niazi MU, Kibangou A, Canudas-de-Wit C, Nikitin D, Tumash L, Bliman PA. Modeling and control of epidemics through testing policies. Annu Rev Control 2021;52: 554-572ArticlePubMedPMC
- 4. Liu Y, Morgenstern C, Kelly J, Lowe R, Jit M; CMMID COVID-19 Working Group. The impact of non-pharmaceutical interventions on SARS-CoV-2 transmission across 130 countries and territories. BMC Med 2021;19(1):40ArticlePubMedPMCPDF
- 5. Shokoohi M, Osooli M, Stranges S. COVID-19 pandemic: what can the west learn from the east? Int J Health Policy Manag 2020;9(10):436-438ArticlePubMedPMCPDF
- 6. Zhao S, Wong HC, Lowe C, Monaco E, Corbett J. COVID-19 pandemic, crisis responses and the changing world. Singapore: Springer; 2021. p. 137-147
- 7. Furuse Y, Ko YK, Saito M, Shobugawa Y, Jindai K, Saito T, et al. Epidemiology of COVID-19 outbreak in Japan, from January-March 2020. Jpn J Infect Dis 2020;73(5):391-393ArticlePubMed
- 8. Ministry of Health, Labor and Welfare. Japan’s cluster-based approach; [cited 2023 Jan 2] Available from: https://www.mhlw.go.jp/content/10900000/000639224.pdf
- 9. Park Y, Huh IS, Lee J, Kang CR, Cho SI, Ham HJ, et al. Application of testing-tracing-treatment strategy in response to the COVID-19 outbreak in Seoul, Korea. J Korean Med Sci 2020;35(45):e396ArticlePubMedPMCPDF
- 10. Wong NS, Lee SS, Kwan TH, Yeoh EK. Settings of virus exposure and their implications in the propagation of transmission networks in a COVID-19 outbreak. Lancet Reg Health West Pac 2020;4: 100052ArticlePubMedPMC
- 11. Chong KC, Jia K, Lee SS, Hung CT, Wong NS, Lai FT, et al. Characterization of unlinked cases of COVID-19 and implications for contact tracing measures: retrospective analysis of surveillance data. JMIR Public Health Surveill 2021;7(11):e30968ArticlePubMedPMC
- 12. Ryu S, Ali ST, Noh E, Kim D, Lau EH, Cowling BJ. Transmission dynamics and control of two epidemic waves of SARS-CoV-2 in South Korea. BMC Infect Dis 2021;21(1):485ArticlePubMedPMCPDF
- 13. Jeon J, Han C, Kim T, Lee S. Evolution of responses to COVID-19 and epidemiological characteristics in South Korea. Int J Environ Res Public Health 2022;19(7):4056ArticlePubMedPMC
- 14. Hideo T, Kazutoshi M, Miki W. Trends in the incidence of symptomatic COVID-19 during the first endemic wave in the Japanese population. J Natl Inst Public Health 2021;70(3):315-322
- 15. Our World in Data. Coronavirus pandemic (COVID-19); 2022 [cited 2022 Dec 29]. Available from: https://ourworldindata.org/coronavirus
- 16. Korea Disease Control and Prevention Agency. Analysis of COVID-19 occurrence during the first-class legal infectious disease designation period (2020.1.20 to 2022.4.24.); [cited 2022 Dec 29]. Available from: https://www.kdca.go.kr/board/board.es?mid=a20501010000&bid=0015 (Korean)
- 17. Ministry of Health, Labor and Welfare. COVID-19 case, testing and hospitalization data; 2022 [cited 2022 Dec 29]. Available from: https://covid19.mhlw.go.jp/extensions/public/en/index2.html
- 18. Fisher RA. Frequency distribution of the values of the correlation coefficient in samples from an indefinitely large population. Biometrika 1915;10(4):507-521Article
- 19. National Assembly Secretariat. Regarding Japan’s COVID-19 crisis ‘Declaration of a state of emergency’ and ‘Priority measures such as prevention of spread’; 2021 [cited 2023 Jan 2]. Available from: https://nas.na.go.kr/nas/info/diplomacy_active03.do?mode=view&articleNo=667980&article.offset=220&articleLimit=10 (Korean)
- 20. Bradshaw WJ, Alley EC, Huggins JH, Lloyd AL, Esvelt KM. Bidirectional contact tracing could dramatically improve COVID-19 control. Nat Commun 2021;12(1):232ArticlePubMedPMCPDF
 PubReader
 ePub Link
 Cite
Cite


