
Articles
- Page Path
- HOME > J Prev Med Public Health > Volume 57(1); 2024 > Article
-
Original Article
Prevalence and Determinants of Catastrophic Healthcare Expenditures in Iran From 2013 to 2019 -
Abdoreza mousavi1,2
 , Farhad lotfi3,4, Samira Alipour5, Aliakbar Fazaeli2,6, Mohsen Bayati4
-
Journal of Preventive Medicine and Public Health 2024;57(1):65-72.
DOI: https://doi.org/10.3961/jpmph.23.291
Published online: November 25, 2023
1Health policy Research Center, Institute of Health, Shiraz University of Medical Sciences, Shiraz, Iran
2Department of Health Management, Policy & Economics, School of Public Health, Tehran University of Medical Sciences, Tehran, Iran
3National Center for Health Insurance Research, Tehran, Iran
4Health Human Resources Research Center, School of Health Management and Information Sciences, Shiraz University of Medical Sciences, Shiraz, Iran
5Health Management and Economics Research Center, Health Management Research Institute, Iran University of Medical Sciences, Tehran, Iran
6Heath Equity Research Center (HERC), Tehran University of Medical Sciences, Tehran, Iran
- Corresponding author: Mohsen Bayati, Health Human Resources Research Center, School of Health Management and Information Sciences, Shiraz University of Medical Sciences, 29 Alley, Qasrodasht Aveneue, Shiraz 71336‑54361, Iran E-mail: bayatim66@gmail.com
Copyright © 2024 The Korean Society for Preventive Medicine
This is an Open Access article distributed under the terms of the Creative Commons Attribution Non-Commercial License (http://creativecommons.org/licenses/by-nc/4.0/) which permits unrestricted non-commercial use, distribution, and reproduction in any medium, provided the original work is properly cited.
ABSTRACT
-
Objectives:
- Protecting people against financial hardship caused by illness stands as a fundamental obligation within healthcare systems and constitutes a pivotal component in achieving universal health coverage. The objective of this study was to analyze the prevalence and determinants of catastrophic health expenditures (CHE) in Iran, over the period of 2013 to 2019.
-
Methods:
- Data were obtained from 7 annual national surveys conducted between 2013 and 2019 on the income and expenditures of Iranian households. The prevalence of CHE was determined using a threshold of 40% of household capacity to pay for healthcare. A binary logistic regression model was used to identify the determinants influencing CHE.
-
Results:
- The prevalence of CHE increased from 3.60% in 2013 to 3.95% in 2019. In all the years analyzed, the extent of CHE occurrence among rural populations exceeded that of urban populations. Living in an urban area, having a higher wealth index, possessing health insurance coverage, and having employed family members, an employed household head, and a literate household head are all associated with a reduced likelihood of CHE (p<0.05). Conversely, the use of dental, outpatient, and inpatient care, and the presence of elderly members in the household, are associated with an increased probability of facing CHE (p<0.05).
-
Conclusions:
- Throughout the study period, CHE consistently exceeded the 1% threshold designated in the national development plan. Continuous monitoring of CHE and its determinants at both household and health system levels is essential for the implementation of effective strategies aimed at enhancing financial protection.
- Ensuring fair contributions to health financing and protecting individuals from the financial hardship associated with illness are fundamental obligations of healthcare systems [1]. Catastrophic healthcare expenditures (CHE) are a commonly utilized concept for monitoring financial risk protection [2,3] and tracking progress toward achieving universal health coverage [4,5]. The World Health Organization (WHO) defines CHE as out-of-pocket (OOP) payments that exceed 40% of a household’s capacity to pay for healthcare [6].
- The occurrence of CHE affects social welfare and can potentially lead households to reduce essential expenses and become impoverished [7]. The possibility of CHE exists in all countries at any level of income [8]. However, the prevalence of CHE is higher in developing countries, as OOP payments constitute the primary source of healthcare financing in these nations [9]. The primary cause of CHE occurrence, is the high share of OOP payment for health expenses. As OOP expenditures for healthcare services increase, the capacity for risk pooling and resource allocation diminishes. Consequently, there is an increased likelihood of households experiencing CHE [10,11].
- Extensive reliance on OOP payments in healthcare financing carries significant repercussions for healthcare utilization and, consequently health. In such circumstances, households endeavoring to meet their medical expenses may resort to depleting their savings, liquidating assets, or reducing consumption, ultimately leading to a decline in their overall living standards [12]. OOP payments, recognized as the most regressive source of health financing [3], are a significant determinant of health expenditures in countries with mixed-method financing, such as Iran [13]. According to the World Bank, 39% of the total health expenditures in Iran in 2019 were in the form of OOP payments. This figure is significantly higher than the global average of 18% for the same indicator [14].
- An essential objective of Iran’s health system is to provide financial protection against exposure to CHE, a goal explicitly outlined in the country’s development plan [15]. Furthermore, a key objective of the implementation of the health transformation plan in 2014 was the reduction of OOP payments [16]. However, during recent years, problems such as economic challenges, fluctuations in economic growth, international economic sanctions, and internal mismanagement have posed substantial barriers to the nation’s healthcare system towards these financial protections against CHE [17].
- Based on the 40% capacity-to-pay threshold for households, it is estimated that CHE affects approximately 210 million people worldwide [5]. Although the prevalence of CHE depends on factors such as the studied population and the sample size, according to a meta-analysis study, the prevalence of CHE among Iranian households was 4.7% [8]. The high prevalence of CHE indicates a failure to achieve financial protection among the Sustainable Development Goals [5]. Identification and awareness of major factors contributing to CHE are essential for the allocation of health budgets and guaranteeing access to services, technologies, and supplies needed to promote and improve health, as well as for disease prevention [8].
- Understanding the scope and determinants of CHE is crucial for policymakers and healthcare providers to develop effective strategies to improve financial protection for households facing high healthcare costs. This study aimed to analyze the prevalence and determinants of CHE in Iran from 2013 to 2019. Although previous research has been conducted on CHE among Iranian households, this study specifically examines the occurrence of CHE in a recent 7-year period, providing current and relevant information on the topic.
INTRODUCTION
- Study Setting
- The present study aimed to examine the prevalence of CHE and its determinants in Iran between 2013 and 2019. Iran, located in the Middle Eastern region with a population of 88 million people, was classified as a lower-middle-income country in 2022 by the World Bank [18].
- Data, Sampling Method, and Variables
- The required data were obtained from 7 annual national surveys conducted between 2013 and 2019 on the income and expenditures of Iranian households. The Statistical Center of Iran conducts these surveys annually. These surveys include the following 4 components: (1) socio-demographic characteristics of household members; (2) housing characteristics, living facilities, and assets; (3) household food and non-food expenditures; and (4) household income.
- The research sample included all households that participated in the survey for which questionnaire data was available. The sampling survey selected households based on random cluster sampling, with census zones allocated in the first stage, urban and rural blocks selected in the second stage, and survey subject households selected in the final stage [19]. The sample size for this survey is reported in Table 1. It should be noted that some samples were removed due to incomplete data.
- In this study, the primary variable of interest was the occurrence of CHE within households. To evaluate this, we applied the methodology recommended by the WHO, which defines CHE as occurring when a household’s total OOP expenses equal or exceed 40% of the capacity to pay. The household’s capacity to pay (ctph) is defined as the non-subsistence effective income of the household. However, some households may report food expenditures that are lower than subsistence spending (seh > foodh). In this particular case, the non-food expenditures are used as non-subsistence spending [20].
- ctph = exph−seh if seh ≤ foodh (1)
- ctph = exph−foodh if seh > foodh (2)
- The term exph represents a household’s total expenditures. The burden of health payments is defined as the OOP payments as a percentage of a household’s capacity to pay, as follows [20]:
- Wher eooph is OOP health payments. CHE occurs when a household’s total OOP health payments equal or exceed 40% of household’s capacity to pay or non-subsistence spending [20].
- The CHE variable was created and analyzed as a binary variable, where a value of 1 represented households with CHE, and 0 represented households without CHE.
- Based on studies carried out in Iran [8,9,21], the following factors were considered as determinants of CHE: place of residence (urban or rural), education status of the household head, employment situation of the household head, number of employed members of the household, presence of people aged over 65 years in the household, household wealth index, health insurance coverage, use of outpatient services, use of inpatient services, and use of dental services.
- We employed a wealth index extracted from the primary principal component of a household asset vector, including elements such as durable goods and housing conditions. The principal component analysis (PCA) method establishes this wealth index using the leading principal component of these variables [22]. Subsequently, households were categorized into 5 socioeconomic status groups, determined by their wealth scores, which ranged from the poorest (first quintile) to the richest (fifth quintile).
- Statistical Analysis
- To analyze the effective factors on CHE, a binary logistic regression model was used, and marginal effects were estimated [23].
- In the above equation, is the independent variable, α is a constant, βk are coefficients, x is the independent variable, εi is an error term, and is the probability of CHE occurring in households. The occurrence of CHE was calculated for each year during the study period, with separate analyses conducted for urban and rural areas. The data analysis was performed using Microsoft Excel (Microsoft Corp., Redmond, WA, USA). and Stata version 15 (StataCorp., College Station, TX, USA).
- Ethics Statement
- The project was found to be in accordance with the ethical principles and the national norms and standards for conducting medical research. The study protocol was approved by the Ethics Committee of Shiraz University of Medical Sciences under code IR.SUMS.REC.1398.600.
METHODS
- Table 2 shows that, throughout all years, approximately 50% of the surveyed households were located in urban areas. Furthermore, across all cases, more than 85% of households had a male head, with over 72% being literate and more than 65% being employed. Additionally, over 20% of households included elderly members, and more than 81% possessed health insurance coverage.
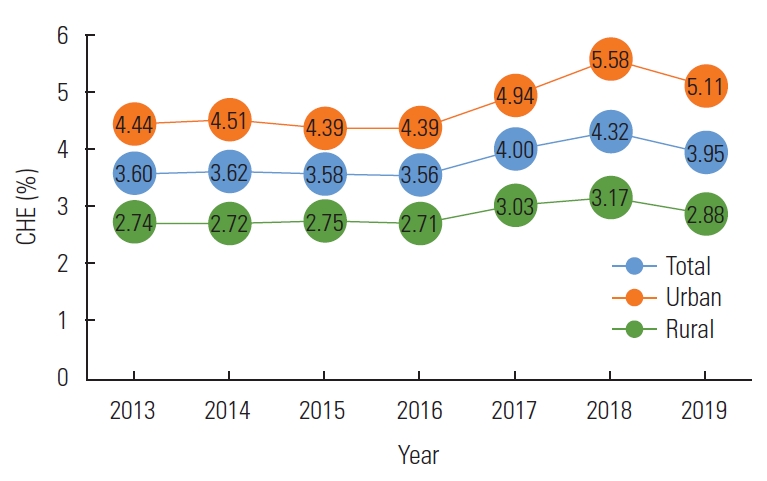
- Based on Figure 1, it is evident that the prevalence of CHE among both rural and urban populations exhibited a relatively increasing trend from 2013 to 2019, despite fluctuations. The percentage of households experiencing CHE increased from 3.60% in 2013 to 3.95% in 2019. Throughout the entire study period, this indicator consistently exhibited a higher prevalence among rural populations than among urban populations.
- Table 3 presents the findings pertaining to the marginal effects of determinants on the prevalence of CHE from 2013 to 2019. Across the majority of the years studied, it was observed that households located in urban areas, those with a greater number of employed members, higher wealth index, health insurance coverage, and households headed by literate or employed individuals exhibited a significantly lower probability of experiencing CHE (p<0.05). Conversely, the use of inpatient care, outpatient care, dental care, and the presence of an elderly member in the household were significantly associated with an increased probability of facing CHE (p<0.05).
RESULTS
- The current study aims to examine the prevalence of CHE and the contributing factors during the period of 2013 to 2019 in Iran. The results indicate that, despite small fluctuations, the prevalence of CHE in Iran increased from 3.60% in 2013 to 3.95% in 2019. Notably, throughout all the years studied, the prevalence of CHE was consistently higher among rural populations than among urban populations.
- Studies conducted in the last decade, the exposure of Iranian households to CHE has varied from 1.99% to 5.26% [9,11,21,24]. Based on the meta-analysis by Doshmangir et al. [8], the prevalence of CHE in Iran is 4.7% (95% confidence interval [CI], 4.1 to 5.3) at the population level and 25.3% (95% CI, 11.7 to 46.5) across various diseases. The reported prevalence of CHE varies among different studies due to reasons such as differences in the study approach (at the population or patient level), variations in sample size, differences in data collection instruments, and variations in the year of the study, which can affect economic situations and OOP payments for healthcare services.
- Despite the implementation of numerous policies and strategies in recent decades, Iran’s health system has not achieved its goal of effectively protecting households against CHE [25]. Although efforts to improve equity in financing healthcare services, inequality in healthcare costs in Iran increased from 1984 to 2010. Nearly half of the healthcare expenditures were financed through OOP payments [26]. The Targeted Subsidies Law was implemented in 2010 as part of Iran’s development program. While the plan reduced inequality among Iranian households, it did not lead to significant improvement in the equity of financing healthcare [27]. Subsequently, the Iran Health Transformation Plan, which was implemented in 2014, has not effectively improved financial protection against CHE [16,24]. Consequently the Iranian healthcare system has been unable to achieve the goal set in the Fifth and Sixth Development Plans of reducing the prevalence of CHE to 1%. In order to achieve financial protection, in addition to evaluating strategies, sustainable sources of financing are necessary.
- The high prevalence of CHE in Iran highlights the crucial need for effective government interventions in this regard [28,29]. Prioritizing health as a social imperative is crucial, as it facilitates the allocation of additional resources to the health sector and aids in the reduction of OOP payments [30]. Nevertheless, it is important to note that addressing the issue of CHE cannot be solely accomplished through increasing income [6]. The main approach to protecting individuals from CHE is through the extension of financial security plans based on prepayment, such as various insurance schemes, and the pooling of resources for healthcare, instead of relying on healthcare payments at the time of use and OOP expenses [8,29,31].
- When designing and implementing financing protection policies, it is crucial to consider demographics, vulnerable groups, and diseases that exhibit higher likelihoods of CHE [8,28,32]. In addition to the effort to decrease the occurrence of CHE, there is a need to reduce socioeconomic inequality concerning the burden of CHE among various subpopulations by ensuring comprehensive coverage for all and facilitating access to health resources and services [33]. Based on the findings of this study, living in an urban area, having a higher wealth in-dex, possessing health insurance coverage, and having employed family members, an employed household head, and a literate household head are all associated with a reduced likelihood of experiencing CHE. Conversely, the use of dental, outpatient, and inpatient care, and the presence of elderly members in the household, are associated with a higher probability of facing CHE. While the findings did not exactly match those of other studies, they were similar to the results of previous research conducted in this field [8,9,11,21,34]. Furthermore, Azani et al. [35]’s systematic review of studies published globally found that household economic status, hospitalization, the presence of an elderly or disabled household member, and having a family member with a chronic illness are common significant factors that impact the prevalence of CHE in all countries.
- In recent years, the prevalence of CHE in Iran has significantly surpassed the health system’s intended target of 1%. Consequently, there is an urgent need to evaluate the effectiveness of financial protection policies. The Iranian health system must make a greater effort to reduce the burden of OOP payments and protect households from financial hardship caused by healthcare expenditures. This can be achieved by developing prepayment methods, strengthening social protections, revising and enhancing the strategies of health sector plans, ensuring sustainable financing, and improving access to essential healthcare services. Additionally, continuous monitoring of CHE and its influencing factors at both household and health system levels is essential for implementing effective strategies for improving financial protection.
- The current study has some limitations that should be considered when interpreting its results. First, the data collected through this survey were self-reported and may be subject to recall bias and lower or higher cost reporting. Second, the method used to measure CHE did not take into account households’ indirect costs, such as the cost of traveling and income losses caused by illness. Third, households unable to afford healthcare services were not included in the calculation of the CHE approach.
DISCUSSION
-
Data Availability
The datasets used and/or analyzed during the current study are available from the corresponding author upon reasonable request.
-
Conflict of Interest
The authors have no conflicts of interest associated with the material presented in this paper.
-
Funding
This study was funded by Shiraz University of Medical Sciences (grant No. 16863).
-
Author Contributions
Conceptualization: Mousavi A, Bayati M. Data curation: Mousavi A, Alipour S. Formal analysis: Lotfi F, Mousavi A. Methodology: Lotfi F, Fazaeli A. Writing – original draft: Alipour S, Bayati M. Writing – review & editing: Mousavi A, Lotfi F, Alipour S, Fazaeli A, Bayati M.
Notes
Acknowledgements
| Year | Total no. of households | Percentage of urban households |
|---|---|---|
| 2013 | 38 241 | 49.30 |
| 2014 | 38 189 | 49.37 |
| 2015 | 38 143 | 49.35 |
| 2016 | 38 022 | 49.33 |
| 2017 | 37 860 | 49.27 |
| 2018 | 38 859 | 52.27 |
| 2019 | 38 196 | 51.91 |
| Variables |
Marginal effect |
||||||
|---|---|---|---|---|---|---|---|
| 2013 | 2014 | 2015 | 2016 | 2017 | 2018 | 2019 | |
| Geographical area (reference: rural) | |||||||
| Urban | ‑0.007* | ‑0.005* | ‑0.006* | ‑0.007* | ‑0.006* | ‑0.010* | ‑0.008* |
| Literacy status of the household head (reference: illiterate) | |||||||
| Literate | ‑0.004* | ‑0.005* | ‑0.003* | ‑0.001 | ‑0.004* | ‑0.006* | ‑0.001 |
| Employment status of the household head (reference: unemployed) | |||||||
| Employed | ‑0.009* | ‑0.007* | ‑0.005* | ‑0.008* | ‑0.005* | ‑0.007* | ‑0.001 |
| No. of employed members of the household | ‑0.005* | ‑0.004* | ‑0.005* | ‑0.004* | ‑0.006* | ‑0.005* | ‑0.006* |
| Health insurance coverage (reference: no) | |||||||
| Yes | ‑0.004* | ‑0.003* | ‑0.005* | ‑0.006* | ‑0.003 | ‑0.005* | ‑0.004* |
| Household using outpatient care (reference: not used) | |||||||
| Used | 0.026* | 0.025* | 0.026* | 0.022* | 0.021* | 0.026* | 0.021* |
| Household using inpatient care (reference: not used) | |||||||
| Used | 0.055* | 0.055* | 0.050* | 0.062* | 0.067* | 0.069* | 0.072* |
| Household using dental care (reference: not used) | |||||||
| Used | 0.055* | 0.083* | 0.075* | 0.077* | 0.086* | 0.087* | 0.113* |
| ≥65‑y‑old member living in the household (reference: no) | |||||||
| Yes | 0.008* | 0.008* | 0.008* | 0.008* | 0.011* | 0.007* | 0.006* |
| Wealth index of the household (reference: poorest) | |||||||
| Poorer | ‑0.001 | ‑0.004 | ‑0.002 | ‑0.005* | ‑0.005* | ‑0.005* | ‑0.002 |
| Middle | ‑0.003 | ‑0.009* | ‑0.006* | ‑0.007* | ‑0.008* | ‑0.011* | ‑0.008* |
| Richer | ‑0.008* | ‑0.012* | ‑0.011* | ‑0.009* | ‑0.012* | ‑0.014* | ‑0.015* |
| Richest | ‑0.011* | ‑0.015* | ‑0.015* | ‑0.014* | ‑0.018* | ‑0.018* | ‑0.020* |
- 1. World Health Organization. The world health report 2000: health systems: improving performance: 2000 [cited 2023 Nov 1]. Available from: https://www.who.int/publications/i/item/924156198X
- 2. World Health Organization & International Bank for Reconstruction and Development. Global monitoring report on financial protection in health 2021 [cited 2023 Nov 1]. Available from: https://apps.who.int/iris/handle/10665/350240
- 3. Saksena P, Hsu J, Evans DB. Financial risk protection and universal health coverage: evidence and measurement challenges. PLoS Med 2014;11(9):e1001701. https://doi.org/10.1371/journal.pmed.1001701ArticlePubMedPMC
- 4. Cylus J, Thomson S, Evetovits T. Catastrophic health spending in Europe: equity and policy implications of different calculation methods. Bull World Health Organ 2018;96(9):599-609. https://doi.org/10.2471/BLT.18.209031ArticlePubMedPMC
- 5. Wagstaff A, Flores G, Hsu J, Smitz MF, Chepynoga K, Buisman LR, et al. Progress on catastrophic health spending in 133 countries: a retrospective observational study. Lancet Glob Health 2018;6(2):e169-e179. https://doi.org/10.1016/S2214-109X(17)30429-1ArticlePubMed
- 6. Xu K, Evans DB, Kawabata K, Zeramdini R, Klavus J, Murray CJ. Household catastrophic health expenditure: a multicountry analysis. Lancet 2003;362(9378):111-117. https://doi.org/10.1016/S0140-6736(03)13861-5ArticlePubMed
- 7. Wei N, Huang W, Zhou LL. Impact of catastrophic health expenditures on Chinese household consumption. Front Public Health 2021;9: 646494. https://doi.org/10.3389/fpubh.2021.646494ArticlePubMedPMC
- 8. Doshmangir L, Yousefi M, Hasanpoor E, Eshtiagh B, Haghparast-Bidgoli H. Determinants of catastrophic health expenditures in Iran: a systematic review and meta-analysis. Cost Eff Resour Alloc 2020;18: 17. https://doi.org/10.1186/s12962-020-00212-0ArticlePubMedPMC
- 9. Rezaei S, Hajizadeh M. Measuring and decomposing socioeconomic inequality in catastrophic healthcare expenditures in Iran. J Prev Med Public Health 2019;52(4):214-223. https://doi.org/10.3961/jpmph.19.046ArticlePubMedPMC
- 10. Dorjdagva J, Batbaatar E, Svensson M, Dorjsuren B, Kauhanen J. Catastrophic health expenditure and impoverishment in Mongolia. Int J Equity Health 2016;15(1):105. https://doi.org/10.1186/s12939-016-0395-8ArticlePubMedPMC
- 11. Yazdi-Feyzabadi V, Bahrampour M, Rashidian A, Haghdoost AA, Akbari Javar M, Mehrolhassani MH. Prevalence and intensity of catastrophic health care expenditures in Iran from 2008 to 2015: a study on Iranian household income and expenditure survey. Int J Equity Health 2018;17(1):44. https://doi.org/10.1186/s12939-018-0743-yArticlePubMedPMC
- 12. van Doorslaer E, O’Donnell O, Rannan-Eliya RP, Somanathan A, Adhikari SR, Garg CC, et al. Catastrophic payments for health care in Asia. Health Econ 2007;16(11):1159-1184. https://doi.org/10.1002/hec.1209ArticlePubMed
- 13. Raeissi P, Rajabi MR, Mousavi A, Vahedi S, Khalilabad TH. Investigating the determinants of healthcare expenditures in different healthcare systems. Shiraz E Medical J 2019;20(9):e86506. https://doi.org/10.5812/semj.86506Article
- 14. World Bank. World development indicators [cited 2023 Jul 1]. Available from: https://databank.worldbank.org/reports.aspx?source = 2&series = SH.XPD.OOPC.CH.ZS&country
- 15. Ministry of Energy. IRAN (Islamic Republic of ): law on the sixth five-year economic, cultural and social development plan [cited 2023 Nov 1]. Available from: https://policy.asiapacificenergy.org/node/3671 (Persian)
- 16. Bordbar S, Gholampoor H, Jalali FS, Delavari S. The effect of Iran health transformation plan on equity in health financing: a systematic review. Iran J Public Health 2023;52(9):1844-1854. https://doi.org/10.18502/ijph.v52i9.13567ArticlePubMedPMC
- 17. Naghdi S, Moradi T, Tavangar F, Bahrami G, Shahboulaghi M, Ghiasvand H. The barriers to achieve financial protection in Iranian health system: a qualitative study in a developing country. Ethiop J Health Sci 2017;27(5):491-500. https://doi.org/10.4314/ejhs.v27i5.7ArticlePubMedPMC
- 18. World Bank. Iran, Islamic Rep [cited 2023 Jul 1]. Available from: https://data.worldbank.org/country/iran-islamic-rep
- 19. Statistics Center of Iran. Household, expenditure and income: definitions, concepts and statistical survey [cited 2023 Jul 1]. Available from: https://www.amar.org.ir/english/Statistics-by-Topic/Household-Expenditure-and-Income
- 20. World Health Organization. Distribution of health payments and catastrophic expenditures methodology; 2005 [cited 2023 Jul 1]. Available from: https://www.who.int/publications/i/item/EIP-FER-DP.05.2
- 21. Fazaeli AA, Ghaderi H, Abbas Fazaeli A, Lotfi F, Salehi M, Mehrara M. Main determinants of catastrophic health expenditures: a Bayesian logit approach on Iranian household survey data (2010). Glob J Health Sci 2015;7(4):335-340. https://doi.org/10.5539/gjhs.v7n4p335Article
- 22. Vyas S, Kumaranayake L. Constructing socio-economic status indices: how to use principal components analysis. Health Policy Plan 2006;21(6):459-468. https://doi.org/10.1093/heapol/czl029ArticlePubMed
- 23. Wagstaff A, Van Doorslaer E, Watanabe N. On decomposing the causes of health sector inequalities with an application to malnutrition inequalities in Vietnam. J Econom 2003;112(1):207-223. https://doi.org/10.1016/S0304-4076(02)00161-6Article
- 24. Yazdi-Feyzabadi V, Mehrolhassani MH, Darvishi A. Measuring catastrophic health expenditures and its inequality: evidence from Iran’s health transformation program. Health Policy Plan 2019;34(4):316-325. https://doi.org/10.1093/heapol/czz031ArticlePubMed
- 25. Hedayati M, Masoudi Asl I, Maleki M, Fazaeli AA, Goharinezhad S. Policy analysis of the protection of Iranian households against catastrophic health expenditures: a qualitative analysis. BMC Health Serv Res 2023;23(1):445. https://doi.org/10.1186/s12913-023-09275-0ArticlePubMedPMC
- 26. Zare H, Trujillo AJ, Driessen J, Ghasemi M, Gallego G. Health inequalities and development plans in Iran; an analysis of the past three decades (1984-2010). Int J Equity Health 2014;13: 42. https://doi.org/10.1186/1475-9276-13-42ArticlePubMedPMC
- 27. Zandian H, Takian A, Rashidian A, Bayati M, Zahirian Moghadam T, Rezaei S, et al. Effects of Iranian economic reforms on equity in social and healthcare financing: a segmented regression analysis. J Prev Med Public Health 2018;51(2):83-91. https://doi.org/10.3961/jpmph.17.050ArticlePubMedPMC
- 28. Aryankhesal A, Etemadi M, Mohseni M, Azami-Aghdash S, Nakhaei M. Catastrophic health expenditure in Iran: a review article. Iran J Public Health 2018;47(2):166-177PubMedPMC
- 29. Rezaei S, Woldemichael A, Hajizadeh M, Kazemi Karyani A. Catastrophic healthcare expenditures among Iranian households: a systematic review and meta-analysis. Int J Hum Rights Healthc 2018;12(2):105-115. https://doi.org/10.1108/IJHRH-02-2018-0017Article
- 30. Global Burden of Disease Health Financing Collaborator Network. Past, present, and future of global health financing: a review of development assistance, government, out-of-pocket, and other private spending on health for 195 countries, 1995-2050. Lancet 2019;393(10187):2233-2260. https://doi.org/10.1016/S0140-6736(19)30841-4ArticlePubMedPMC
- 31. World Health Organization. Financial protection [cited 2023 Jul 1]. Available from: https://www.who.int/health-topics/financial-protection#tab = tab_1
- 32. Chang EJ, Kang S, Jeong Y, Kang S, Kang SJ. The impact of public transfer income on catastrophic health expenditures for households with disabilities in Korea. J Prev Med Public Health 2023;56(1):67-76. https://doi.org/10.3961/jpmph.22.183ArticlePubMedPMC
- 33. Hernández-Vásquez A, Rojas-Roque C, Vargas-Fernández R, Rosselli D. Measuring out-of-pocket payment, catastrophic health expenditure and the related socioeconomic inequality in Peru: a comparison between 2008 and 2017. J Prev Med Public Health 2020;53(4):266-274. https://doi.org/10.3961/jpmph.20.035ArticlePubMedPMC
- 34. Eze P, Lawani LO, Agu UJ, Amara LU, Okorie CA, Acharya Y. Factors associated with catastrophic health expenditure in sub-Saharan Africa: a systematic review. PLoS One 2022;17(10):e0276266. https://doi.org/10.1371/journal.pone.0276266ArticlePubMedPMC
- 35. Azzani M, Roslani AC, Su TT. Determinants of household catastrophic health expenditure: a systematic review. Malays J Med Sci 2019;26(1):15-43. https://doi.org/10.21315/mjms2019.26.1.3ArticlePubMedPMC
REFERENCES
Figure & Data
References
Citations
- An analysis of financial protection and financing incidence of out-of-pocket health expenditures in Kazakhstan from 2018 to 2021
Askhat Shaltynov, Yulia Semenova, Madina Abenova, Assel Baibussinova, Ulzhan Jamedinova, Ayan Myssayev
Scientific Reports.2024;[Epub] CrossRef
 PubReader
 ePub Link
 Cite
Cite

