
Articles
- Page Path
- HOME > J Prev Med Public Health > Volume 57(2); 2024 > Article
-
Original Article
Alleviation of PM2.5-associated Risk of Daily Influenza Hospitalization by COVID-19 Lockdown Measures: A Time-series Study in Northeastern Thailand -
Benjawan Roudreo1,2
 , Sitthichok Puangthongthub1
-
Journal of Preventive Medicine and Public Health 2024;57(2):108-119.
DOI: https://doi.org/10.3961/jpmph.23.349
Published online: January 19, 2024
- 1,572 Views
- 163 Download
1Industrial Toxicology and Risk Assessment Graduate Program, Department of Environmental Science, Faculty of Science, Chulalongkorn University, Bangkok, Thailand
2Department of Disease Control, Ministry of Public Health, Nonthaburi, Thailand
- Corresponding author: Sitthichok Puangthongthub, Industrial Toxicology and Risk Assessment Graduate Program, Department of Environmental Science, Faculty of Science, Chulalongkorn University, 254 Phaya Thai Road, Wang Mai, Pathum Wan, Bangkok 10330, Thailand E-mail: sitthichok.p@chula.ac.th
Copyright © 2024 The Korean Society for Preventive Medicine
This is an Open Access article distributed under the terms of the Creative Commons Attribution Non-Commercial License (http://creativecommons.org/licenses/by-nc/4.0/) which permits unrestricted non-commercial use, distribution, and reproduction in any medium, provided the original work is properly cited.
ABSTRACT
-
Objectives:
- Abrupt changes in air pollution levels associated with the coronavirus disease 2019 (COVID-19) outbreak present a unique opportunity to evaluate the effects of air pollution on influenza risk, at a time when emission sources were less active and personal hygiene practices were more rigorous.
-
Methods:
- This time-series study examined the relationship between influenza cases (n=22 874) and air pollutant concentrations from 2018 to 2021, comparing the timeframes before and during the COVID-19 pandemic in and around Thailand’s Khon Kaen province. Poisson generalized additive modeling was employed to estimate the relative risk of hospitalization for influenza associated with air pollutant levels.
-
Results:
- Before the COVID-19 outbreak, both the average daily number of influenza hospitalizations and particulate matter with an aerodynamic diameter of 2.5 μm or less (PM2.5) concentration exceeded those later observed during the pandemic (p<0.001). In single-pollutant models, a 10 μg/m3 increase in PM2.5 before COVID-19 was significantly associated with increased influenza risk upon exposure to cumulative-day lags, specifically lags 0-5 and 0-6 (p<0.01). After adjustment for co-pollutants, PM2.5 demonstrated the strongest effects at lags 0 and 4, with elevated risk found across all cumulative-day lags (0-1, 0-2, 0-3, 0-4, 0-5, and 0-6) and significantly greater risk in the winter and summer at lag 0-5 (p<0.01). However, the PM2.5 level was not significantly associated with influenza risk during the COVID-19 outbreak.
-
Conclusions:
- Lockdown measures implemented during the COVID-19 pandemic could mitigate the risk of PM2.5-induced influenza. Effective regulatory actions in the context of COVID-19 may decrease PM2.5 emissions and improve hygiene practices, thereby reducing influenza hospitalizations.
- The acute respiratory health effects of particulate matter with an aerodynamic diameter of 2.5 μm or less (PM2.5) represent a major public health concern around the world. Respiratory illness is currently a leading global cause of death and disease, with the highest attack rates observed in young children. Historically, infants and children have frequently become infected and died from respiratory infectious diseases, such as influenza [1]. It is well-established that influenza is caused by viral infections. The incidence of influenza exhibits seasonal patterns and is influenced by meteorological factors, including temperature, humidity, sunshine, and wind speed [2,3]. Moreover, considerable research has established a connection between air pollutant levels and influenza. A study in China identified the impact of sulfur dioxide (SO2), nitrogen dioxide (NO2), and ozone (O3) concentrations on hospital visits for influenza [4]. Other investigations have similarly indicated that the incidence of influenza-like illness is associated with elevated levels of PM2.5 [3,5].
- The coronavirus disease 2019 (COVID-19) pandemic has had profound impacts on individuals, society, healthcare systems, and the environment. The pandemic brought an uptick in the adoption of active protective measures, including mask-wearing, hand hygiene, and various social distancing practices, aimed at curbing the spread of COVID-19. Certain regulations, such as lockdowns, stay-at-home orders, and travel restrictions—which curtailed individual behavior and reduced human activity—directly influenced public health [6,7]. During many citywide lockdowns, the average number of daily emergency department visits, number of hospital admissions, and intensive care unit admission rates decreased significantly [8,9]. Additionally, the lockdown measures greatly affected air pollution worldwide. Published reports have provided evidence of reduced levels of air pollutants, such as NO2, SO2, carbon monoxide (CO), and particulate matter (PM), in national capitals, large cities, and other metropolitan areas during the COVID-19 pandemic [10,11]. Furthermore, several studies have evaluated the health benefits associated with periods of improved air quality during lockdowns. Aix et al. [12] demonstrated that long-term health risks associated with air pollution—including those for low birth weight, lung cancer, and mortality—were lower than the corresponding risks before the COVID-19 epidemic. Other reports have similarly noted overall decreases in hospital admissions for asthma and chronic obstructive pulmonary disease, which were linked to altered air pollution levels [13,14].
- With the COVID-19 outbreak, associated changes in ambient air pollutant concentrations, human behavior, hospital visitation rates, and air pollution-associated respiratory health risks have provided an opportunity to investigate how fluctuations in PM2.5 may influence the risk of viral respiratory diseases. Furthermore, little research has evaluated respiratory viral diseases, particularly influenza, in relation to changes in PM2.5 levels. This lack of investigation contrasts with the abundance of studies on air quality prior to the COVID-19 era. The present study was conducted to assess the association between short-term exposure to air pollutants and influenza hospitalizations before and during the COVID-19 outbreak in an urban area with known air pollution issues. Thailand’s Khon Kaen province, home to millions of residents, has a history of exceeding daily PM2.5 standards, largely due to a high volume of vehicle traffic and industrial activity. This led us to question whether the daily variations in air pollutant levels in this province were correlated with the risk of hospitalization for influenza. We also sought to determine whether the lockdown measures and public health hygiene practices implemented to slow the spread of COVID-19 could alter the risk of PM2.5-associated influenza infection over 2 years of the COVID-19 pandemic (2020-2021).
INTRODUCTION
- Study Location
- Khon Kaen province is a city in northeastern Thailand, covering an area of 10 886 km2. As of 2021, it had a population of 1.79 million, with 881 155 male and 911 542 female inhabitants. The province is recognized as a key educational hub, surrounded by business districts, which has led to persistent traffic congestion for years. Additionally, the widespread cultivation of sugarcane and the common practice of burning this crop to create biomass waste have contributed to longstanding air pollution issues. The province experiences elevated levels of PM2.5 following each harvest season. The study area encompassed a 50 km radius around a selected air quality monitoring station, including 14 districts within Khon Kaen and 4 districts in Maha Sarakham province, as detailed in Supplemental Material 1.
- Air Pollution and Meteorological Data
- Air pollution data were provided by the Thai Pollution Control Department (PCD), which operated an ambient air quality monitoring station in Khon Kaen province, as shown in Supplemental Material 1. To calculate the daily concentration of each air pollutant, at least 75% of the hourly values were required to be available for that day; otherwise, the day was excluded from the analysis. From 2018 to 2021, estimated daily air pollutant concentrations were determined according to the PCD’s metrics for daily concentration and acute health effects, which include PM with an aerodynamic diameter of 10 μm or less (PM10), PM2.5, and NO2 on a 24-hour average and O3 on a maximum 8-hour average. Meteorological data were provided by the Thai Meteorological Department, measured at a fixed station in central Khon Kaen. Daily meteorological variables (including temperature in degrees Celsius and humidity as a percentage), along with daily air pollutant levels, were analyzed with descriptive statistics and modeling.
- Data on Influenza-associated Hospital Visits
- Data on influenza cases (n=22 874) were obtained from the Information and Communication Technology Center of the Thai Ministry of Public Health. Influenza cases were identified based on the International Classification of Disease, 10th edition (ICD-10) codes for influenza diagnosis (ICD-10: J10-11), and these data were retrieved along with demographic information such as sex, date of birth, date of diagnosis, and district. The study enrolled hospitalized patients with influenza who resided within a 50 km radius (encompassing 18 districts) and who presumably had been exposed to ambient air pollutants in the vicinity of the air quality monitoring station.
- Statistical Analysis
- Descriptive analysis, including the determination of mean, minimum, maximum, and median values, was conducted to characterize air pollution concentrations, weather conditions, and influenza case numbers. We compared pre-COVID-19 pandemic levels with the pandemic levels of each variable using the Mann-Whitney U-test. Spearman correlation analysis was employed to quantify the relationships between weather variables and air pollutant concentrations. To evaluate the associations between hospitalization for influenza and air pollution variables, we utilized Poisson regression within a generalized additive model [15]. Sensitivity analyses were used to examine the robustness of the links between air pollutant levels and influenza hospitalizations. Independent variables, such as temperature, humidity, and time, were modeled using a smoothing spline function to account for seasonality and long-term trends. Various degrees of freedom (df ) were tested for the time trend (6-10/y), temperature (3-6/y), and relative humidity (3-6/y) within the smoothing function. Altering the df for time and meteorological factors in the smoothing function resulted in slight changes to the effect estimates of air pollutants on influenza. The results of the sensitivity analyses using different df values for time are presented in Supplemental Material 2. Based on these findings, we selected df values for time and meteorological factors that were supported by previous research [4,16]. Additionally, we incorporated the day of the week and public holidays into the model to adjust for short-term trends. The relationships in the regression model were expressed as relative risks (RRs) with 95% confidence intervals (95% CIs) for a 10 µg/m3 increase in air pollutant concentration. The single-pollutant model is represented by equation 1 as follows:
- LogE(Yt) = α + β(Xt) + ns(Temp,df = 3) + ns(Humidity,df = 3) + ns(Time,df = 7/year) + DOW + Holiday (1)
- Regarding the effects of co-pollutants, the complex interactions among various pollutants may alter the outcomes of influenza in different ways. To account for the influence of multiple pollutants, we employed the same fundamental structure used in the single-pollutant model. The multi-pollutant model (equation 2) is expressed as follows:
- LogE(Yt) = α + β1(X1t) + β2(X2t) + ⋯ + Bn(Xnt) + ns(Temp,df = 3) + ns(Humidity,df = 3) + ns(Time,df = 7/year) + Hoilday (2)
- t is the day of the observation; E(Yt) represents the number of daily influenza visits on day t (cases/day); α is the model intercept; β1 to βn are the regression coefficients for each air pollutant; X1t to Xnt denote the daily average concentration of a pollutant (n), expressed in µg/m3; ns represents a natural smoothing spline function; df indicates the number of degrees of freedom; Temp is the daily average temperature (°C); Humidity is the daily average relative humidity (%); Time represents the date (ranging from January 1, 2018 to December 31, 2021), adjusted from the original date (calendar time); DOW is a polytomous variable indicating the day of the week; and Holiday signifies a public holiday in Thailand.
- Exposure to air pollutants is known to have delayed effects on human health [17]. To investigate the possible exposure lag effect between air pollutant concentrations and the number of influenza cases, and considering the typical incubation periods of respiratory infections (within 1 week) [16,18], models with various lag structures were employed. These models, which accounted for air pollutant concentrations from lag day 0 to day 6, included both single-day lags (e.g., lag 0, 1) and cumulative-day lags (e.g., lag 0-1, 0-2), building upon previous single-pollutant and multi-pollutant model analyses. Subgroup analysis was utilized to examine the effect modification for several significant variables. Separate analyses were conducted by season—summer, rainy, and winter, reflecting the weather and climate of Thailand–to evaluate the impact of pollutants across these distinct periods. To assess the risk difference between 2 periods, a Z-test was applied. Statistical hypothesis testing for lockdown interaction was performed using null and alternative hypotheses, denoted as H0: RRbefore=RRduring and HA: RRbefore≠RRduring, respectively, where “before” and “during” refer to the timing of the COVID-19 outbreak. These timeseries analyses were conducted using R version 4.1.3 (packages: mgcv, dlnm, and splines; R Foundation for Statistical Computing, Vienna, Austria).
- Ethics Statement
- This study was approved by the Graduate Program of Faculty of Science at Chulalongkorn University, Thailand. The present study is considered exempt from institutional review board approval since this study used secondary data without any personal identifiers and did not contain confidential patient data. For this type of study, informed consent from the subjects is not required.
METHODS
- Several variables in Table 1 showed significant differences between the periods before and during the COVID-19 pandemic. The daily average number of influenza patients decreased from approximately 22 (range, 0 to 107) cases per day before the outbreak to 16 (range, 0 to 71) during the pandemic (p<0.001). The 24-hour mean concentrations of PM10, PM2.5, and NO2 were higher before the COVID-19 outbreak, when human activities were proceeding normally, compared to the period during the pandemic when activities were reduced due to lockdowns, leading to a substantial decrease in vehicle emissions. Notably, the 24-hour mean PM2.5 level decreased significantly from 32.61 µg/m3 (range, 10.33 to 109.29) to 29.44 µg/m3 (range, 9.04 to 87.50; p<0.001). However, the 8-hour mean concentration of O3—a secondary pollutant formed photochemically by nitrogen oxides (NOx) and volatile organic compounds (VOCs)—was significantly higher during the COVID-19 pandemic than before (p<0.001). Regarding weather conditions, no statistically significant differences were found in temperature and relative humidity between the periods.
- The partial Spearman correlation analyses presented in Table 2 reveal strong positive correlations among the pollutants before the COVID-19 outbreak, particularly between PM10 and PM2.5 (r=0.96), PM10 and NO2 (r=0.75), and NO2 and PM2.5 (r=0.74, p<0.001). However, these correlations were slightly lower during the pandemic, with coefficients of 0.98, 0.80, and 0.79, respectively (p<0.001). During the COVID-19 period, we observed stronger positive correlations of O3 with PM10 (r=0.78), PM2.5 (r=0.79), and NO2 (r=0.61) at p<0.001 compared to the pre-outbreak period (which displayed values of r=0.43, 0.43, and 0.52, respectively, at p<0.001). The higher correlations between NO2 and O3, as well as between VOC-bound PM and O3, during the COVID-19 outbreak suggest that the photochemical reaction of O3 might have been more efficient. Temperature showed no notable correlation with O3 (r=0.07).
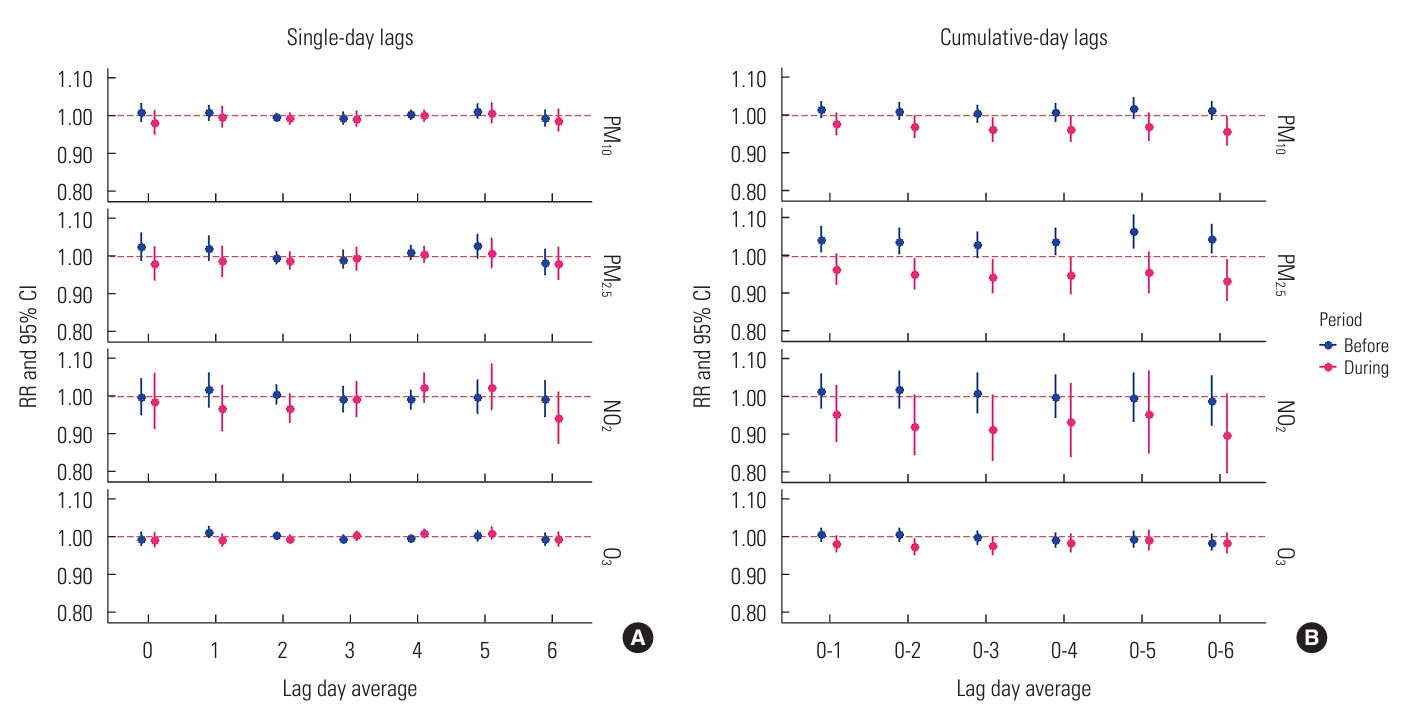
- The effects of single air pollutant concentrations on influenza varied across both single-day and cumulative-day exposure lags, as depicted in Figure 1. We observed no significant associations between levels of PM10, PM2.5, NO2, and O3 and hospitalizations for influenza across single-day lags from lag 0 to lag 6 (Figure 1A). In the cumulative-day lag model for PM10, PM2.5, and NO2, the RRs from prior to the COVID-19 outbreak were higher than those observed during the pandemic, with this difference being particularly pronounced for PM2.5, as shown in a subplot of Figure 1B. Each 10 µg/m3 increase in the cumulative-lag day average of PM2.5 was positively associated with increased RR of hospitalization for influenza at cumulative-day lags of 0-1, 0-2, 0-4, 0-5, and 0-6. However, during the COVID-19 period, a similar increase in single pollutant levels was not significantly associated with an elevated risk of influenza. Although the 8-hour mean level of O3 was higher during the pandemic period, we did not find an associated change in the risk of O3-induced influenza.
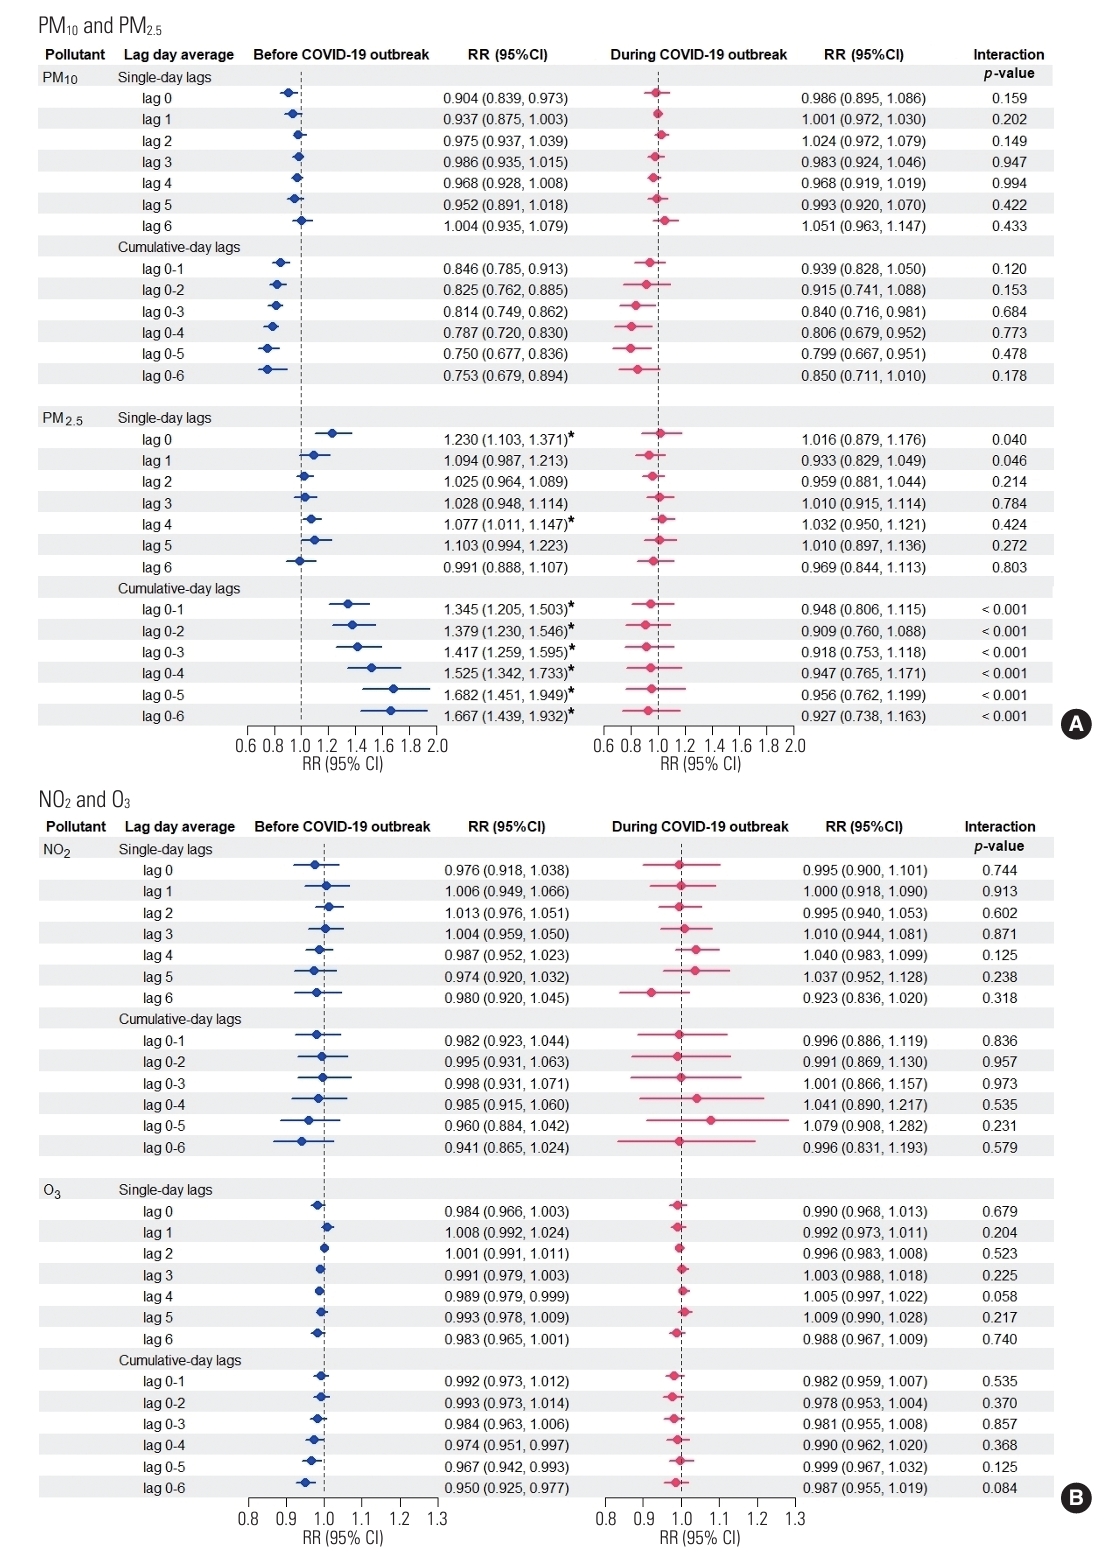
- In the multi-pollutant model analyses (Figure 2), results from the pre-COVID-19 period indicated that only a 10 µg/m3 increase in PM2.5 maintained its strong adverse effect, significantly increasing the risk of influenza even after adjustment for co-pollutants, weather conditions, and time trends. This significance was observed for lag 0 (RR, 1.230; 95% CI, 1.103 to 1.371) and lag 4 (RR, 1.077; 95% CI, 1.011 to 1.147), as well as across all cumulative-day lags: lag 0-1 (RR, 1.345; 95% CI, 1.205 to 1.503), lag 0-2 (RR, 1.379; 95% CI, 1.230 to 1.546), lag 0-3 (RR, 1.417; 95% CI, 1.259 to 1.595), lag 0-4 (RR, 1.525; 95% CI, 1.342 to 1.733), lag 0-5 (RR, 1.682; 95% CI, 1.451 to 1.949), and lag 0-6 (RR, 1.667; 95% CI, 1.439 to 1.932) (Figure 2A). These significant RRs consistently demonstrated that the increased risk of hospital admission for influenza due to PM2.5 was detectable regardless of the exposure lag. The most pronounced acute effect was observed when residents were continuously exposed to elevated levels of PM2.5 for up to 5 days (lag 0-5). However, during the COVID-19 period, we observed no significant increase in influenza risk associated with PM10, PM2.5, NO2, or O3 levels. Furthermore, the RRs of influenza associated with PM2.5 concentration were significantly higher before the outbreak at single-day lag 0, single-day lag 1, and all cumulative-day lags (p<0.05), confirming the impact of lockdown interventions.
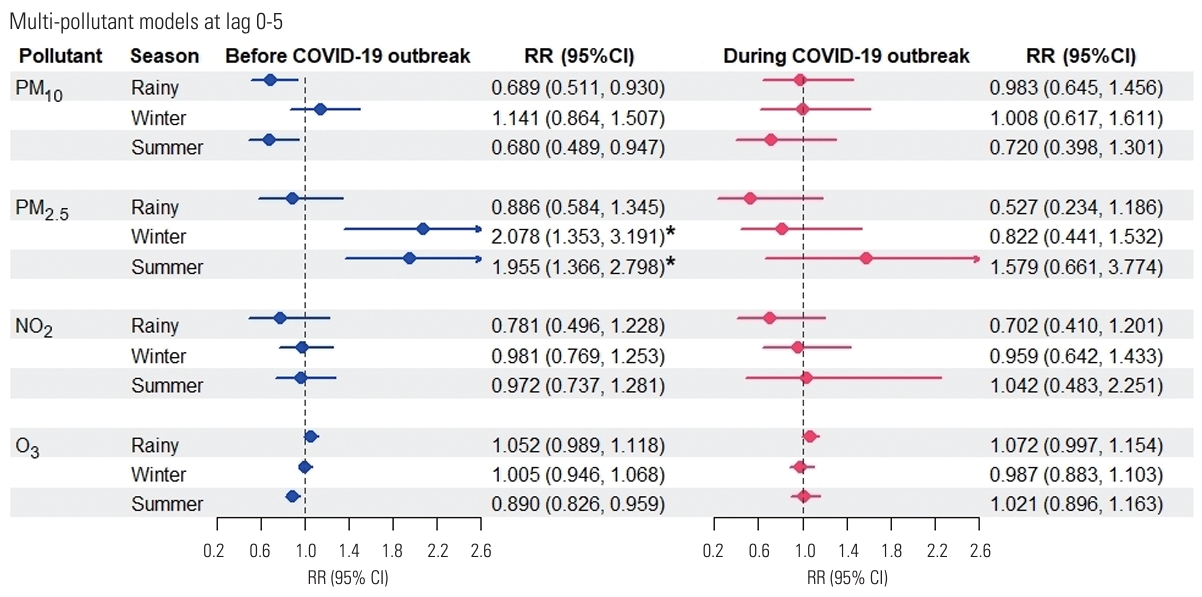
- Regarding seasonal effect modification, in the multi-pollutant analyses, the highest RR for influenza prior to the COVID-19 outbreak was that associated with each 10 µg/m3 increase in PM2.5 concentration over lag days 0-5 (RR, 1.682; 95% CI, 1.451 to 1.949) when averaged over the entire year. Seasonal analysis further revealed that PM2.5 level was significantly associated with influenza risk in the winter (RR, 2.078; 95% CI, 1.353 to 3.191) and summer (RR, 1.955; 95% CI, 1.366 to 2.798) before the COVID-19 period. The highest RRs were observed in the winter season, indicating that this period was the most susceptible to PM2.5 concentrations (Figure 3). This study reported the highest PM2.5-associated influenza risk during the winter, suggesting that this season poses the greatest danger in terms of cumulative population exposure to PM2.5 over a 0-5 day period.
RESULTS
- In this time-series study, we evaluated the effects of air pollutants (PM10, PM2.5, NO2, and O3) on influenza. PM2.5, in both single-pollutant and multi-pollutant models, was found to play a key role in hospital visits for influenza, with a significantly greater impact during the winter and summer seasons before the COVID-19 outbreak. The study provides a comprehensive analysis of the RRs of influenza associated with PM2.5 exposure during the COVID-19 pandemic compared to the period before the outbreak.
- While the COVID-19 pandemic profoundly impacted people’s lives as well as the environment, air pollution demonstrated signs of improvement due to decreased emissions from various sources. We observed a significant difference in ambient PM2.5 levels from before to during the COVID-19 period, aligning with findings from numerous countries. Research indicates a reduction in ground-level PM2.5 concentrations during lockdowns in major cities worldwide [19,20]. Piccoli et al. [21] found that this decrease in PM2.5 was largely attributable to reduced combustion of fossil fuels, including car exhaust and coal burning. Stringent epidemic control measures, which curtailed traffic, industry, and commercial activities, led to significant declines in air pollution levels [11]. However, the trend for O3 opposed those of other air co-pollutants. In Khon Kaen province, we observed that the measures implemented during the COVID-19 period resulted in a reduction of air pollutants, with the exception of O3, which increased, echoing findings from other recent studies [12,22]. The rise in O3 levels was linked to changes in nitrogen oxides (NO), hydrocarbons, and meteorological conditions that intensified photochemical reactions. As a secondary pollutant, the decrease in NOx and VOCs during a lockdown could alter the O3 concentration within the O3-VOC-NOx system [23,24]. Furthermore, our findings regarding changes in air pollution paralleled a decrease in hospitalizations during the COVID-19 outbreak, with a significant drop in influenza cases like that observed previously in some cities of the United States, Australia, Chile, South Africa, and Italy where incidence rates as well as hospital admissions for parainfluenza and influenza viruses A and B also saw substantial reductions during lockdowns [25,26]. These studies concluded that the substantial reduction in hospitalizations for influenza was primarily due to COVID-19 containment measures.
- In single-pollutant models, only PM2.5 demonstrated a significant effect on hospitalizations for influenza during the preCOVID-19 period. In this study, we observed the cumulativeday lags of the impact of PM2.5 levels on influenza. Similarly, Zhang et al. [27] found that a 10 μg/m3 increase in community-level PM2.5 was statistically associated with influenza risk on the day of case confirmation (lag 0) and across a 6-day moving average (lag 0-5 days). Additionally, Croft et al. [18] reported in a New York study that a significant association was present between higher rates of influenza and increased PM2.5 levels over the preceding 1-7 days. These findings, along with our own, indicate that the effects of PM2.5 concentrations on hospitalization for influenza manifest within 1 week. Traditionally, the epidemiological understanding of respiratory infections is that they are caused by pathogens and transmitted directly from person to person. Alternatively, PM may act as a vector for the transport of pathogenic microorganisms [28]. Supporting this, Morris et al. [29] provided evidence that PM2.5 impacts influenza-like illness within a lag period of 0-4 days, which aligns with the incubation period of the influenza virus. Consequently, our study corroborates other research in demonstrating the short-term risk of influenza associated with PM2.5 exposure.
- The present multi-pollutant analyses included combinations of PM10, PM2.5, NO2, and O3. The results provide limited evidence of an association between influenza cases and PM10 levels. The association between influenza and PM10 concentration decreased after controlling for PM2.5, NO2, and O3 levels, and this effect was lower in the multi-day lag models. This finding suggests that the effect of PM10 is only marginally independent. The higher correlations between levels of PM10 and PM2.5, as well as NO2, could account for the reduced RR of PM10 in multi-pollutant models [16]. One key finding of this study was that, even after adjusting the impact of PM2.5 for concentrations of other pollutants, a strong and significant association with influenza was evident. This may be due in part to the critical issue of high PM2.5 concentrations in this province. In another study, Lu et al. [30] observed the effects of air pollution on laboratoryconfirmed influenza cases, finding that PM2.5 concentrations had statistically significant effects after adjusting for meteorological factors and other pollutants. From a toxicological perspective, PM2.5 represents a complex mixture that includes inorganic components. This fine PM can damage the cells of the respiratory tract. Schulze et al. [31] attempted to elucidate the mechanism by which PM2.5 interferes with alveolar macrophages and pulmonary epithelial cells, stimulates cytokine release, increases oxidative stress, and leads to inflammation of the respiratory tract. Exposure to PM can also heighten the sensitivity of human respiratory epithelial cells, enhancing the attachment and entry of the influenza virus and, consequently, making infection more likely [32].
- Seasonal analysis revealed that prior to the COVID-19 outbreak, the impact of PM2.5 levels on influenza was most pronounced during the winter, followed by the summer. Similar effects have been observed in the winter season in previous studies [4,33]. The seasonal variation in effect sizes for influenza may be attributed to differences in the concentrations and components of pollutants, as PM2.5 levels are typically higher in the winter and summer (both dry seasons) compared to the rainy season [34]. Despite the peak pollution levels of PM in the dry season, numerous factors could exacerbate the severity of influenza virus infections. These include environmental factors such as humidity and temperature, which can irritate organ tissue, affect the body’s immune response, and influence viral persistence and transmission [35,36]. Additionally, the host’s immune status—which is linked to seasonality—and seasonal behavioral changes likely play a role. For instance, people tend to spend more time outdoors during the dry season than in the rainy season, increasing their exposure to air pollution [5,34].
- During the COVID-19 pandemic, no pollutant was significantly associated with an increased risk of influenza in either single-pollutant or multi-pollutant models. Furthermore, results from cumulative-day lags models indicated that the RRs related to air pollution decreased. The multi-pollutant model of influenza highlighted that the RRs associated with PM2.5 were significantly higher before the COVID-19 outbreak than during the pandemic. In another study, Wang et al. [37] sought to elucidate the impact of the COVID-19 pandemic on the incidence of respiratory infectious diseases and the reduction of air pollutants in the Yangtze River Delta, Shanghai. Their study provided additional evidence that PM2.5, O3, and CO levels were significantly correlated with a decrease in influenza incidence. The toxicity of air pollution components and sources of this pollution may have varied between the 2 periods, potentially contributing to different respiratory health risks. Additionally, beyond the reduction of air pollutant emissions, the findings may also stem from the efficacy of COVID-19 measures that also led to a decrease in the spread of influenza. Another key concept examined was the reduced respiratory health risk from air pollution due to the restrictive and preventive measures implemented to control the COVID-19 outbreak [38,39]. People spent less time outdoors, particularly during lockdowns, which likely resulted in reduced exposure to air pollution. The regulations enforced during the lockdown, such as working from home, closing schools, shutting down non-essential businesses, and suspending events, likely played a role in interrupting the transmission of influenza. Additionally, some studies have noted an increase in active protective behaviors, including mask-wearing, hand hygiene, and restrictions on social gatherings, which have contributed to the control of respiratory diseases [6,7]. Overall, it is plausible that the interventions to manage COVID-19, combined with improvements in air quality and changes in human behavior, have played a part in lowering the risk of influenza.
- This study had several limitations. First, we were unable to estimate the health effects of all air pollutants due to the integrity of the data for each pollutant. Second, we directly applied the concentrations of air pollutants to represent exposure levels experienced by the people. We cannot precisely determine the extent to which the reduction in influenza hospitalizations was due to decreased exposure to ambient air pollution. Specifically, numerous interactions and factors are associated with hospitalization. We did not account for changes in people’s behaviors resulting from COVID-19 control policies, such as increased rates of mask-wearing and hand hygiene. Additionally, we did not consider the decrease in outdoor activities and the elevated stay-at-home rate, particularly during the lockdown period. These factors could have reduced or avoided exposure to ambient air pollution and may have acted as confounding variables.
- The outbreak of COVID-19 was catastrophic. This study does not provide evidence that the outbreak conferred any benefits to human health. Instead, it underscores the established understanding that air pollutants have detrimental health impacts. Our results suggest that lower RRs for influenza may be attainable with reduced PM2.5 concentrations. These findings are associated with COVID-19 pandemic control measures that effectively mitigated respiratory health risks. Furthermore, public health policies and environmental improvements implemented during the COVID-19 period serve as evidence supporting the reduction of respiratory infectious disease risk. This represents the first study to assess the RR of influenza associated with air pollution by comparing data from before and during the COVID-19 pandemic in Thailand, potentially heightening awareness of our responsibility to maintain air quality.
DISCUSSION
Supplemental Materials
Supplementary Material 1.
Supplementary Material 2.
-
Conflict of Interest
The authors have no conflicts of interest associated with the material presented in this paper.
-
Funding
None.
-
Author Contributions
Both authors contributed equally to conceiving the study, analyzing the data, and writing this paper.
Notes
Acknowledgements
| Variables |
Before COVID-19 outbreak |
During COVID-19 period |
p-value1 | ||
|---|---|---|---|---|---|
| Mean±SD | Median (Min-Max) | Mean±SD | Median (Min-Max) | ||
| Total influenza cases/day | 21.55±18.53 | 15 (0-107) | 16.08±14.11 | 11 (0-71) | <0.001 |
| Age (y) | |||||
| 0-17 | 12.00±11.19 | 8 (0-67) | 8.05±6.77 | 6 (0-38) | <0.001 |
| 18-64 | 8.20±7.23 | 6 (0-44) | 6.88±7.25 | 4 (0-39) | <0.001 |
| ≥65 | 1.37±1.56 | 1 (0-13) | 1.15±1.60 | 1 (0-9) | <0.001 |
| Sex | |||||
| Male | 10.18±8.78 | 7 (0-50) | 7.52±6.69 | 6 (0-38) | <0.001 |
| Female | 11.38±10.35 | 8 (0-63) | 8.57±8.01 | 6 (0-40) | <0.001 |
| Pollutant concentration (µg/m3) | |||||
| PM10 (24-hr mean) | 55.59±26.09 | 48.62 (17.17-163.67) | 54.71±24.62 | 48.24 (19.30-137.79) | 0.630 |
| PM2.5 (24-hr mean) | 32.61±17.75 | 26.83 (10.33-109.29) | 29.44±15.99 | 24.23 (9.04-87.50) | <0.001 |
| NO2 (24-hr mean) | 18.24±10.22 | 16.69 (2.22-68.97) | 17.63±9.68 | 15.53 (2.32-61.69) | 0.373 |
| O3 (8-hr mean) | 78.15±59.60 | 64.75 (3.27-242.21) | 103.25±38.47 | 101.84 (34.78-192.39) | <0.001 |
| Weather conditions | |||||
| Temperature (°C) | 27.43±2.57 | 27.66 (17.54-34.20) | 27.14±2.93 | 27.35 (14.84-34.08) | 0.452 |
| Relative humidity (%) | 70.09±11.72 | 70.10 (30.50-99.12) | 70.87±11.92 | 70.38 (38.62-96.46) | 0.292 |
| Variables |
Before COVID-19 outbreak |
During COVID-19 period |
||||||||
|---|---|---|---|---|---|---|---|---|---|---|
| PM10 | PM2.5 | NO2 | O3 | Temp | PM10 | PM2.5 | NO2 | O3 | Temp | |
| PM10 | 1.00 | 1.00 | ||||||||
| PM2.5 | 0.96*** | 1.00 | 0.98*** | 1.00 | ||||||
| NO2 | 0.75*** | 0.74*** | 1.00 | 0.80*** | 0.79*** | 1.00 | ||||
| O3 | 0.43*** | 0.43*** | 0.52*** | 1.00 | 0.78*** | 0.79*** | 0.61*** | 1.00 | ||
| Temp | 0.02 | 0.05 | -0.17*** | 0.26*** | 1.00 | -0.07* | -0.06 | -0.23*** | 0.07 | 1.00 |
| Relative humidity | -0.69*** | -0.62*** | -0.62*** | -0.60*** | -0.08* | -0.79*** | -0.75*** | -0.56*** | -0.72*** | -0.06 |
- 1. Kumar V. Influenza in children. Indian J Pediatr 2017;84(2):139-143. https://doi.org/10.1007/s12098-016-2232-xArticlePubMed
- 2. Lam HC, Chan EY, Goggins WB 3rd. Comparison of short-term associations with meteorological variables between COPD and pneumonia hospitalization among the elderly in Hong Kong-a time-series study. Int J Biometeorol 2018;62(8):1447-1460. https://doi.org/10.1007/s00484-018-1542-2ArticlePubMed
- 3. Toczylowski K, Wietlicka-Piszcz M, Grabowska M, Sulik A. Cumulative effects of particulate matter pollution and meteorological variables on the risk of influenza-like illness. Viruses 2021;13(4):556. https://doi.org/10.3390/v13040556ArticlePubMedPMC
- 4. Meng Y, Lu Y, Xiang H, Liu S. Short-term effects of ambient air pollution on the incidence of influenza in Wuhan, China: a time-series analysis. Environ Res 2021;192: 110327. https://doi.org/10.1016/j.envres.2020.110327ArticlePubMed
- 5. Lindner-Cendrowska K, Bröde P. Impact of biometeorological conditions and air pollution on influenza-like illnesses incidence in Warsaw. Int J Biometeorol 2021;65(6):929-944. https://doi.org/10.1007/s00484-021-02076-2ArticlePubMedPMC
- 6. Hsieh CC, Lin CH, Wang WY, Pauleen DJ, Chen JV. The outcome and implications of public precautionary measures in Taiwandeclining respiratory disease cases in the COVID-19 pandemic. Int J Environ Res Public Health 2020;17(13):4877. https://doi.org/10.3390/ijerph17134877ArticlePubMedPMC
- 7. Hatoun J, Correa ET, Donahue SM, Vernacchio L. Social distancing for COVID-19 and diagnoses of other infectious diseases in children. Pediatrics 2020;146(4):e2020006460. https://doi.org/10.1542/peds.2020-006460ArticlePubMed
- 8. Kruizinga MD, Peeters D, van Veen M, van Houten M, Wieringa J, Noordzij JG, et al. The impact of lockdown on pediatric ED visits and hospital admissions during the COVID19 pandemic: a multicenter analysis and review of the literature. Eur J Pediatr 2021;180(7):2271-2279. https://doi.org/10.1007/s00431-021-04015-0ArticlePubMedPMC
- 9. Morello F, Bima P, Ferreri E, Chiarlo M, Balzaretti P, Tirabassi G, et al. After the first wave and beyond lockdown: long-lasting changes in emergency department visit number, characteristics, diagnoses, and hospital admissions. Intern Emerg Med 2021;16(6):1683-1690. https://doi.org/10.1007/s11739-021-02667-2ArticlePubMedPMC
- 10. Briz-Redón Á, Belenguer-Sapiña C, Serrano-Aroca Á. Changes in air pollution during COVID-19 lockdown in Spain: a multicity study. J Environ Sci (China) 2021;101: 16-26. https://doi.org/10.1016/j.jes.2020.07.029ArticlePubMed
- 11. Venter ZS, Aunan K, Chowdhury S, Lelieveld J. COVID-19 lockdowns cause global air pollution declines. Proc Natl Acad Sci U S A 2020;117(32):18984-18990. https://doi.org/10.1073/pnas.2006853117ArticlePubMedPMC
- 12. Aix ML, Petit P, Bicout DJ. Air pollution and health impacts during the COVID-19 lockdowns in Grenoble, France. Environ Pollut 2022;303: 119134. https://doi.org/10.1016/j.envpol.2022.119134ArticlePubMedPMC
- 13. Sigala I, Giannakas T, Giannakoulis VG, Zervas E, Brinia A, Gianiou N, et al. Effect of COVID-19-related lockdown οn hospital admissions for asthma and COPD exacerbations: associations with air pollution and patient characteristics. J Pers Med 2021;11(9):867. https://doi.org/10.3390/jpm11090867ArticlePubMedPMC
- 14. Quintyne KI, Kelly C, Sheridan A, Kenny P, O’Dwyer M. COVID-19 transport restrictions in Ireland: impact on air quality and respiratory hospital admissions. Public Health 2021;198: 156-160. https://doi.org/10.1016/j.puhe.2021.07.008ArticlePubMed
- 15. Dominici F, McDermott A, Zeger SL, Samet JM. On the use of generalized additive models in time-series studies of air pollution and health. Am J Epidemiol 2002;156(3):193-203. https://doi.org/10.1093/aje/kwf062ArticlePubMed
- 16. Huang L, Zhou L, Chen J, Chen K, Liu Y, Chen X, et al. Acute effects of air pollution on influenza-like illness in Nanjing, China: a population-based study. Chemosphere 2016;147: 180-187. https://doi.org/10.1016/j.chemosphere.2015.12.082ArticlePubMed
- 17. Kan H, London SJ, Chen G, Zhang Y, Song G, Zhao N, et al. Differentiating the effects of fine and coarse particles on daily mortality in Shanghai, China. Environ Int 2007;33(3):376-384. https://doi.org/10.1016/j.envint.2006.12.001ArticlePubMedPMC
- 18. Croft DP, Zhang W, Lin S, Thurston SW, Hopke PK, Masiol M, et al. The association between respiratory infection and air pollution in the setting of air quality policy and economic change. Ann Am Thorac Soc 2019;16(3):321-330. https://doi.org/10.1513/AnnalsATS.201810-691OCArticlePubMedPMC
- 19. Dey T, Tyagi P, Sabath MB, Kamareddine L, Henneman L, Braun D, et al. Counterfactual time series analysis of short-term change in air pollution following the COVID-19 state of emergency in the United States. Sci Rep 2021;11(1):23517. https://doi.org/10.1038/s41598-021-02776-0ArticlePubMedPMC
- 20. Fu F, Purvis-Roberts KL, Williams B. Impact of the COVID-19 pandemic lockdown on air pollution in 20 major cities around the world. Atmosphere (Basel) 2020;11(11):1189. https://doi.org/10.3390/atmos11111189Article
- 21. Piccoli A, Agresti V, Balzarini A, Bedogni M, Bonanno R, Collino E, et al. Modeling the effect of COVID-19 lockdown on mobility and NO2 concentration in the Lombardy region. Atmosphere (Basel) 2020;11(12):1319. https://doi.org/10.3390/atmos11121319Article
- 22. Li J, Tartarini F. Changes in air quality during the COVID-19 lockdown in Singapore and associations with human mobility trends. Aerosol Air Qual Res 2020;20(8):1748-1758. https://doi.org/10.4209/aaqr.2020.06.0303Article
- 23. Tobías A, Carnerero C, Reche C, Massagué J, Via M, Minguillón MC, et al. Changes in air quality during the lockdown in Barcelona (Spain) one month into the SARS-CoV-2 epidemic. Sci Total Environ 2020;726: 138540. https://doi.org/10.1016/j.scitotenv.2020.138540ArticlePubMedPMC
- 24. Venter ZS, Barton DN, Gundersen V, Figari H, Nowell M. Urban nature in a time of crisis: recreational use of green space increases during the COVID-19 outbreak in Oslo, Norway. Environ Res Lett 2020;15: 104075. https://doi.org/10.1088/1748-9326/abb396Article
- 25. Nenna R, Matera L, Pierangeli A, Oliveto G, Viscido A, Petrarca L, et al. First COVID-19 lockdown resulted in most respiratory viruses disappearing among hospitalised children, with the exception of rhinoviruses. Acta Paediatr 2022;111(7):1399-1403. https://doi.org/10.1111/apa.16326ArticlePubMedPMC
- 26. Olsen SJ, Azziz-Baumgartner E, Budd AP, Brammer L, Sullivan S, Pineda RF, et al. Decreased influenza activity during the COVID-19 pandemic-United States, Australia, Chile, and South Africa, 2020. Am J Transplant 2020;20(12):3681-3685. https://doi.org/10.1111/ajt.16381ArticlePubMedPMC
- 27. Zhang R, Lai KY, Liu W, Liu Y, Lu J, Tian L, et al. Community-level ambient fine particulate matter and seasonal influenza among children in Guangzhou, China: a Bayesian spatiotemporal analysis. Sci Total Environ 2022;826: 154135. https://doi.org/10.1016/j.scitotenv.2022.154135ArticlePubMed
- 28. Chen PS, Tsai FT, Lin CK, Yang CY, Chan CC, Young CY, et al. Ambient influenza and avian influenza virus during dust storm days and background days. Environ Health Perspect 2010;118(9):1211-1216. https://doi.org/10.1289/ehp.0901782ArticlePubMedPMC
- 29. Morris JA, Kasel JA, Saglam M, Knight V, Loda FA. Immunity to influenza as related to antibody levels. N Engl J Med 1966;274(10):527-535. https://doi.org/10.1056/NEJM196603102741001ArticlePubMed
- 30. Lu B, Wang Y, Zhu Z, Zhang Z, Dong T, Li F, et al. Epidemiological and genetic characteristics of influenza virus and the effects of air pollution on laboratory-confirmed influenza cases in Hulunbuir, China, from 2010 to 2019. Epidemiol Infect 2020;148: e159. https://doi.org/10.1017/S0950268820001387ArticlePubMedPMC
- 31. Schulze F, Gao X, Virzonis D, Damiati S, Schneider MR, Kodzius R. Air quality effects on human health and approaches for its assessment through microfluidic chips. Genes (Basel) 2017;8(10):244. https://doi.org/10.3390/genes8100244ArticlePubMedPMC
- 32. Jaspers I, Ciencewicki JM, Zhang W, Brighton LE, Carson JL, Beck MA, et al. Diesel exhaust enhances influenza virus infections in respiratory epithelial cells. Toxicol Sci 2005;85(2):990-1002. https://doi.org/10.1093/toxsci/kfi141ArticlePubMed
- 33. Zhang R, Li Y, Bi P, Wu S, Peng Z, Meng Y, et al. Seasonal associations between air pollutants and influenza in 10 cities of southern China. Int J Hyg Environ Health 2023;252: 114200. https://doi.org/10.1016/j.ijheh.2023.114200ArticlePubMed
- 34. Jainonthee C, Wang YL, Chen CW, Jainontee K. Air pollutionrelated respiratory diseases and associated environmental factors in Chiang Mai, Thailand, in 2011-2020. Trop Med Infect Dis 2022;7(11):341. https://doi.org/10.3390/tropicalmed7110341ArticlePubMedPMC
- 35. Sooryanarain H, Elankumaran S. Environmental role in influenza virus outbreaks. Annu Rev Anim Biosci 2015;3: 347-73. https://doi.org/10.1146/annurev-animal-022114-111017ArticlePubMed
- 36. Deng L, Xu H, Liu P, Wu S, Shi Y, Lv Y, et al. Prolonged exposure to high humidity and high temperature environment can aggravate influenza virus infection through intestinal flora and Nod/RIP2/NF-κB signaling pathway. Vet Microbiol 2020;251: 108896. https://doi.org/10.1016/j.vetmic.2020.108896ArticlePubMed
- 37. Wang L, Wang K, Zhong H, Zhao N, Xu W, Yang Y, et al. The effect of coronavirus 2019 disease control measures on the incidence of respiratory infectious disease and air pollutant concentrations in the Yangtze River Delta Region, China. Int J Environ Res Public Health 2022;19(3):1286. https://doi.org/10.3390/ijerph19031286ArticlePubMedPMC
- 38. Lee HH, Lin SH. Effects of COVID-19 prevention measures on other common infections, Taiwan. Emerg Infect Dis 2020;26(10):2509-2511. https://doi.org/10.3201/eid2610.203193ArticlePubMedPMC
- 39. Soo RJ, Chiew CJ, Ma S, Pung R, Lee V. Decreased Influenza Incidence under COVID-19 control measures, Singapore. Emerg Infect Dis 2020;26(8):1933-1935. https://doi.org/10.3201/eid2608.201229ArticlePubMedPMC
 PubReader
 ePub Link
 Cite
Cite


