
Articles
- Page Path
- HOME > J Prev Med Public Health > Volume 46(5); 2013 > Article
-
Original Article
A Prospective Cohort Study on the Relationship of Sleep Duration With All-cause and Disease-specific Mortality in the Korean Multi-center Cancer Cohort Study - Yohwan Yeo1, Seung Hyun Ma1,2, Sue Kyung Park1,2,3, Soung-Hoon Chang4, Hai-Rim Shin5, Daehee Kang1,2,3, Keun-Young Yoo1
-
Journal of Preventive Medicine and Public Health 2013;46(5):271-281.
DOI: https://doi.org/10.3961/jpmph.2013.46.5.271
Published online: September 30, 2013
1Department of Preventive Medicine, Seoul National University College of Medicine, Seoul, Korea.
2Cancer Research Institute, Seoul National University, Seoul, Korea.
3Department of Biomedical Science, Seoul National University Graduate School, Seoul, Korea.
4Department of Preventive Medicine, Konkuk University, Seoul, Korea.
5Non-communicable Disease and Health Promotion, Western Pacific Regional Office, World Health Organization, Manila, Philippines.
- Corresponding author: Keun-Young Yoo, MD, PhD. 103 Daehak-ro, Jongno-gu, Seoul 110-799, Korea. Tel: +82-2-740-8324, Fax: +82-2-747-4830, kyyoo@snu.ac.kr
Copyright © 2013 The Korean Society for Preventive Medicine
This is an Open Access article distributed under the terms of the Creative Commons Attribution Non-Commercial License (http://creativecommons.org/licenses/by-nc/3.0/) which permits unrestricted non-commercial use, distribution, and reproduction in any medium, provided the original work is properly cited.
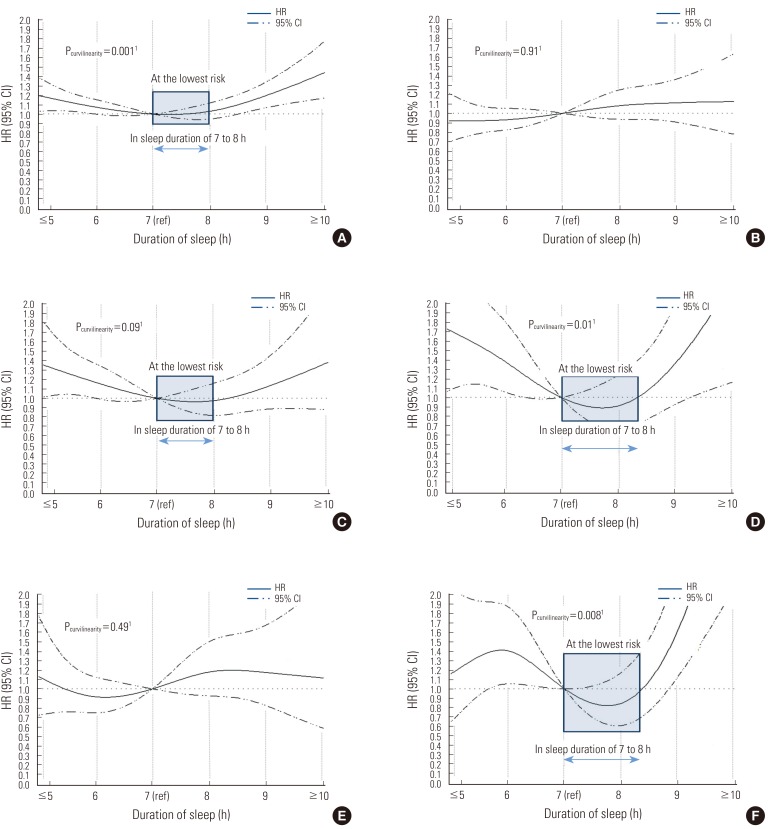
Figure & Data
References
Citations
- The U-Shaped Association between Sleep Duration, All-Cause Mortality and Cardiovascular Risk in a Hispanic/Latino Clinically Based Cohort
Mario Henríquez-Beltrán, Jorge Dreyse, Jorge Jorquera, Jorge Jorquera-Diaz, Constanza Salas, Isabel Fernandez-Bussy, Gonzalo Labarca
Journal of Clinical Medicine.2023; 12(15): 4961. CrossRef - Trends in sleep duration in Korea: The Korean time use survey
Yoonhyuk Jang, Jin Sun Jun, Ki-Young Jung
Sleep Medicine.2023; 103: 24. CrossRef - Night-time smartphone use, sleep duration, sleep quality, and menstrual disturbances in young adult women: A population-based study with high-resolution tracking data
Elin Rosenbek Severinsen, Thea Otte Andersen, Agnete Skovlund Dissing, Andreas Kryger Jensen, Christoffer Sejling, Nina la Cour Freiesleben, Henriette Svarre Nielsen, Naja Hulvej Rod
SLEEP Advances.2023;[Epub] CrossRef - Association of night-time sleep duration and daytime napping with all-cause and cause-specific mortality in older British men: Findings from the British Regional Heart Study
Anthony Chen, Lucy Lennon, Olia Papacosta, S. Goya Wannamethee
Sleep Medicine.2023; 109: 32. CrossRef - Causal associations of sleep traits with cancer incidence and mortality
Shanshan Tian, Longtao Huangfu, Yanping Bao, Sizhi Ai, Suhua Chang, Qianwen Wang, Ximei Zhu, Wei Yan, Jie Shi, Le Shi, Jiahui Deng, Lin Lu
Frontiers in Genetics.2023;[Epub] CrossRef - Protective Effects of Melatonin in High-Fat Diet-Induced Hepatic Steatosis via Decreased Intestinal Lipid Absorption and Hepatic Cholesterol Synthesis
Hyungjune Ku, Yeonji Kim, Alvin Lyle Kim, Garam Lee, Youngsik Choi, Bukyung Kim
Endocrinology and Metabolism.2023; 38(5): 557. CrossRef - Sleep Duration, Comorbidities, and Mortality in Korean Health Examinees: A Prospective Cohort Study
Sukhong Min, Woo-Kyoung Shin, Katherine De la Torre, Dan Huang, Hyung-Suk Yoon, Aesun Shin, Ji-Yeob Choi, Daehee Kang
Journal of Preventive Medicine and Public Health.2023; 56(5): 458. CrossRef - Sleep and daytime sleepiness in elite athletes and sedentary individuals
M. Jemal, K. Trabelsi, O. Boukhris, A. Ammar, C.C.T. Clark, H. Chtourou
Science & Sports.2022; 37(1): 31. CrossRef - Sleep duration and mortality, influence of age, retirement, and occupational group
Torbjörn Åkerstedt, Ylva Trolle‐Lagerros, Linnea Widman, Weimin Ye, Hans‐Olov Adami, Rino Bellocco
Journal of Sleep Research.2022;[Epub] CrossRef - Sleep Duration/Quality With Health Outcomes: An Umbrella Review of Meta-Analyses of Prospective Studies
Chang Gao, Jiao Guo, Ting-Ting Gong, Jia-Le Lv, Xin-Yu Li, Fang-Hua Liu, Meng Zhang, Yi-Tong Shan, Yu-Hong Zhao, Qi-Jun Wu
Frontiers in Medicine.2022;[Epub] CrossRef - Analysis of multiple chronic disease characteristics in South Koreans by age groups using association rules analysis
Eul Hee Roh
Health Informatics Journal.2022; 28(1): 146045822110702. CrossRef - Behavioral Lifestyles and Survival: A Meta-Analysis
Rocío Fernández-Ballesteros, Elizabeth Valeriano-Lorenzo, Macarena Sánchez-Izquierdo, Juan Botella
Frontiers in Psychology.2022;[Epub] CrossRef - Sleep characteristics associated with nocturnal blood pressure nondipping in healthy individuals: a systematic review
Philippa Eileen Forshaw, Arron Taylor Lund Correia, Laura Catherine Roden, Estelle Victoria Lambert, Dale Elizabeth Rae
Blood Pressure Monitoring.2022; 27(6): 357. CrossRef - Sleep duration and risk of cardio-cerebrovascular disease: A dose-response meta-analysis of cohort studies comprising 3.8 million participants
Yi-Ming Huang, Wei Xia, Yi-Jun Ge, Jia-Hui Hou, Lan Tan, Wei Xu, Chen-Chen Tan
Frontiers in Cardiovascular Medicine.2022;[Epub] CrossRef - Association between Sleep Duration and Symptoms of Depression Aged between 18 and 49: The Korea National Health and Nutrition Examination Survey (KNHANES Ⅶ) from 2016 to 2018
Sung-Yong Choi, Ji-Eun Han, Jiae Choi, Minjung Park, Soo-Hyun Sung, Angela Dong-Min Sung
Healthcare.2022; 10(11): 2324. CrossRef - The relationship between physical activity and sleep status among older adults requiring nursing care in the community
Toshiki Mizuno, Masaaki Isaka, Takao Kuramoto, Tomomi Inoue, Kei Kamide
Nippon Ronen Igakkai Zasshi. Japanese Journal of Geriatrics.2022; 59(4): 528. CrossRef - The Association Between Habitual Sleep Duration and Mortality According to Sex and Age: The Japan Public Health Center-based Prospective Study
Thomas Svensson, Manami Inoue, Eiko Saito, Norie Sawada, Hiroyasu Iso, Tetsuya Mizoue, Atsushi Goto, Taiki Yamaji, Taichi Shimazu, Motoki Iwasaki, Shoichiro Tsugane
Journal of Epidemiology.2021; 31(2): 109. CrossRef - Association of sleep duration with all-cause and disease-specific mortality in US adults
Lili Yang, Bo Xi, Min Zhao, Costan G Magnussen
Journal of Epidemiology and Community Health.2021; 75(6): 556. CrossRef - Sleep Quality and Physical Activity as Predictors of Mental Wellbeing Variance in Older Adults during COVID-19 Lockdown: ECLB COVID-19 International Online Survey
Khaled Trabelsi, Achraf Ammar, Liwa Masmoudi, Omar Boukhris, Hamdi Chtourou, Bassem Bouaziz, Michael Brach, Ellen Bentlage, Daniella How, Mona Ahmed, Patrick Mueller, Notger Mueller, Hsen Hsouna, Yousri Elghoul, Mohamed Romdhani, Omar Hammouda, Laisa Pain
International Journal of Environmental Research and Public Health.2021; 18(8): 4329. CrossRef - Sleep duration and risk of all‐cause and disease‐specific mortality in adult cancer survivors
Huan Tao, Adrienne O'Neil, Raheem J Paxton, Wei Wang, Xiang Deng, Junfeng Wang, Yafeng Wang, Yongqian Jia, Jing Nie
Journal of Evidence-Based Medicine.2021; 14(4): 272. CrossRef - Possible association between oral health and sleep duration
Sungjun Han, Donghyun Jee, Yun-Jin Kang, Yong-Jin Park, Jung-Hae Cho
Medicine.2021; 100(48): e28035. CrossRef - Associations between self-reported sleep duration and cardiometabolic risk factors in young African-origin adults from the five-country modeling the epidemiologic transition study (METS)
Dale Elizabeth Rae, Lara Ruth Dugas, Laura Catherine Roden, Estelle Vicki Lambert, Pascal Bovet, Jacob Plange-Rhule, Terrence Forrester, Walter Riesen, Wolfgang Korte, Stephanie J. Crowley, Sirimon Reutrakul, Amy Luke
Sleep Health.2020; 6(4): 469. CrossRef - Fatigue and sleep patterns among Canadian wildland firefighters during a 17-day fire line deployment
Andrew T. Jeklin, Hugh W. Davies, Shannon S. D. Bredin, Ben A. Hives, Leah E. Meanwell, Andrew S. Perrotta, Darren E. R. Warburton
Journal of Occupational and Environmental Hygiene.2020; 17(7-8): 364. CrossRef - Association between Clustering of Lifestyle and Chronic Disease Using Healthcare Big Data
Eul Hee Roh, Sang Chan Park
Journal of Health Informatics and Statistics.2020; 45(2): 113. CrossRef - The relationship between sleep duration and all-cause mortality in the older people: an updated and dose-response meta-analysis
Mengyang He, Xiangling Deng, Yuqing Zhu, Luyao Huan, Wenquan Niu
BMC Public Health.2020;[Epub] CrossRef - Identifying the Associated Risk Factors of Sleep Disturbance During the COVID-19 Lockdown in Bangladesh: A Web-Based Survey
Tasnim Ara, Md. Mahabubur Rahman, Md. Abir Hossain, Amir Ahmed
Frontiers in Psychiatry.2020;[Epub] CrossRef - Sleep duration and mortality in Korean adults: a population-based prospective cohort study
Sohyeon Kwon, Hyeyoung Lee, Jong-Tae Lee, Min-Jeong Shin, Sangbum Choi, Hannah Oh
BMC Public Health.2020;[Epub] CrossRef - Sleep duration and all-cause mortality in the elderly in China: a population-based cohort study
Yanfeng Ren, Maohua Miao, Wei Yuan, Jiangwei Sun
BMC Geriatrics.2020;[Epub] CrossRef - Sleep duration and risk of all-cause mortality: a systematic review and meta-analysis
H. A. García-Perdomo, J. Zapata-Copete, C. A. Rojas-Cerón
Epidemiology and Psychiatric Sciences.2019; 28(5): 578. CrossRef - Sleep Duration and Mortality in Patients With Coronary Artery Disease
Jeong Hwan Kim, Salim S. Hayek, Yi-An Ko, Chang Liu, Ayman Samman Tahhan, Syed Ali, Ayman Alkhoder, Mohamad Mazen Gafeer, Fahad Choudhary, Ravila Bhimani, Shahla Delawalla, Muaaz Choudhary, Dorinda Joy Hartsfield, Donald L. Bliwise, Arshed A. Quyyumi
The American Journal of Cardiology.2019; 123(6): 874. CrossRef - The Relationship Between Sleep Duration, Falls, and Muscle Mass: A Cohort Study in an Elderly Chinese Population
Liyuan Fu, Xing Yu, Wen Zhang, Peipei Han, Li Kang, Yixuan Ma, Liye Jia, Hairui Yu, Xiaoyu Chen, Lin Hou, Lu Wang, Qi Guo
Rejuvenation Research.2019; 22(5): 390. CrossRef - Sleep and cancer incidence in Alberta’s Tomorrow Project cohort
Jessica McNeil, Amanda M Barberio, Christine M Friedenreich, Darren R Brenner
Sleep.2019;[Epub] CrossRef - The association between sleep duration and cancer-specific mortality: a systematic review and meta-analysis
Chelsea R. Stone, Tiffany R. Haig, Kirsten M. Fiest, Jessica McNeil, Darren R. Brenner, Christine M. Friedenreich
Cancer Causes & Control.2019; 30(5): 501. CrossRef - Association between total sleep time and all cancer mortality: non-linear dose-response meta-analysis of cohort studies
Yingjun Li, Shaofang Cai, Yuxiao Ling, Shuai Mi, Chunhong Fan, Yaohong Zhong, Qing Shen
Sleep Medicine.2019; 60: 211. CrossRef - Long sleep duration and health outcomes: A systematic review, meta-analysis and meta-regression
Maki Jike, Osamu Itani, Norio Watanabe, Daniel J. Buysse, Yoshitaka Kaneita
Sleep Medicine Reviews.2018; 39: 25. CrossRef - The association between osteoarthritis and sleep duration in Koreans: a nationwide cross-sectional observational study
Jae Hyun Jung, Hongdeok Seok, Sung Jae Choi, Junwoo Bae, Sang Hoon Lee, Moo Hwa Lee, Jae-Hoon Kim, Gwan Gyu Song
Clinical Rheumatology.2018; 37(6): 1653. CrossRef - Evolutionaire geneeskunde
Frits A. J. Muskiet
Bijblijven.2018; 34(5): 391. CrossRef - Longer Sleep Duration and Later Sleep Timing are Associated with Increased Cold-Pain Perception During the Day
Joshua Aviram, Tamar Shochat
Sleep and Vigilance.2018; 2(1): 71. CrossRef - Predictors of persistent sleep problems among older disaster survivors: a natural experiment from the 2011 Great East Japan earthquake and tsunami
Xiaoyu Li, Orfeu M Buxton, Hiroyuki Hikichi, Sebastien Haneuse, Jun Aida, Katsunori Kondo, Ichiro Kawachi
Sleep.2018;[Epub] CrossRef - The association of sleep duration and quality with all-cause and cause-specific mortality in the Women’s Health Initiative
Geoffrey C. Kabat, Xiaonan Xue, Victor Kamensky, Oleg Zaslavsky, Katie L. Stone, Karen C. Johnson, Sylvia Wassertheil-Smoller, Aladdin H. Shadyab, Juhua Luo, Lauren Hale, Lihong Qi, Jane A. Cauley, Robert L. Brunner, JoAnn E. Manson, Thomas E. Rohan
Sleep Medicine.2018; 50: 48. CrossRef - Sex Differences in Sleep Duration among Older Adults with Self-Reported Diagnosis of Arthritis: National Health and Nutrition Examination Survey, 2009-2012
R. Constance Wiener, Alcinda K. Trickett Shockey, Christopher Waters
Sleep Disorders.2018; 2018: 1. CrossRef - Self‐Reported Sleep Duration and Quality and Cardiovascular Disease and Mortality: A Dose‐Response Meta‐Analysis
Chun Shing Kwok, Evangelos Kontopantelis, George Kuligowski, Matthew Gray, Alan Muhyaldeen, Christopher P. Gale, George M. Peat, Jacqueline Cleator, Carolyn Chew‐Graham, Yoon Kong Loke, Mamas Andreas Mamas
Journal of the American Heart Association.2018;[Epub] CrossRef - Associations between long self-reported sleep, obesity and insulin resistance in a cohort of premenopausal Black and White South African women
Dale E. Rae, Paula R. Pienaar, Rob H.P. Henst, Laura C. Roden, Julia H. Goedecke
Sleep Health.2018; 4(6): 558. CrossRef - Associations between sleep parameters, non-communicable diseases, HIV status and medications in older, rural South Africans
F. Xavier Gómez-Olivé, Julia K. Rohr, Laura C. Roden, Dale E. Rae, Malcolm von Schantz
Scientific Reports.2018;[Epub] CrossRef - Sleep duration and risk of all-cause mortality: A flexible, non-linear, meta-regression of 40 prospective cohort studies
Tong-Zu Liu, Chang Xu, Matteo Rota, Hui Cai, Chao Zhang, Ming-Jun Shi, Rui-Xia Yuan, Hong Weng, Xiang-Yu Meng, Joey S.W. Kwong, Xin Sun
Sleep Medicine Reviews.2017; 32: 28. CrossRef - Short sleep duration and health outcomes: a systematic review, meta-analysis, and meta-regression
Osamu Itani, Maki Jike, Norio Watanabe, Yoshitaka Kaneita
Sleep Medicine.2017; 32: 246. CrossRef - The association between sleep duration and physical performance in Chinese community-dwelling elderly
Liyuan Fu, Liye Jia, Wen Zhang, Peipei Han, Li Kang, Yixuan Ma, Hairui Yu, Tianqi Zhai, Xiaoyu Chen, Qi Guo, Yiqing Song
PLOS ONE.2017; 12(3): e0174832. CrossRef - Sex and age differences in the associations between sleep behaviors and all-cause mortality in older adults: results from the National Health and Nutrition Examination Surveys
Hind A. Beydoun, May A. Beydoun, Xiaoli Chen, Jen Jen Chang, Alyssa A. Gamaldo, Shaker M. Eid, Alan B. Zonderman
Sleep Medicine.2017; 36: 141. CrossRef - A possible association between dysphonia and sleep duration: A cross-sectional study based on the Korean National Health and nutrition examination surveys from 2010 to 2012
Jung-Hae Cho, Christian Guilminault, Young-Hoon Joo, Sang-Kyun Jin, Kyung-Do Han, Chan-Soon Park, Thomas Penzel
PLOS ONE.2017; 12(8): e0182286. CrossRef - Sleep duration, mortality and the influence of age
Torbjörn Åkerstedt, Francesca Ghilotti, Alessandra Grotta, Andrea Bellavia, Ylva Trolle Lagerros, Rino Bellocco
European Journal of Epidemiology.2017; 32(10): 881. CrossRef - Relationship of Sleep Duration With All‐Cause Mortality and Cardiovascular Events: A Systematic Review and Dose‐Response Meta‐Analysis of Prospective Cohort Studies
Jiawei Yin, Xiaoling Jin, Zhilei Shan, Shuzhen Li, Hao Huang, Peiyun Li, Xiaobo Peng, Zhao Peng, Kaifeng Yu, Wei Bao, Wei Yang, Xiaoyi Chen, Liegang Liu
Journal of the American Heart Association.2017;[Epub] CrossRef - Sleep Duration across the Adult Lifecourse and Risk of Lung Cancer Mortality: A Cohort Study in Xuanwei, China
Jason Y. Wong, Bryan A. Bassig, Roel Vermeulen, Wei Hu, Bofu Ning, Wei Jie Seow, Bu-Tian Ji, George S. Downward, Hormuzd A. Katki, Francesco Barone-Adesi, Nathaniel Rothman, Robert S. Chapman, Qing Lan
Cancer Prevention Research.2017; 10(6): 327. CrossRef - Self-reported sleep duration and coronary heart disease mortality: A large cohort study of 400,000 Taiwanese adults
Linn B. Strand, Min Kuang Tsai, David Gunnell, Imre Janszky, Chi Pang Wen, Shu-Sen Chang
International Journal of Cardiology.2016; 207: 246. CrossRef - Influence of sleep disturbances on age at onset and long-term incidence of major cardiovascular events: the MONICA-Brianza and PAMELA cohort studies
Francesco Gianfagna, Giovanni Veronesi, Lorenza Bertù, Giancarlo Cesana, Guido Grassi, Saverio Stranges, Camilla Callegari, Marco M. Ferrario
Sleep Medicine.2016; 21: 126. CrossRef - Nighttime sleep duration, 24-hour sleep duration and risk of all-cause mortality among adults: a meta-analysis of prospective cohort studies
Xiaoli Shen, Yili Wu, Dongfeng Zhang
Scientific Reports.2016;[Epub] CrossRef - Investigation of Healthy Life Practices among Korean Males and Females in relation to Dyslipidemia Using data from the 2012 Korea National Health and Nutrition Examination Survey
Sun-Hee Lee, GyeongAe Seomun
Journal of Digital Convergence.2016; 14(1): 327. CrossRef - Sleep duration and mortality in the elderly: a systematic review with meta-analysis
Andressa Alves da Silva, Renato Gorga Bandeira de Mello, Camila Wohlgemuth Schaan, Flávio D Fuchs, Susan Redline, Sandra C Fuchs
BMJ Open.2016; 6(2): e008119. CrossRef - A Comparative Study on Mental Health between Elderly Living Alone and Elderly Couples - Focus on Gender and Demographic Characteristics -
Bo-Young Park, Ho-Jang Kwon, Mi-Na Ha, Eun-Ae Burm
Journal of Korean Public Health Nursing.2016; 30(2): 195. CrossRef - Sleep duration and total cancer mortality: a meta-analysis of prospective studies
Qian-Qian Ma, Qi Yao, Lv Lin, Guo-Chong Chen, Jing-Bo Yu
Sleep Medicine.2016; 27-28: 39. CrossRef - Sleep Disturbances among Older Adults in the United States, 2002–2012: Nationwide Inpatient Rates, Predictors, and Outcomes
Alyssa A. Gamaldo, May A. Beydoun, Hind A. Beydoun, Hailun Liang, Rachel E. Salas, Alan B. Zonderman, Charlene E. Gamaldo, Shaker M. Eid
Frontiers in Aging Neuroscience.2016;[Epub] CrossRef - Sleep duration and associated factors in a community sample of elderly individuals in Korea
Won‐Hyoung Kim, Byung‐Soo Kim, Shin‐Kyum Kim, Sung‐Man Chang, Dong‐Woo Lee, Maeng‐Je Cho, Jae‐Nam Bae
Psychogeriatrics.2015; 15(2): 87. CrossRef - Sleep disordered breathing and the risk of psoriasis among US women
Jeffrey M. Cohen, Chandra L. Jackson, Tricia Y. Li, Shaowei Wu, Abrar A. Qureshi
Archives of Dermatological Research.2015; 307(5): 433. CrossRef - Daytime napping and mortality from all causes, cardiovascular disease, and cancer: a meta-analysis of prospective cohort studies
Guochao Zhong, Yi Wang, TieHong Tao, Jun Ying, Yong Zhao
Sleep Medicine.2015; 16(7): 811. CrossRef - Sleep duration and sleep‐disordered breathing and the risk of melanoma among US women and men
Jeffrey M. Cohen, Yunhui T. Li, Shaowei Wu, Jiali Han, Abrar A. Qureshi, Eunyoung Cho
International Journal of Dermatology.2015;[Epub] CrossRef - Correlates of Self-Reported Sleep Duration in Middle-Aged and Elderly Koreans: from the Health Examinees Study
Hyung-Suk Yoon, Jae Jeong Yang, Minkyo Song, Hwi-Won Lee, Sohee Han, Sang-Ah Lee, Ji-Yeob Choi, Jong-koo Lee, Daehee Kang, Ignacio Correa-Velez
PLOS ONE.2015; 10(5): e0123510. CrossRef - Joint Consensus Statement of the American Academy of Sleep Medicine and Sleep Research Society on the Recommended Amount of Sleep for a Healthy Adult: Methodology and Discussion
Nathaniel F. Watson, M. Safwan Badr, Gregory Belenky, Donald L. Bliwise, Orfeu M. Buxton, Daniel Buysse, David F. Dinges, James Gangwisch, Michael A. Grandner, Clete Kushida, Raman K. Malhotra, Jennifer L. Martin, Sanjay R. Patel, Stuart F. Quan, Esra Tas
Sleep.2015; 38(8): 1161. CrossRef - Action-Dependent Photobiomodulation on Health, Suboptimal Health, and Disease
Timon Cheng-Yi Liu, Long Liu, Jing-Gang Chen, Peng Zeng, Xiang-Bo Yang
International Journal of Photoenergy.2014; 2014: 1. CrossRef - Influencing Factors and Trend of Suicidal Ideation in the Elderly: Using the Korea National Health and Nutrition Examination Survey(2001, 2005, 2010)
Ryoung Choi, Byung-Deog Hwang
Korean Journal of Health Education and Promotion.2014; 31(5): 45. CrossRef
 PubReader
 ePub Link
 Cite
Cite

