Articles
- Page Path
- HOME > J Prev Med Public Health > Volume 45(2); 2012 > Article
-
Original Article
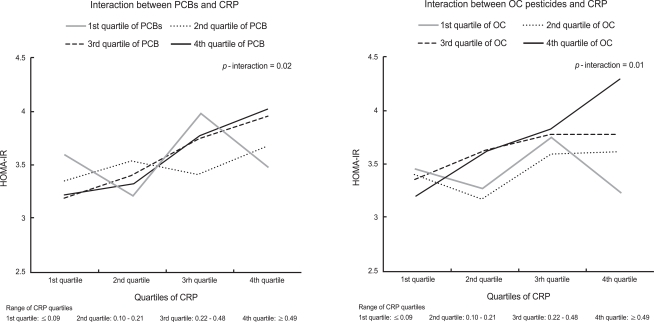
Interaction Between Persistent Organic Pollutants and C-reactive Protein in Estimating Insulin Resistance Among Non-diabetic Adults - Ki-Su Kim1, Nam-Soo Hong1, David R Jacobs2,3, Duk-Hee Lee1
-
Journal of Preventive Medicine and Public Health 2012;45(2):62-69.
DOI: https://doi.org/10.3961/jpmph.2012.45.2.62
Published online: March 31, 2012
1Department of Preventive Medicine, Kyungpook National University School of Medicine, Daegu, Korea.
2Division of Epidemiology, University of Minnesota School of Public Health, Minneapolis, MN, USA.
3Department of Nutrition, University of Oslo, Oslo, Norway.
- Corresponding author: Duk-Hee Lee, MD, PhD. 680 Gukchaebosang-ro, Jung-gu, Daegu 700-842, Korea. Tel: +82-53-420-6960, Fax: +82-53-425-2447, lee_dh@knu.ac.kr
• Received: September 21, 2011 • Accepted: October 31, 2011
Copyright © 2012 The Korean Society for Preventive Medicine
This is an Open Access article distributed under the terms of the Creative Commons Attribution Non-Commercial License (http://creativecommons.org/licenses/by-nc/3.0/) which permits unrestricted non-commercial use, distribution, and reproduction in any medium, provided the original work is properly cited.

Figure & Data
References
Citations
Citations to this article as recorded by 
- Is Physical Activity an Efficient Strategy to Control the Adverse Effects of Persistent Organic Pollutants in the Context of Obesity? A Narrative Review
Quentin A. Serrano, Sébastien Le Garf, Vincent Martin, Serge S. Colson, Nicolas Chevalier
International Journal of Molecular Sciences.2024; 25(2): 883. CrossRef - The associations between endocrine disrupting chemicals and markers of inflammation and immune responses: A systematic review and meta-analysis
Zhiqin Liu, Yao Lu, Kunxia Zhong, Chenchen Wang, Xi Xu
Ecotoxicology and Environmental Safety.2022; 234: 113382. CrossRef - Endocrine Disruptors and the Induction of Insulin Resistance
Rafael Vanni, Renata Maksoud Bussuan, Renato Luiz Rombaldi, Alberto K. Arbex
Current Diabetes Reviews.2021;[Epub] CrossRef - Influence of polychlorinated biphenyls and organochlorine pesticides on the inflammatory milieu. A systematic review of in vitro, in vivo and epidemiological studies
F.M. Peinado, F. Artacho-Cordón, R. Barrios-Rodríguez, J.P. Arrebola
Environmental Research.2020; 186: 109561. CrossRef - Associations between persistent organic pollutants and metabolic syndrome in morbidly obese individuals
S. Dusanov, J. Ruzzin, H. Kiviranta, T.O. Klemsdal, L. Retterstøl, P. Rantakokko, R. Airaksinen, S. Djurovic, S. Tonstad
Nutrition, Metabolism and Cardiovascular Diseases.2018; 28(7): 735. CrossRef - Health and environmental effects of persistent organic pollutants
Omar M.L. Alharbi, Al Arsh Basheer, Rafat A. Khattab, Imran Ali
Journal of Molecular Liquids.2018; 263: 442. CrossRef - The influence of persistent organic pollutants in the traditional Inuit diet on markers of inflammation
L. K. Schæbel, E. C. Bonefeld-Jørgensen, H. Vestergaard, S. Andersen, Jaymie Meliker
PLOS ONE.2017; 12(5): e0177781. CrossRef - Pesticide Use and Age-Related Macular Degeneration in the Agricultural Health Study
Martha P. Montgomery, Eric Postel, David M. Umbach, Marie Richards, Mary Watson, Aaron Blair, Honglei Chen, Dale P. Sandler, Silke Schmidt, Freya Kamel
Environmental Health Perspectives.2017;[Epub] CrossRef - Hemostatic, inflammatory, and oxidative markers in pesticide user farmers
Fatima Zohra Madani, Merzouk Hafida, Sid Ahmed Merzouk, Bouchra Loukidi, Katia Taouli, Michel Narce
Biomarkers.2016; 21(2): 138. CrossRef - Persistent organic pollutants and biomarkers of diabetes risk in a cohort of Great Lakes sport caught fish consumers
Mary Turyk, Giamila Fantuzzi, Victoria Persky, Sally Freels, Anissa Lambertino, Maria Pini, Davina H. Rhodes, Henry A. Anderson
Environmental Research.2015; 140: 335. CrossRef - Vitamin D-rich marine Inuit diet and markers of inflammation – a population-based survey in Greenland
L. K. Schæbel, E. C. Bonefeld-Jørgensen, P. Laurberg, H. Vestergaard, S. Andersen
Journal of Nutritional Science.2015;[Epub] CrossRef - Persistent Organic Pollutants and Inflammatory Markers in a Cross-Sectional Study of Elderly Swedish People: The PIVUS Cohort
Jitender Kumar, P. Monica Lind, Samira Salihovic, Bert van Bavel, Erik Ingelsson, Lars Lind
Environmental Health Perspectives.2014; 122(9): 977. CrossRef
 PubReader
 ePub Link
 Cite
Cite