Figure 1Contribution of causes of death to socioeconomic inequalities in all-cause mortality by education among men (A) and women (B) aged 25-44 and 45-64.
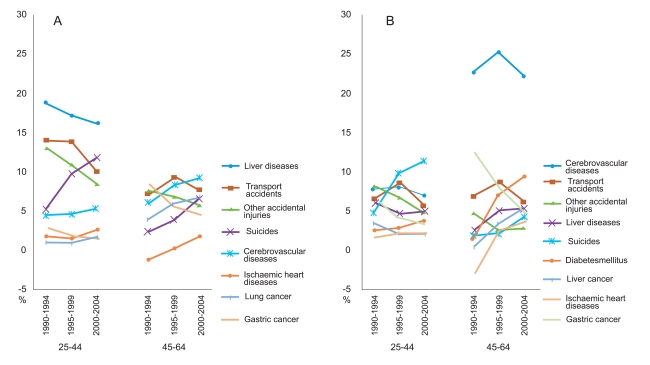
Table 1.Causes of death used in this study
|
KSCD codes |
Terms in KSCD |
Terms in this study |
|
A15-A19 |
Tuberculosis |
Tuberculosis |
|
C16 |
Malignant neoplasm of stomach |
Gastric cancer |
|
C22 |
Malignant neoplasm of liver and intrahepatic bile ducts |
Liver cancer |
|
C34 |
Malignant neoplasm of bronchus and lung |
Lung cancer |
|
C50 |
Malignant neoplasm of breast |
Breast cancer |
|
E10-E14 |
Diabetes mellitus |
Diabetes mellitus |
|
I20-I25 |
Ischemic heart diseases |
Ischemic heart diseases |
|
I60-I69 |
Cerebrovascular diseases |
Cerebrovascular diseases |
|
K70-K76 |
Diseases of liver |
Liver diseases |
|
V01-V99 |
Transport accidents |
Transport accidents |
|
W00-X59 |
Other external causes of accidental injury |
Other accidental injuries |
|
X60-X84 |
Intentional self-harm |
Suicides |
Table 2.Census population and number of deaths by socioeconomic position indicators in men and women aged 25-44 and 45-64
|
1990-1994
|
1995-1999
|
2000-2004
|
|
Census population in 1990 |
Deaths |
Census population in 1995 |
Deaths |
Census population in 2000 |
Deaths |
|
Men |
|
|
|
|
|
|
|
Total |
10 616 834 |
338 501 |
11 790 947 |
347 501 |
12 744 927 |
322 614 |
|
25-44 years old |
|
|
|
|
|
|
|
Subtotal |
7 266 188 (100.0) |
107 870 (100.0) |
7 904 817 (100.0) |
107 673 (100.0) |
8 269 651 (100.0) |
89 932 (100.0) |
|
Elementary or less |
701 455 (9.7) |
37 742 (35.0) |
409 004 (5.2) |
28 712 (26.7) |
280 158 (3.4) |
17 437 (19.4) |
|
Middle or high |
4 772 227 (65.7) |
59 045 (54.7) |
4 838 918 (61.2) |
64 585 (60.0) |
4 687 879 (56.7) |
56 505 (62.8) |
|
College or higher |
1 792 506 (24.7) |
11 083 (10.3) |
2 656 895 (33.6) |
14 376 (13.4) |
3 301 614 (39.9) |
15 990 (17.8) |
|
45-64 years old |
|
|
|
|
|
|
|
Subtotal |
3 350 646 (100.0) |
230 631 (100.0) |
3 886 130 (100.0) |
239 828 (100.0) |
4 475 276 (100.0) |
232 682 (100.0) |
|
Elementary or less |
1 321 312 (39.4) |
129 483 (56.1) |
1 163 736 (29.9) |
114 722 (47.8) |
1 057 498 (23.6) |
97 712 (42.0) |
|
Middle or high |
1 559 604 (46.5) |
82 018 (35.6) |
2 054 713 (52.9) |
102 522 (42.7) |
2 553 856 (57.1) |
110 889 (47.7) |
|
College or higher |
469 730 (14.0) |
19 130 (8.3) |
667 681 (17.2) |
22 584 (9.4) |
863 922 (19.3) |
24 081 (10.3) |
|
Women |
|
|
|
|
|
|
|
Total |
10 629 433 |
143 752 |
11 711 815 |
138 593 |
12 679 934 |
124 326 |
|
25-44 years old |
|
|
|
|
|
|
|
Subtotal |
7 014 159 (100.0) |
38 018 (100.0) |
7 663 753 (100.0) |
37 937 (100.0) |
8 099 255 (100.0) |
33 969 (100.0) |
|
Elementary or less |
1 262 816 (18.0) |
16 199 (42.6) |
701 041 (9.1) |
11 022 (29.1) |
412 888 (5.1) |
6935 (20.4) |
|
Middle or high |
4 855 967 (69.2) |
19 236 (50.6) |
5 400 186 (70.5) |
22 987 (60.6) |
5 381 273 (66.4) |
22 013 (64.8) |
|
College or higher |
895 376 (12.8) |
2583 (6.8) |
1 562 526 (20.4) |
3928 (10.4) |
2 305 094 (28.5) |
5021 (14.8) |
|
45-64 years old |
|
|
|
|
|
|
|
Subtotal |
3 615 274 (100.0) |
105 734 (100.0) |
4 048 062 (100.0) |
100 656 (100.0) |
4 580 679 (100.0) |
90 357 (100.0) |
|
Elementary or less |
2 590 140 (71.6) |
87 251 (82.5) |
2 422 390 (59.8) |
75 806 (75.3) |
2 196 374 (47.9) |
60 283 (66.7) |
|
Middle or high |
931 079 (25.8) |
16 994 (16.1) |
1 441 136 (35.6) |
22 639 (22.5) |
2 084 791 (45.5) |
27 065 (30.0) |
|
College or higher |
94 055 (2.6) |
1489 (1.4) |
184 536 (4.6) |
2211 (2.2) |
299 514 (6.5) |
3009 (3.3) |
Table 3.Age-adjusted mortality rates per 5 years per 100 000 people and proportions of cause-specific mortality in all-cause mortality among Korean men aged 25-44 and 45-64
|
Diseases |
1990-1994
|
1995-1999
|
2000-2004
|
|
AMR (95% CI) |
% |
AMR (95% CI) |
% |
AMR (95% CI) |
% |
|
25-44 years old |
|
|
|
|
|
|
|
Total |
1637.8 (1627.7, 1647.9) |
100.0 |
1454.9 (1446.0, 1463.8) |
100.0 |
1112.3 (1105.0, 1119.6) |
100.0 |
|
Transport accidents |
295.7 (291.6, 299.8) |
18.1 |
266.3 (262.6, 269.9) |
18.3 |
145.5 (142.9, 148.1) |
13.1 |
|
Liver diseases |
236.2 (232.2, 240.1) |
14.4 |
192.9 (189.6, 196.2) |
13.3 |
136.6 (134.0, 139.1) |
12.3 |
|
Other accidental injuries |
224.4 (220.7, 228.0) |
13.7 |
153.4 (150.6, 156.2) |
10.5 |
93.3 (91.1, 95.4) |
8.4 |
|
Liver cancer |
105.0 (102.3, 107.6) |
6.4 |
85.4 (83.2, 87.7) |
5.9 |
70.6 (68.8, 72.5) |
6.3 |
|
Cerebrovascular diseases |
90.8 (88.3, 93.2) |
5.5 |
77.1 (75.0, 79.2) |
5.3 |
65.8 (64.0, 67.6) |
5.9 |
|
Suicides |
72.2 (70.2, 74.2) |
4.4 |
129.1 (126.6, 131.7) |
8.9 |
145.4 (142.8, 148.1) |
13.1 |
|
Gastric cancer |
64.2 (62.2, 66.3) |
3.9 |
48.2 (46.5, 49.8) |
3.3 |
39.4 (38.0, 40.8) |
3.5 |
|
Tuberculosis |
50.2 (48.4, 52.0) |
3.1 |
33.1 (31.8, 34.5) |
2.3 |
21.6 (20.6, 22.6) |
1.9 |
|
Ischemic heart diseases |
45.5 (43.8, 47.2) |
2.8 |
38.9 (37.4, 40.4) |
2.7 |
43.1 (41.6, 44.5) |
3.9 |
|
Diabetes mellitus |
28.4 (27.0, 29.7) |
1.7 |
30.5 (29.2, 31.9) |
2.1 |
26.9 (25.8, 28.1) |
2.4 |
|
Lung cancer |
26.1 (24.8, 27.5) |
1.6 |
23.7 (22.5, 24.8) |
1.6 |
19.7 (18.7, 20.7) |
1.8 |
|
45-64 years old |
|
|
|
|
|
|
|
Total |
6867.1 (6838.8, 6895.4) |
100.0 |
5948.3 (5924.4, 5972.3) |
100.0 |
5024.0 (5003.5, 5044.6) |
100.0 |
|
Transport accidents |
392.2 (385.4, 398.9) |
5.7 |
382.0 (375.8, 388.1) |
6.4 |
249.8 (245.2, 254.4) |
5.0 |
|
Liver diseases |
818.6 (808.8, 828.3) |
11.9 |
680.4 (672.2, 688.6) |
11.4 |
504.4 (497.8, 511.0) |
10.0 |
|
Other accidental injuries |
342.9 (336.6, 349.3) |
5.0 |
249.5 (244.5, 254.5) |
4.2 |
187.0 (183.0, 191.0) |
3.7 |
|
Liver cancer |
636.7 (628.1, 645.3) |
9.3 |
552.2 (544.9, 559.5) |
9.3 |
506.5 (500.0, 513.1) |
10.1 |
|
Cerebrovascular diseases |
852.3 (842.3, 862.3) |
12.4 |
692.7 (684.6, 700.8) |
11.6 |
551.6 (544.8, 558.3) |
11.0 |
|
Suicides |
93.6 (90.3, 96.9) |
1.4 |
169.8 (165.7, 174.0) |
2.9 |
237.9 (233.4, 242.4) |
4.7 |
|
Gastric cancer |
572.3 (564.1, 580.4) |
8.3 |
421.8 (415.5, 428.2) |
7.1 |
328.4 (323.2, 333.6) |
6.5 |
|
Tuberculosis |
197.5 (192.7, 202.3) |
2.9 |
128.1 (124.6, 131.6) |
2.2 |
82.2 (79.6, 84.9) |
1.6 |
|
Ischemic heart diseases |
175.5 (170.9, 180.0) |
2.6 |
221.7 (217.0, 226.3) |
3.7 |
255.5 (250.8, 260.1) |
5.1 |
|
Diabetes mellitus |
226.8 (221.6, 231.9) |
3.3 |
251.9 (247.0, 256.8) |
4.2 |
255.6 (251.0, 260.2) |
5.1 |
|
Lung cancer |
396.8 (390.0, 403.6) |
5.8 |
399.0 (392.9, 405.1) |
6.7 |
372.4 (366.9, 378.0) |
7.4 |
Table 4.Age-adjusted mortality rates per 5 years per 100 000 people and proportions of cause-specific mortality in all-cause mortality among Korean women aged 25-44 and 45-64
|
Diseases |
1990-1994
|
1995-1999
|
2000-2004
|
|
AMR (95% CI) |
% |
AMR (95% CI) |
% |
AMR (95% CI) |
% |
|
25-44 years old |
|
|
|
|
|
|
|
Total |
599.2 (593.0, 605.5) |
100.0 |
525.3 (519.8, 530.7) |
100.0 |
428.1 (423.5, 432.7) |
100.0 |
|
Transport accidents |
59.9 (57.9, 61.8) |
10.0 |
57.7 (56.0, 59.5) |
11.0 |
33.6 (32.3, 34.9) |
7.8 |
|
Gastric cancer |
49.3 (47.5, 51.1) |
8.2 |
40.9 (39.4, 42.5) |
7.8 |
34.3 (33.0, 35.6) |
8.0 |
|
Cerebrovascular diseases |
48.4 (46.5, 50.2) |
8.1 |
39.9 (38.4, 41.5) |
7.6 |
28.5 (27.3, 29.7) |
6.7 |
|
Other accidental injuries |
47.8 (46.1, 49.5) |
8.0 |
34.0 (32.7, 35.4) |
6.5 |
16.2 (15.3, 17.1) |
3.8 |
|
Suicides |
32.1 (30.7, 33.4) |
5.4 |
49.6 (48.0, 51.2) |
9.4 |
59.5 (57.8, 61.2) |
13.9 |
|
Liver diseases |
28.8 (27.4, 30.2) |
4.8 |
22.6 (21.5, 23.8) |
4.3 |
17.3 (16.3, 18.2) |
4.0 |
|
Liver cancer |
21.8 (20.6, 23.0) |
3.6 |
15.3 (14.3, 16.2) |
2.9 |
11.5 (10.8, 12.3) |
2.7 |
|
Breast cancer |
21.0 (19.8, 22.2) |
3.5 |
24.1 (22.9, 25.2) |
4.6 |
26.2 (25.0, 27.3) |
6.1 |
|
Tuberculosis |
19.7 (18.6, 20.8) |
3.3 |
11.1 (10.3, 11.9) |
2.1 |
6.6 (6.0, 7.2) |
1.5 |
|
Diabetes mellitus |
10.9 (10.1, 11.8) |
1.8 |
9.1 (8.4, 9.9) |
1.7 |
8.9 (8.2, 9.5) |
2.1 |
|
Lung cancer |
13.1 (12.1, 14.0) |
2.2 |
12.9 (12.0, 13.8) |
2.5 |
12.4 (11.6, 13.2) |
2.9 |
|
Ischemic heart diseases |
9.7 (8.9, 10.5) |
1.6 |
8.3 (7.6, 9.0) |
1.6 |
7.8 (7.2, 8.5) |
1.8 |
|
45-64 years old |
|
|
|
|
|
|
|
Total |
2832.5 (2815.2, 2849.7) |
100.0 |
2334.7 (2320.1, 2349.3) |
100.0 |
1872.4 (1860.1, 1884.7) |
100.0 |
|
Transport accidents |
140.5 (136.6, 144.4) |
5.0 |
130.4 (126.9, 133.9) |
5.6 |
78.3 (75.8, 80.9) |
4.2 |
|
Gastric cancer |
224.9 (220.1, 229.8) |
7.9 |
158.0 (154.2, 161.8) |
6.8 |
110.1 (107.1, 113.1) |
5.9 |
|
Cerebrovascular diseases |
552.4 (544.8, 560.0) |
19.5 |
436.4 (430.2, 442.7) |
18.7 |
297.1 (292.3, 302.0) |
15.9 |
|
Other accidental injuries |
88.3 (85.2, 91.4) |
3.1 |
54.1 (51.9, 56.4) |
2.3 |
34.8 (33.1, 36.5) |
1.9 |
|
Suicides |
29.6 (27.8, 31.4) |
1.0 |
49.0 (46.8, 51.2) |
2.1 |
69.6 (67.2, 72.0) |
3.7 |
|
Liver diseases |
145.4 (141.5, 149.4) |
5.1 |
122.0 (118.6, 125.3) |
5.2 |
78.7 (76.2, 81.2) |
4.2 |
|
Liver cancer |
147.3 (143.3, 151.2) |
5.2 |
121.1 (117.8, 124.5) |
5.2 |
111.0 (108.0, 114.0) |
5.9 |
|
Breast cancer |
49.1 (46.8, 51.4) |
1.7 |
59.3 (56.9, 61.7) |
2.5 |
69.0 (66.6, 71.5) |
3.7 |
|
Tuberculosis |
37.0 (35.0, 39.0) |
1.3 |
23.1 (21.6, 24.5) |
1.0 |
15.8 (14.7, 17.0) |
0.8 |
|
Diabetes mellitus |
119.8 (116.3, 123.3) |
4.2 |
132.5 (129.1, 135.9) |
5.7 |
116.9 (113.9, 119.9) |
6.2 |
|
Lung cancer |
89.6 (86.6, 92.7) |
3.2 |
92.0 (89.2, 94.9) |
3.9 |
89.4 (86.8, 92.1) |
4.8 |
|
Ischemic heart diseases |
61.5 (58.9, 64.0) |
2.2 |
73.4 (70.8, 75.9) |
3.1 |
82.1 (79.6, 84.7) |
4.4 |
Table 5.Slope index of inequality and relative index of inequality in cause-specific mortality by education among Korean men aged 25-44 and 45-64
|
Diseases |
1990 -1994
|
1995 -1999
|
2000 - 2004
|
|
SII |
RII |
SII |
RII |
SII |
RII |
|
25-44 years old |
|
|
|
|
|
|
|
Total |
5249.8 |
16.07 (12.16, 21.22) |
6881.0 |
21.58 (15.11, 30.82) |
5652.6 |
14.10 (10.08, 19.72) |
|
Transport accidents |
734.1 |
7.69 (6.08, 9.72) |
952.2 |
9.58 (7.10, 12.91) |
564.4 |
8.50 (6.32, 11.41) |
|
Liver diseases |
987.9 |
56.16 (38.75, 81.38) |
1183.0 |
107.97 (69.21, 168.44) |
915.6 |
86.42 (56.71, 131.69) |
|
Other accidental injuries |
690.1 |
13.38 (10.37, 17.25) |
749.3 |
25.05 (17.69, 35.47) |
471.2 |
17.96 (12.99, 24.83) |
|
Liver cancer |
240.5 |
8.64 (6.45, 11.56) |
264.6 |
9.86 (7.37, 13.20) |
217.7 |
6.08 (4.61, 8.01) |
|
Cerebrovascular diseases |
236.4 |
10.76 (8.31, 13.92) |
319.8 |
18.14 (13.09, 25.15) |
296.5 |
10.27 (7.23, 14.61) |
|
Suicides |
278.6 |
21.21 (15.59, 28.87) |
677.7 |
23.42 (15.97, 34.35) |
670.2 |
13.23 (10.00, 17.51) |
|
Gastric cancer |
145.5 |
6.87 (5.00, 9.45) |
133.7 |
5.90 (4.35, 8.02) |
85.6 |
3.15 (2.46, 4.04) |
|
Tuberculosis |
243.2 |
86.75 (60.06, 125.29) |
243.7 |
169.41 (107.41, 267.21) |
170.3 |
102.03 (64.29, 161.93) |
|
Ischemic heart diseases |
96.8 |
6.20 (4.57, 8.41) |
109.7 |
7.48 (5.38, 10.40) |
142.0 |
4.71 (3.43, 6.47) |
|
Diabetes mellitus |
110.9 |
43.04 (29.57, 62.65) |
191.0 |
106.53 (66.55, 170.52) |
187.3 |
65.78 (41.32, 104.72) |
|
Lung cancer |
51.6 |
5.83 (4.05, 8.39) |
74.7 |
8.55 (5.85, 12.51) |
82.6 |
7.16 (4.78, 10.74) |
|
45-64 years old |
|
|
|
|
|
|
|
Total |
6530.2 |
3.15 (2.39, 4.14) |
7305.0 |
3.77 (2.69, 5.29) |
6886.8 |
4.17 (2.95, 5.89) |
|
Transport accidents |
479.8 |
3.35 (2.82, 3.98) |
676.7 |
6.01 (5.05, 7.15) |
532.5 |
9.03 (7.53, 10.84) |
|
Liver diseases |
1305.7 |
5.75 (4.85, 6.83) |
1391.0 |
8.03 (6.49, 9.95) |
1169.5 |
9.54 (7.77, 11.71) |
|
Other accidental injuries |
515.9 |
4.70 (3.91, 5.65) |
495.3 |
7.43 (6.13, 9.00) |
396.9 |
8.29 (6.75, 10.19) |
|
Liver cancer |
386.1 |
2.11 (1.65, 2.70) |
492.5 |
2.62 (1.94, 3.55) |
437.7 |
2.55 (1.85, 3.52) |
|
Cerebrovascular diseases |
407.1 |
1.93 (1.27, 2.92) |
618.5 |
2.77 (1.73, 4.43) |
641.6 |
3.50 (2.25, 5.45) |
|
Suicides |
150.7 |
5.57 (4.40, 7.06) |
283.2 |
4.74 (3.88, 5.80) |
453.4 |
6.42 (5.30, 7.79) |
|
Gastric cancer |
560.9 |
3.55 (2.42, 5.20) |
403.9 |
3.36 (2.14, 5.29) |
306.1 |
3.09 (2.00, 4.78) |
|
Tuberculosis |
317.6 |
6.56 (5.01, 8.59) |
254.7 |
8.67 (6.29, 11.94) |
189.6 |
10.60 (7.57, 14.85) |
|
Ischemic heart diseases |
-72.6 |
0.78 (0.57, 1.05) |
16.1 |
1.10 (0.75, 1.62) |
123.7 |
1.64 (1.10, 2.44) |
|
Diabetes mellitus |
49.8 |
1.43 (0.92, 2.22) |
225.6 |
2.66 (1.57, 4.50) |
322.9 |
3.56 (2.18, 5.82) |
|
Lung cancer |
255.3 |
2.61 (1.56, 4.35) |
425.9 |
3.84 (2.24, 6.61) |
465.0 |
4.59 (2.66, 7.91) |
Table 6.Slope index of inequality and relative index of inequality in cause-specific mortality by education among Korean women aged 25-44 and 45-64
|
Diseases |
1990 -1994
|
1995 -1999
|
2000 - 2004
|
|
SII |
RII |
SII |
RII |
SII |
RII |
|
25-44 years old |
|
|
|
|
|
|
|
Total |
1118.0 |
7.35 (5.71, 9.47) |
1814.8 |
9.35 (6.67, 13.10) |
2011.4 |
8.13 (5.66, 11.69) |
|
Transport accidents |
73.6 |
3.56 (2.87, 4.42) |
155.7 |
7.43 (5.60, 9.86) |
114.0 |
7.86 (5.52, 11.17) |
|
Gastric cancer |
70.0 |
4.67 (3.56, 6.14) |
75.2 |
3.30 (2.36, 4.62) |
67.0 |
2.44 (1.78, 3.34) |
|
Cerebrovascular diseases |
87.0 |
7.66 (5.69, 10.31) |
146.5 |
13.23 (8.85, 19.77) |
141.0 |
18.92 (12.91, 27.71) |
|
Other accidental injuries |
92.1 |
7.20 (5.62, 9.23) |
120.0 |
9.20 (6.62, 12.78) |
93.9 |
11.08 (6.96, 17.65) |
|
Suicides |
54.6 |
6.13 (4.22, 8.90) |
181.1 |
8.87 (6.03, 13.05) |
228.7 |
7.26 (5.13, 10.26) |
|
Liver diseases |
67.9 |
13.75 (9.65, 19.60) |
84.8 |
24.70 (17.59, 34.67) |
100.6 |
38.19 (24.67, 59.11) |
|
Liver cancer |
39.0 |
7.19 (5.19, 9.96) |
40.3 |
8.49 (5.72, 12.59) |
43.4 |
8.62 (5.56, 13.35) |
|
Breast cancer |
-5.9 |
1.01 (0.73, 1.39) |
13.6 |
1.47 (1.08, 2.00) |
28.6 |
1.45 (1.06, 1.98) |
|
Tuberculosis |
60.2 |
23.55 (17.20, 32.24) |
69.3 |
34.14 (19.74, 59.05) |
55.8 |
20.36 (10.53, 39.35) |
|
Diabetes mellitus |
28.7 |
14.11 (9.07, 21.93) |
51.1 |
65.78 (43.37, 99.78) |
75.5 |
116.39 (61.94, 218.69) |
|
Lung cancer |
15.9 |
4.24 (2.91, 6.17) |
25.0 |
3.77 (2.56, 5.57) |
20.3 |
2.16 (1.43, 3.27) |
|
Ischemic heart diseases |
19.0 |
7.31 (4.67, 11.46) |
38.7 |
23.08 (12.53, 42.51) |
43.9 |
18.22 (9.68, 34.28) |
|
45-64 years old |
|
|
|
|
|
|
|
Total |
1375.7 |
2.56 (1.77, 3.71) |
1641.4 |
2.96 (2.08, 4.22) |
1475.6 |
3.13 (2.22, 4.42) |
|
Transport accidents |
111.4 |
3.09 (2.49, 3.82) |
154.1 |
4.27 (3.40, 5.36) |
96.3 |
4.94 (3.92, 6.23) |
|
Gastric cancer |
204.5 |
3.93 (2.59, 5.96) |
141.0 |
3.54 (2.49, 5.02) |
72.0 |
2.59 (1.88, 3.58) |
|
Cerebrovascular diseases |
368.6 |
2.74 (1.64, 4.57) |
446.2 |
4.19 (2.55, 6.89) |
347.3 |
4.90 (3.16, 7.62) |
|
Other accidental injuries |
76.3 |
2.89 (2.43, 3.42) |
46.1 |
3.79 (2.95, 4.88) |
44.6 |
4.56 (3.48, 5.98) |
|
Suicides |
28.6 |
3.97 (2.65, 5.95) |
38.9 |
2.82 (2.19, 3.64) |
67.6 |
3.03 (2.46, 3.73) |
|
Liver diseases |
40.3 |
2.44 (1.74, 3.40) |
91.0 |
3.25 (2.18, 4.83) |
83.1 |
4.03 (2.85, 5.70) |
|
Liver cancer |
4.5 |
2.19 (1.48, 3.24) |
60.3 |
2.68 (1.75, 4.12) |
86.0 |
3.14 (1.98, 4.97) |
|
Breast cancer |
-75.4 |
0.39 (0.31, 0.50) |
-64.6 |
0.58 (0.46, 0.74) |
-42.9 |
0.71 (0.55, 0.91) |
|
Tuberculosis |
42.4 |
3.57 (2.69, 4.73) |
24.4 |
3.67 (2.73, 4.94) |
21.6 |
3.93 (2.66, 5.80) |
|
Diabetes mellitus |
24.9 |
2.31 (1.19, 4.51) |
125.4 |
4.37 (2.30, 8.31) |
147.2 |
6.58 (3.59, 12.07) |
|
Lung cancer |
3.4 |
1.54 (0.96, 2.49) |
16.8 |
2.11 (1.34, 3.34) |
33.4 |
2.42 (1.58, 3.72) |
|
Ischemic heart diseases |
-48.9 |
1.09 (0.66, 1.80) |
39.3 |
1.96 (1.20, 3.19) |
58.4 |
3.05 (1.80, 5.17) |


 PubReader
 ePub Link
 Cite
Cite

